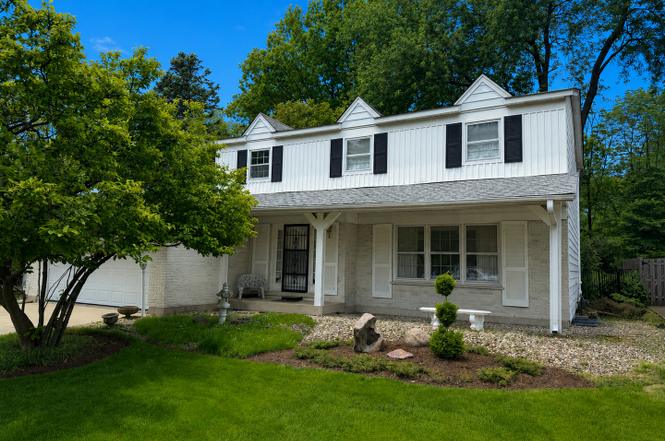
1080 Harvard Ln · Buffalo Grove, IL
Flood risk 1/10 · Minimal
- FEMA flood zone
- X (unshaded)
- Chance of flooding over 30 yrs
- 0.0%
- Est. flood insurance / yr
- $473 – $860
Fire risk 1/10 · Minimal
- Est. fire insurance / yr
- $804 – $1,492
Heat risk 2/10 · Minimal
- Hot days now (above 99°F)
- 7 days/yr
- Hot days in 30 yrs
- 14 days/yr
Wind risk 2/10 · Minimal
- Chance of severe wind over 30 yrs
- —
Air-quality risk 3/10 · Minor
- Unhealthy air days now
- 3 days/yr
- Unhealthy air days in 30 yrs
- 4 days/yr
Risk factors via First Street. Map © Google.
Why this score? — see what drove the D+ grade
The composite is a weighted blend of 9 inputs, each scored 0–100. Each bar is that input's sub-score; the figure is the points it added to the 100-point composite (weight × sub-score).
- ARV discount +15.0/15.0
- Cash flow +13.5/30.0
- DSCR +4.1/10.0
- Schools +3.9/10.0
- Livability +3.9/5.0
- Rent growth +3.3/5.0
- 1% rule +3.0/10.0
- Condition / age +2.5/5.0
- Appreciation +0.0/10.0
$425,000
🖨 Deal sheet 📄 Offer letter ✓ Due diligence
Listing remarks
Opportunity awaits in this spacious 4-bedroom, 2.5-bath home located in a highly sought-after Buffalo Grove neighborhood! Some updating and TLC will make it the perfect choice for buyers looking to build equity and create their dream home. Bring your decorating ideas! Oak hardwood floors are underneath the existing carpeting, providing an excellent opportunity to restore their original beauty. Eat in kitchen is ideal for morning coffee or homework time. Separate dining room for those family dinners, parties and holidays! Primary suite with a private full bath is a great place to relax. Full bathroom for family or guests. 1/2 bath on main level. Unfinished basement offering abundant storage
Key facts
- 7,492 sq ft lot
- 2 garage spots
- Built 1967
Neighborhood map
What this means for you Summary
Snapshot
- This is a 5-bed/3.0-bath single-family listed at $425k.
Deal economics
- At list price, monthly cash flow is $12 ($144/yr) — positive.
- The deal already cash-flows at list — no discount required.
- To meet the 1% rule (rent ≥ 1% of price), the offer needs to be $340k (20.1% below list).
- Recommended offer: $340k (20.1% below list) — sets the bar for 1% rule.
- Cap rate 6.3% vs local median 3.3% in Buffalo Grove — top-decile yield for the area; either an underpriced asset or a hidden risk that comps aren't pricing in. Stress-test before assuming the spread holds.
Location & tenants
- Location reads 77/100 on livability (#163 in IL, #3,025 nationally) — a middle-class / working-renter tenant base. Strengths: crime A+, employment A+, housing A+; Watch: amenities C-, health & safety C-, commute F.
- Township Hsd 214 (suburban): math 42% / reading 45% proficiency, ranked #103 of 620 in IL (top 17%) — families likely to look elsewhere, expect single-tenant / working-renter base with shorter leases.
- Zoned schools: Wheeling High School (math 25% / reading 30%, grade F, #215 of 693 statewide, top 31%, 1,760 students, 0% FRL).
- Zoned-school proficiency averages 28% at this address vs 44% district-wide (-16 pts) — the specific schools serving this property underperform the Township Hsd 214 average; the district grade overstates school quality for this exact location.
- Market conditions: Rents rising (+3.3%/yr); 100 active listings in the ZIP; 1 comparable units currently listed for rent nearby; high-income renter base; 6,272 units permitted in Cook County in 2024 (4,658 in 5+ unit buildings).
- This rent runs 32% of the median local income ($129k/yr) — at the standard rent-burdened threshold; future hikes will face affordability resistance.
Forward outlook
- Local home prices are declining (-3.0%/yr); year-one equity from $3k of loan paydown is wiped out by about $13k of value loss. Plan a longer hold.
Negotiation context
- Only 1 days on market — expect competitive offers; lowballing is unlikely to land.
Questions for the listing agent
- Built in 1967 — when were the roof, HVAC, electrical panel, plumbing, and water heater last replaced?
- Is there a deadline driving the sale (1031 exchange, divorce, estate, relocation)? That informs how much negotiation room exists.
- Schools are A-rated — typically a magnet for longer-tenancy family renters. What's the average tenant stay here, and is there a school-zone premium baked into asking?
- The area grade is low — what's the realistic commute time and amenity access for the typical tenant pool here? Any planned neighborhood developments (good or bad) we should know about?
- What's the average days-on-market for RENTAL listings here right now (not sales)? A rising rental-DOM trend means longer vacancies and softer asking-rent achievability than the comps imply.
- What's the recent tenant-quality profile in this submarket — average credit score on applications, eviction rate, late-payment / NSF rate, and stable-employment percentage? A property-management company in the area should have these aggregated.
- How much new for-sale + rental construction is in the pipeline within 1–3 miles? Heavy new supply typically softens prices + rents 12–24 months out; constrained supply supports both.
Investment metrics
- 1% rule
- 0.80% ✗
- Cap rate
- 6.33%
- Cash-on-cash
- 0.12%
- DSCR
- 1.01
- GRM
- 10.4
CMA / ARV
- ARV (on-the-fly)
- $572,220
- Comps found
- 12
Show comp detail 12 sales within ~0.75 mi
| Address | Dist | Beds/Ba | Sqft | Sold | Price | $/sf | Match |
|---|---|---|---|---|---|---|---|
| 159 University Dr | 0.11mi | 5/2.5 | 2,552 (-2%) | 8mo | $525,000 | $206 | 83 |
| 221 Anthony Rd | 0.05mi | 4/3.0 (-1) | 2,668 (+3%) | 10mo | $419,000 | $157 | 80 |
| 66 Downing Rd | 0.18mi | 4/2.5 (-1) | 2,580 (-1%) | 12mo | $510,000 | $198 | 73 |
| 3026 N Stratford Rd | 0.37mi | 4/3.5 (-1) | 2,650 (+2%) | 10mo | $586,000 | $221 | 65 |
| 274 University Dr | 0.14mi | 4/2.5 (-1) | 2,862 (+10%) | 10mo | $625,000 | $218 | 61 |
| 861 Saxon Pl | 0.34mi | 5/3.5 | 2,801 (+8%) | 12mo | $475,000 | $170 | 59 |
| 1306 E Best Dr | 0.63mi | 4/2.5 (-1) | 2,600 (-0%) | 6mo | $572,500 | $220 | 59 |
| 133 Selwyn Ln | 0.22mi | 4/2.5 (-1) | 2,400 (-8%) | 16mo | $479,900 | $200 | 57 |
| 3205 N Volz Dr | 0.49mi | 4/2.5 (-1) | 2,323 (-11%) | 0mo | $565,000 | $243 | 52 |
| 1530 E Fleming Dr S | 0.41mi | 4/2.5 (-1) | 2,304 (-11%) | 3mo | $670,000 | $291 | 52 |
| 3229 N Volz Dr E | 0.48mi | 4/3.0 (-1) | 2,378 (-9%) | 9mo | $595,000 | $250 | 51 |
| 2806 N Stanford Dr | 0.66mi | 4/2.5 (-1) | 2,242 (-14%) | 2mo | $585,000 | $261 | 38 |
Match score weights: distance 35% · size 25% · config 20% · recency 20%. Top-matched comps best support the ARV.
Projected returns pro-forma
-3.0% appreciation · 3.27% rent growth · sell at horizon
- IRR
- -15.9%
- Equity multiple
- 0.43×
- Total profit
- $-67,288
- Equity at exit
- $63,369
- IRR
- -7.1%
- Equity multiple
- 0.54×
- Total profit
- $-54,240
- Equity at exit
- $36,746
Cash invested: $119,000 (down + closing). Projections, not guarantees.
Landlord ↔ Tenant lean methodology
- Overall (STATE)
- 43 Moderately Tenant-Leaning
- State Illinois
- 43 Moderately Tenant-Leaning · D+7
- County
- — inherits STATE
- City
- — inherits STATE
ZIP-level market 60089
- Rents YoY
- 3.3%
- Active inventory
- 100
- Price-to-rent
- 10.4×
Monthly cashflow live
- Estimated rent
- $3,398 medium interval (Pro) →
- Mortgage (P&I)
- −$2,229
- Tax from tax record
- −$266 /mo · $3,197/yr
- Insurance
- −$177
- HOA
- −$0
- Vacancy / Maint / Mgmt
- −$714
- Net cashflow
- $12
Break-even live
UW: 25.0% down · 7.5% · 30yr · 1.5% tax · 5.0% vac · 8.0% maint · 8.0% mgmt
Financing live
Cash to close
- Down payment
- $106,250
- Closing costs
- $12,750
- Reserves months
- —
- Total cash needed
- —
Loan-product check · same deal, 3 products live
Conventional
25% down · 7.5% · 30yr
- Down + closing
- —
- Monthly P&I
- —
- Monthly cashflow
- —
- DSCR
- —
- Eligible?
- —
Personal DTI + credit; lowest rate.
DSCR
20% down · 8.5% · 30yr
- Down + closing
- —
- Monthly P&I
- —
- Monthly cashflow
- —
- DSCR
- —
- Eligible?
- —
No personal income docs; deal must DSCR.
Hard money
10% down · 12.0% · 12mo
- Down + closing
- —
- Monthly P&I
- —
- Monthly cashflow
- —
- DSCR
- —
- Eligible?
- —
Short-term bridge; refi at stabilization.
Rent comps 1 comps
| Address | Beds | Baths | Sqft | Rent | $/sqft | DOM | Units | Dist |
|---|---|---|---|---|---|---|---|---|
| 871 Lehigh Ln Buffalo Grove, IL | 4.0 | 2.5 | 2174 | $3,800 | $1.75 | 1d | 1 | 1.09mi |
Listing history 12 events
-
2026-06-18remarks 699-char remark
-
2026-06-18statusdays on market $425,000 Active 1 DOM
-
2026-06-18days on market $425,000 Active (Private) 16 DOM
-
2026-06-17days on market $425,000 Active (Private) 15 DOM
-
2026-06-16days on market $425,000 Active (Private) 14 DOM
-
2026-06-15days on market $425,000 Active (Private) 13 DOM
-
2026-06-13days on market $425,000 Active (Private) 11 DOM
-
2026-06-09days on market $425,000 Active (Private) 7 DOM
-
2026-06-08days on market $425,000 Active (Private) 6 DOM
-
2026-06-07days on market $425,000 Active (Private) 5 DOM
-
2026-06-04days on market $425,000 Active (Private) 2 DOM
-
2026-06-02$425,000 Active (Private) 1 DOM
ⓘ Source: listings_history table (triggers on properties + properties_extension) + one-shot
backfill from property_details.listing_events for pre-trigger history.
Tax reassessment forecast IL · Partial reset (capped growth)
- Current annual tax
- $3,197 · $266/mo
- Projected year-2 tax
- $6,422 · $535/mo
- Expected delta
- +$3,225/yr (+$269/mo · 100.9%)
ⓘ Screening estimate from a state-policy table — verify with the county assessor before closing.
Climate risk First Street
- Flood 1/10 Low FEMA zone X (unshaded) · 0% chance over 30 yrs
- Wildfire 1/10 Low
- Heat 2/10 Low 7 d/yr ≥99°F today · 14 d/yr by 30 yrs out
- Wind 2/10 Low
- Air quality 3/10 Moderate 3 unhealthy d/yr today · 4 by 30 yrs out
Nearby sold comps map
Loading sold comps map…
Walkable amenities ~0.75 mi
Loading nearby amenities…
Taxation est. · year 1
- Rental income
- $40,773
- − Mortgage interest
- −$23,807
- − Property taxes
- −$3,197
- − Insurance
- −$2,125
- − Repairs & maintenance
- −$3,262
- − Management
- −$3,262
- − Depreciation
- −$12,364
- Taxable loss
- −$7,242
- Est. tax savings @ 24.0%
- +$1,738
- After-tax cash flow
- $1,883/yr
For passive investors: Depreciation is non-cash, so a rental often shows a tax loss while cash-flowing — sheltering income. Rental losses are passive: they offset passive income freely, and up to $25,000/yr can offset ordinary (W-2) income if you actively participate and your MAGI is under $100k (phasing out to $0 by $150k); unused losses carry forward. On sale, claimed depreciation is recaptured at up to 25%, and gains may owe capital-gains tax (a 1031 exchange can defer both). Figures are a year-1 estimate at your 24.0% rate — not tax advice; consult a CPA.
Schools (NCES district)
- District
- Township Hsd 214
- NCES district ID
- 1704170
- Math proficiency
- 42% ▼ -10.00%
- Reading proficiency
- 45% ▼ -4.00%
- Median HH income
- $68,267
- Composite
- 39.13/100
- National rank
- #4035
- State rank
- #103 of 620 in IL
Livability — Buffalo Grove
- Score
- 77/100
- State rank
- #163
- US rank
- #3025
Category grades
Schools grade is shown separately in the Schools card above.
Census & demographics
- Census place
- Buffalo Grove, IL
- County
- Lake County · 591,991 people
- City population
- 42,872
- Metro
- Chicago-Naperville-Elgin, IL-IN-WI
- Population (ZIP)
- 42,872
- Household income
- $129,401
- Rent vs Own
- Severe rent burden
- 478.0
Population outlook (Cook County) Hauer SSP2
- Today (2025)
- 5,347,519 people
- By 2030
- 5,357,703 · +0.2%
- By 2040
- 5,324,924 · -0.4%
- By 2050
- 5,230,762 · -2.2%
- By 2075
- 4,785,735 · -10.5%
- By 2100
- 4,188,836 · -21.7%
Race, ethnicity, and origin ACS 2023
- Neighborhood character
- Diverse neighborhood (Simpson 0.57)
- Race & ethnicity
- White 59% Asian 28% Hispanic / Latino 6% Black 4% Two or more races 4%
- Hispanic origin (detail)
- Mexican 4%
- Common ancestry
- Romanian 7% Scotch-Irish 6% Subsaharan African 4%
- Foreign-born
- 37% · South Korea, Canada, China
- Languages at home
- 54% English-only · Russian/Polish/Slavic 14% Other Indo-European 9% Other Asian/Pacific 7%
Political lean MEDSL · Cook
- 2024 margin
- Solid D (+42.0) · D 70.4% · R 28.4% · Other 1.2%
- 2008→2024 swing
- -11.4pp toward R · 2008: 53.4pp · 2024: 42.0pp
- All cycles
- 2024: D+42.0 2020: D+50.3 2016: D+53.0 2012: D+49.4 2008: D+53.4
Not yet ingested
- Civics
- —
Market trends
- HPI YoY
- ▼ -287.35%
- Current HPI
- 209.9751
- Rent YoY
- ▲ 3.27%
- Metro
- Chicago-Naperville-Elgin, IL-IN-WI
- State GDP YoY
- ▲ 1.59%
- F500 in state
- 60
Industry mix (Fortune 500 HQ in IL)
| Industry | F500 HQs | Revenue |
|---|---|---|
| Insurance | 4 | $201B |
|
||
| Consumer Goods | 4 | $87B |
|
||
| Industrial Machinery | 3 | $64B |
|
||
| Healthcare | 2 | $55B |
|
||
| Retail / Pharmacy | 1 | $148B |
|
||
| Agriculture / Food | 1 | $86B |
|
||
Price history
1 event — show timeline
- 2026-06-02 Coming Soon $425,000 MRED as Distributed by MLS Grid
Property tax history
+0.6%/yrLatest (2023): $3,197 · +0.7% YoY. Source: county tax records.
Cash-flow waterfall
monthlySold comps — $/sqft
last 12 mo · ≤1 miLoading sold comps…