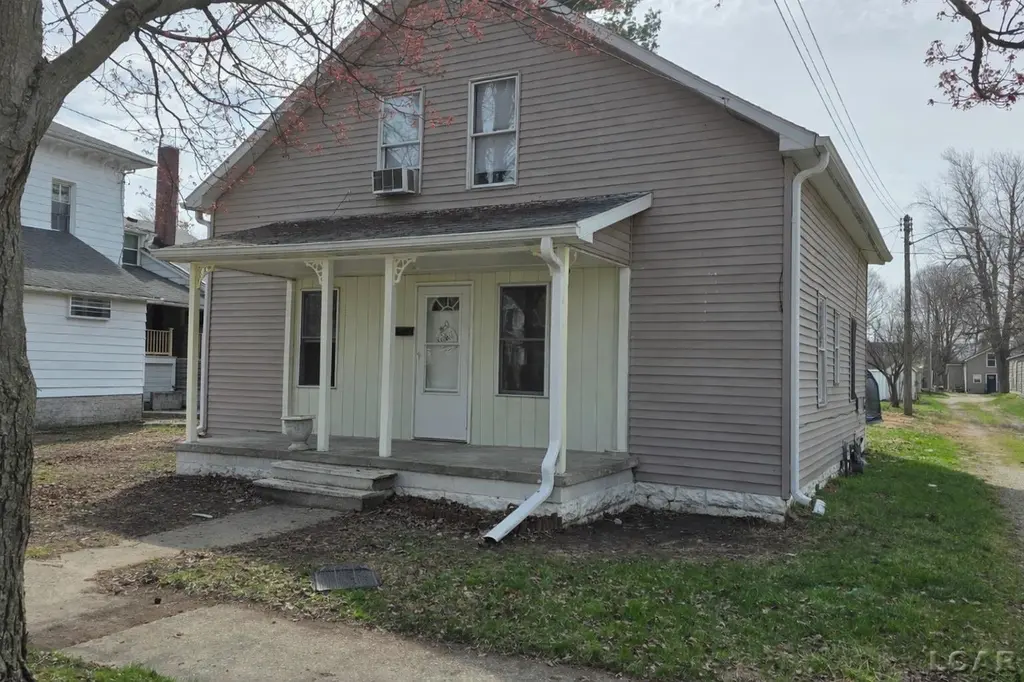
213 W Congress St · Morenci, MI
Flood risk 1/10 · Minimal
- FEMA flood zone
- X (unshaded)
- Chance of flooding over 30 yrs
- 0.0%
- Est. flood insurance / yr
- $507 – $1,088
Fire risk 1/10 · Minimal
- Est. fire insurance / yr
- $784 – $1,456
Heat risk 3/10 · Minor
- Hot days now (above 100°F)
- 7 days/yr
- Hot days in 30 yrs
- 16 days/yr
Wind risk 2/10 · Minimal
- Chance of severe wind over 30 yrs
- —
Air-quality risk 2/10 · Minimal
- Unhealthy air days now
- 1 days/yr
- Unhealthy air days in 30 yrs
- 1 days/yr
Risk factors via First Street. Map © Google.
Why this score? — see what drove the C- grade
The composite is a weighted blend of 9 inputs, each scored 0–100. Each bar is that input's sub-score; the figure is the points it added to the 100-point composite (weight × sub-score).
- ARV discount +12.6/15.0
- Cash flow +11.3/30.0
- Appreciation +10.0/10.0
- Livability +3.7/5.0
- DSCR +3.3/10.0
- Schools +3.0/10.0
- 1% rule +2.7/10.0
- Rent growth +2.5/5.0
- Condition / age +2.5/5.0
$105,000
🖨 Deal sheet 📄 Offer letter ✓ Due diligence
Listing remarks MLS
Charming 3-Bedroom, 2-Bath Home in Morenci! This lovely home features 3 bedrooms and 2 full bathrooms with main-level laundry for convenience. Enjoy 2 covered porches, front and back, perfect for relaxing or entertaining. Located just a few blocks from downtown Morenci, you’re within walking distance to parks, schools, and all the local shops and amenities.
Key facts
- 3,485 sq ft lot
- Built 1925
- Listed 72 days
Neighborhood map
What this means for you Summary
Snapshot
- This is a 3-bed/1.0-bath single-family listed at $105k.
Deal economics
- At list price, monthly cash flow is $-38 ($-459/yr) — negative.
- To cash-flow at today's rent, offer at most $98k (6.4% below list).
- To meet the 1% rule (rent ≥ 1% of price), the offer needs to be $81k (22.7% below list).
- Recommended offer: $81k (22.7% below list) — sets the bar for 1% rule.
Location & tenants
- Location reads 74/100 on livability (#167 in MI, #4,401 nationally) — a middle-class / working-renter tenant base. Strengths: crime A+, cost of living A+, health & safety A+; Watch: schools D-, amenities F, commute F.
- Morenci Area Schools (rural): math 28% / reading 43% proficiency, ranked #283 of 540 in MI (top 52%) — families likely to look elsewhere, expect single-tenant / working-renter base with shorter leases.
- Market conditions: 19 active listings in the ZIP; 2 comparable units currently listed for rent nearby; 137 units permitted in Lenawee County in 2024 (0 in 5+ unit buildings).
- This rent is only 16% of the median local income ($61k/yr) — well below the 30% rent-burden line; pricing power to push rent on renewal without tenant pushback.
Forward outlook
- In year one you build about $11k of equity ($726 loan paydown + $10k appreciation (10.0% local appreciation)).
- Lenawee County population projected at -18% by 2050 — secular population decline; favor cash flow + early exit over multi-decade hold.
- At projected returns (10.0% appreciation + 3.0% rent growth), your $29k cash investment doubles in ~3 years — after that, you're playing with house money.
- By year 4, paydown + projected appreciation supports a ~$40k cash-out refi (75% LTV) — recoverable capital for the next deal without selling this one.
Negotiation context
- It's been on market 72 days — a 6% lower offer ($99k) is reasonable based on typical stale-listing flexibility.
- 4 sale attempts since 3y ago; this cycle's ask has dropped $10k (9%) from the opening price — seller is motivated, your offer sets the floor, not the list.
Risks & watch-outs
- Watch-outs: built in 1925 — expect roof / HVAC / electrical / plumbing capex.
Questions for the listing agent
- What do current leases actually rent for vs. the listed asking? Can we see a recent rent roll and the last 12 months of T-12 income?
- It's been on market 72 days. Have you received any prior offers? Is the seller open to a 23% concession, seller financing, or rate buy-down credit?
- Built in 1925 — when were the roof, HVAC, electrical panel, plumbing, and water heater last replaced?
- Why hasn't it sold? Are there any deal-killer items the seller is aware of (foundation, flood, title, zoning, code violations)?
- Is there a deadline driving the sale (1031 exchange, divorce, estate, relocation)? That informs how much negotiation room exists.
- Schools are D-rated, which usually means shorter tenancies and higher turnover. Who's the typical renter profile here, and what's been the actual vacancy rate?
- What's the average days-on-market for RENTAL listings here right now (not sales)? A rising rental-DOM trend means longer vacancies and softer asking-rent achievability than the comps imply.
- What's the recent tenant-quality profile in this submarket — average credit score on applications, eviction rate, late-payment / NSF rate, and stable-employment percentage? A property-management company in the area should have these aggregated.
- How much new for-sale + rental construction is in the pipeline within 1–3 miles? Heavy new supply typically softens prices + rents 12–24 months out; constrained supply supports both.
Investment metrics
- 1% rule
- 0.77% ✗
- Cap rate
- 5.86%
- Cash-on-cash
- -1.56%
- DSCR
- 0.93
- GRM
- 10.8
CMA / ARV
- ARV (median comp)
- $118,491
- List price
- $105,000
- Delta
- -11.39%
- Verdict
- UNDERPRICED
- Comps
- 20 within 1.0 mi
Show comp detail 12 sales within ~0.75 mi
| Address | Dist | Beds/Ba | Sqft | Sold | Price | $/sf | Match |
|---|---|---|---|---|---|---|---|
| 124 W Walnut Rd | 0.10mi | 2/1.0 (-1) | 942 (-7%) | 2mo | $123,500 | $131 | 76 |
| 714 North St | 0.21mi | 3/1.0 | 1,094 (+8%) | 6mo | $68,500 | $63 | 73 |
| 223 Page St | 0.40mi | 2/1.0 (-1) | 1,010 (-0%) | 5mo | $106,000 | $105 | 71 |
| 120 E Union St | 0.19mi | 3/1.5 | 1,120 (+10%) | 5mo | $55,000 | $49 | 68 |
| 234 E Union St | 0.28mi | 3/1.0 | 1,132 (+12%) | 4mo | $114,000 | $101 | 65 |
| 134 W Lagrange St | 0.27mi | 2/1.0 (-1) | 1,097 (+8%) | 11mo | $105,000 | $96 | 60 |
| 115 East Street North | 0.33mi | 2/1.0 (-1) | 897 (-12%) | 3mo | $69,000 | $77 | 58 |
| 136 Orchard St | 0.25mi | 2/1.0 (-1) | 1,165 (+15%) | 3mo | $99,000 | $85 | 56 |
| 402 Pearl St | 0.52mi | 3/1.0 | 1,150 (+13%) | 1mo | $100,000 | $87 | 53 |
| 715 W Main St | 0.49mi | 2/2.0 (-1) | 1,056 (+4%) | 12mo | $94,900 | $90 | 52 |
| 101 E Chestnut St | 0.19mi | 2/1.0 (-1) | 864 (-15%) | 14mo | $95,000 | $110 | 50 |
| 804 W Main St | 0.56mi | 2/1.0 (-1) | 916 (-10%) | 11mo | $165,000 | $180 | 43 |
Match score weights: distance 35% · size 25% · config 20% · recency 20%. Top-matched comps best support the ARV.
Projected returns pro-forma
10.0% appreciation · 3.0% rent growth · sell at horizon
- IRR
- 23.2%
- Equity multiple
- 2.86×
- Total profit
- $54,731
- Equity at exit
- $94,592
- IRR
- 20.6%
- Equity multiple
- 6.55×
- Total profit
- $163,060
- Equity at exit
- $203,992
Cash invested: $29,400 (down + closing). Projections, not guarantees.
Landlord ↔ Tenant lean methodology
- Overall (STATE)
- 62 Landlord-Friendly
- State Michigan
- 62 Landlord-Friendly · EVEN
- County
- — inherits STATE
- City
- — inherits STATE
ZIP-level market 49256
- Home prices YoY
- 8.7%
- Active inventory
- 19
- Price-to-rent
- 10.8×
Monthly cashflow live
- Estimated rent
- $812 medium interval (Pro) →
- Mortgage (P&I)
- −$551
- Tax from tax record
- −$85 /mo · $1,023/yr
- Insurance
- −$44
- HOA
- −$0
- Vacancy / Maint / Mgmt
- −$170
- Net cashflow
- $-38
Break-even live
UW: 25.0% down · 7.5% · 30yr · 1.5% tax · 5.0% vac · 8.0% maint · 8.0% mgmt
Financing live
Cash to close
- Down payment
- $26,250
- Closing costs
- $3,150
- Reserves months
- —
- Total cash needed
- —
Loan-product check · same deal, 3 products live
Conventional
25% down · 7.5% · 30yr
- Down + closing
- —
- Monthly P&I
- —
- Monthly cashflow
- —
- DSCR
- —
- Eligible?
- —
Personal DTI + credit; lowest rate.
DSCR
20% down · 8.5% · 30yr
- Down + closing
- —
- Monthly P&I
- —
- Monthly cashflow
- —
- DSCR
- —
- Eligible?
- —
No personal income docs; deal must DSCR.
Hard money
10% down · 12.0% · 12mo
- Down + closing
- —
- Monthly P&I
- —
- Monthly cashflow
- —
- DSCR
- —
- Eligible?
- —
Short-term bridge; refi at stabilization.
Rent comps 2 comps
| Address | Beds | Baths | Sqft | Rent | $/sqft | DOM | Units | Dist |
|---|---|---|---|---|---|---|---|---|
| 240 Gorham St Morenci, MI | 1.0–2.0 | 1.0 | 662 | $875 | $1.32 | 23d | 1 | 0.57mi |
| 126 N Washington St Unit 4 Morenci, MI | 2.0 | 1.0 | 700 | $750 | $1.07 | 21d | 1 | 0.59mi |
Listing history 31 events
-
2026-06-18days on market $105,000 Active 72 DOM
-
2026-06-17days on market $105,000 Active 71 DOM
-
2026-06-16days on market $105,000 Active 70 DOM
-
2026-06-15days on market $105,000 Active 69 DOM
-
2026-06-13days on market $105,000 Active 67 DOM
-
2026-06-12days on market $105,000 Active 66 DOM
-
2026-06-09days on market $105,000 Active 63 DOM
-
2026-06-08days on market $105,000 Active 62 DOM
-
2026-06-07days on market $105,000 Active 61 DOM
-
2026-06-05days on market $105,000 Active 59 DOM
-
2026-06-04days on market $105,000 Active 57 DOM
-
2026-06-02days on market $105,000 Active 56 DOM
-
2026-06-01days on market $105,000 Active 55 DOM
-
2026-05-31days on market $105,000 Active 54 DOM
-
2026-05-31days on market $105,000 Active 53 DOM
-
2026-05-12price $105,000 366-char remark
Show marketing remark (360 chars)
Charming 3-Bedroom, 2-Bath Home in Morenci! This lovely home features 3 bedrooms and 2 full bathrooms with main-level laundry for convenience. Enjoy 2 covered porches, front and back, perfect for relaxing or entertaining. Located just a few blocks from downtown Morenci, you're within walking distance to parks, schools, and all the local shops and amenities.
-
2026-05-12price $105,000 360-char remark
Show marketing remark (360 chars)
Charming 3-Bedroom, 2-Bath Home in Morenci! This lovely home features 3 bedrooms and 2 full bathrooms with main-level laundry for convenience. Enjoy 2 covered porches, front and back, perfect for relaxing or entertaining. Located just a few blocks from downtown Morenci, you're within walking distance to parks, schools, and all the local shops and amenities.
-
2026-04-07$115,000 Active 360-char remark
Show marketing remark (360 chars)
Charming 3-Bedroom, 2-Bath Home in Morenci! This lovely home features 3 bedrooms and 2 full bathrooms with main-level laundry for convenience. Enjoy 2 covered porches, front and back, perfect for relaxing or entertaining. Located just a few blocks from downtown Morenci, you're within walking distance to parks, schools, and all the local shops and amenities.
-
2026-04-06$115,000 Active 366-char remark
Show marketing remark (366 chars)
Charming 3-Bedroom, 2-Bath Home in Morenci! This lovely home features 3 bedrooms and 2 full bathrooms with main-level laundry for convenience. Enjoy 2 covered porches, front and back, perfect for relaxing or entertaining. Located just a few blocks from downtown Morenci, you’re within walking distance to parks, schools, and all the local shops and amenities.
-
2023-09-06soldstatus $124,000
-
2023-08-31soldstatus $124,000 Sold
-
2023-08-31soldstatus $124,000 Closed
-
2023-07-25status Pending
-
2023-07-25status Pending
-
2023-04-19price $135,000
-
2023-04-19price $135,000
-
2023-03-04price $144,900
-
2023-03-04price $144,900
-
2023-01-31$149,900 Active
-
2023-01-31$149,900 Active
-
2007-05-09soldstatus $52,000
ⓘ Source: listings_history table (triggers on properties + properties_extension) + one-shot
backfill from property_details.listing_events for pre-trigger history.
Tax reassessment forecast MI · Partial reset (capped growth)
- Current annual tax
- $1,023 · $85/mo
- Projected year-2 tax
- $1,320 · $110/mo
- Expected delta
- +$297/yr (+$25/mo · 29.1%)
ⓘ Screening estimate from a state-policy table — verify with the county assessor before closing.
Climate risk First Street
- Flood 1/10 Low FEMA zone X (unshaded) · 0% chance over 30 yrs
- Wildfire 1/10 Low
- Heat 3/10 Moderate 7 d/yr ≥100°F today · 16 d/yr by 30 yrs out
- Wind 2/10 Low
- Air quality 2/10 Low 1 unhealthy d/yr today · 1 by 30 yrs out
Nearby sold comps map
Loading sold comps map…
Walkable amenities ~0.75 mi
Loading nearby amenities…
Taxation est. · year 1
- Rental income
- $9,741
- − Mortgage interest
- −$5,882
- − Property taxes
- −$1,023
- − Insurance
- −$525
- − Repairs & maintenance
- −$779
- − Management
- −$779
- − Depreciation
- −$3,055
- Taxable loss
- −$2,301
- Est. tax savings @ 24.0%
- +$552
- After-tax cash flow
- $93/yr
For passive investors: Depreciation is non-cash, so a rental often shows a tax loss while cash-flowing — sheltering income. Rental losses are passive: they offset passive income freely, and up to $25,000/yr can offset ordinary (W-2) income if you actively participate and your MAGI is under $100k (phasing out to $0 by $150k); unused losses carry forward. On sale, claimed depreciation is recaptured at up to 25%, and gains may owe capital-gains tax (a 1031 exchange can defer both). Figures are a year-1 estimate at your 24.0% rate — not tax advice; consult a CPA.
Schools (NCES district)
- District
- Morenci Area Schools
- NCES district ID
- 2624570
- Math proficiency
- 28% ▼ -5.00%
- Reading proficiency
- 43% ▲ 1.00%
- Median HH income
- $43,503
- Composite
- 30.09/100
- National rank
- #6340
- State rank
- #283 of 540 in MI
Livability — Morenci
- Score
- 74/100
- State rank
- #167
- US rank
- #4401
Category grades
Schools grade is shown separately in the Schools card above.
Census & demographics
- Census place
- Morenci, MI
- County
- Lenawee · 10,162 people
- Population (ZIP)
- 3,830
- Household income
- $60,982
- Rent vs Own
Population outlook (Lenawee County) Hauer SSP2
- Today (2025)
- 95,497 people
- By 2030
- 92,722 · -2.9%
- By 2040
- 85,641 · -10.3%
- By 2050
- 77,971 · -18.4%
- By 2075
- 60,043 · -37.1%
- By 2100
- 41,468 · -56.6%
Race, ethnicity, and origin ACS 2023
- Neighborhood character
- Predominantly White (90%)
- Race & ethnicity
- White 90% Hispanic / Latino 6% Two or more races 5%
- Hispanic origin (detail)
- Mexican 6%
- Common ancestry
- Romanian 2% Lithuanian 2% Italian 2%
- Foreign-born
- 1% · Canada
- Languages at home
- 97% English-only · Spanish 2%
Political lean MEDSL · Lenawee
- 2024 margin
- Strong R (+23.0) · D 37.8% · R 60.8% · Other 1.4%
- 2008→2024 swing
- -28.1pp toward R · 2008: 5.1pp · 2024: -23.0pp
- All cycles
- 2024: R+23.0 2020: R+19.9 2016: R+21.1 2012: R+1.3 2008: D+5.1
Not yet ingested
- Civics
- —
Market trends
- HPI YoY
- ▲ 24.27%
- Current HPI
- 304.604
- Rent YoY
- —
- Metro
- —
- State GDP YoY
- ▲ 1.37%
- F500 in state
- 28
Industry mix (Fortune 500 HQ in MI)
| Industry | F500 HQs | Revenue |
|---|---|---|
| Automotive Parts | 3 | $48B |
|
||
| Automotive | 2 | $372B |
|
||
| Chemicals | 1 | $45B |
|
||
| Automotive Retail | 1 | $29B |
|
||
| Healthcare / Medical Devices | 1 | $23B |
|
||
| Automotive Technology | 1 | $20B |
|
||
Price history
+101.9% since first listed16 events — show timeline
- 2026-05-12 Price Changed $105,000 MiRealSource-MiMLS
- 2026-05-12 Price Changed $105,000 REALCOMP
- 2026-04-07 Listed $115,000 REALCOMP
- 2026-04-06 Listed $115,000 MiRealSource-MiMLS
- 2023-09-06 Sold (Public Records) $124,000 Public Records
- 2023-08-31 Sold (MLS) $124,000 MiRealSource-MiMLS
- 2023-08-31 Sold (MLS) $124,000 REALCOMP
- 2023-07-25 Pending — REALCOMP
- 2023-07-25 Pending — MiRealSource-MiMLS
- 2023-04-19 Price Changed $135,000 MiRealSource-MiMLS
- 2023-04-19 Price Changed $135,000 REALCOMP
- 2023-03-04 Price Changed $144,900 MiRealSource-MiMLS
- 2023-03-04 Price Changed $144,900 REALCOMP
- 2023-01-31 Listed $149,900 MiRealSource-MiMLS
- 2023-01-31 Listed $149,900 REALCOMP
- 2007-05-09 Sold (Public Records) $52,000 Public Records
Property tax history
-2.4%/yrLatest (2025): $1,023 · -35.5% YoY. Source: county tax records.
Cash-flow waterfall
monthlySold comps — $/sqft
last 12 mo · ≤1 miLoading sold comps…