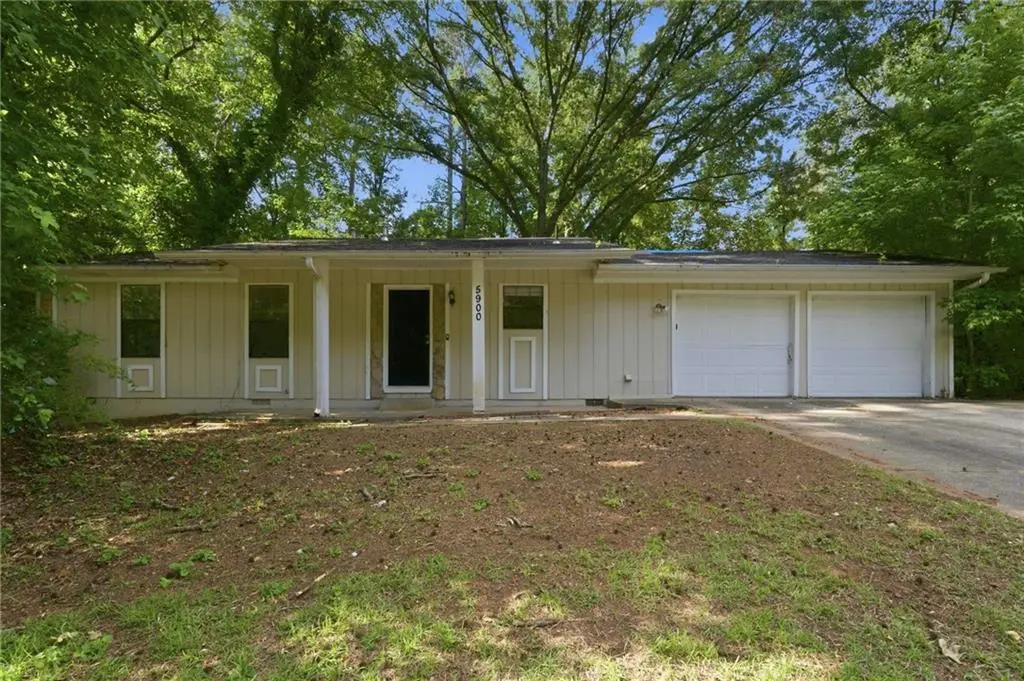
5900 Dart Dr · Redan, GA
Flood risk 1/10 · Minimal
- FEMA flood zone
- X (unshaded)
- Chance of flooding over 30 yrs
- 0.0%
- Est. flood insurance / yr
- $507 – $1,088
Fire risk 1/10 · Minimal
- Est. fire insurance / yr
- $963 – $1,789
Heat risk 5/10 · Moderate
- Hot days now (above 104°F)
- 7 days/yr
- Hot days in 30 yrs
- 18 days/yr
Wind risk 5/10 · Moderate
- Chance of severe wind over 30 yrs
- 26.0%
Air-quality risk 5/10 · Moderate
- Unhealthy air days now
- 7 days/yr
- Unhealthy air days in 30 yrs
- 10 days/yr
Risk factors via First Street. Map © Google.
Why this score? — see what drove the B+ grade
The composite is a weighted blend of 9 inputs, each scored 0–100. Each bar is that input's sub-score; the figure is the points it added to the 100-point composite (weight × sub-score).
- Cash flow +30.0/30.0
- ARV discount +15.0/15.0
- 1% rule +10.0/10.0
- DSCR +10.0/10.0
- Livability +3.2/5.0
- Rent growth +2.8/5.0
- Condition / age +2.5/5.0
- Schools +2.1/10.0
- Appreciation +0.0/10.0
$115,000
🖨 Deal sheet 📄 Offer letter ✓ Due diligence
Listing remarks MLS
Welcome to 5900 Dart Drive, a single-story ranch offering a functional layout and plenty of potential. The home features three bedrooms, two full bathrooms, a family room with a fireplace, and a dining area that connects to the kitchen. Outside, the spacious backyard and deck provide ample room for outdoor enjoyment and entertaining. An attached two-car garage adds convenience and storage space. While the property will benefit from renovations and updates, it presents an excellent opportunity for investors, renovators, or buyers looking to customize a home to their tastes. Conveniently located near shopping, dining, parks, and major commuter routes, this property offers a chance to create value and make it your own.
Key facts
- Spacious backyard
- Single-story ranch
- 0.37 acre lot
Tags
Property features AI
Exterior
- Parking: Driveway; Attached garage with 2 garage spaces; Open parking available
- Utilities: Water: other; Electric: other; Sewer: other; Utilities: other
- Home design: One-level home
- Construction: Frame construction with wood siding; Composition roof; Slab foundation; Resale condition
- Exterior features: Deck; Asphalt road frontage on a city street
Interior
- Kitchen: Eat-in kitchen with stained cabinets; Solid surface counters; Open view to the family room; Dishwasher
- Bedrooms: Three main-level bedrooms
- Flooring: Other flooring
- Bathrooms: Two full bathrooms; Master bath with tub/shower combination
- Heating & cooling: Natural gas heating; Central air conditioning
- Interior features: Entrance foyer; One fireplace located in the family room; No shared/common walls; Crawl space basement
- Laundry & utility: Laundry located in the kitchen
Neighborhood map
What this means for you Summary
Snapshot
- This is a 3-bed/2.0-bath single-family listed at $115k.
Deal economics
- At list price, monthly cash flow is $491 ($6k/yr) — positive.
- The deal already cash-flows at list — no discount required.
- Meets the 1% rule at list price ($2k rent vs $115k).
- Cap rate 11.4% vs local median 5.4% in Redan — top-decile yield for the area; either an underpriced asset or a hidden risk that comps aren't pricing in. Stress-test before assuming the spread holds.
Location & tenants
- Location reads 64/100 on livability (#274 in GA) — a middle-class / working-renter tenant base. Strengths: cost of living A+, housing A+; Watch: crime D, amenities F, commute F.
- Dekalb County (suburban): math 19% / reading 28% proficiency, ranked #125 of 174 in GA (top 72%) — low school quality limits family demand, transient renter base, plan for 1-2y turnover; 68% free/reduced lunch — lower-income household profile, screen leases tightly.
- Zoned schools: Redan Elementary School (math 8% / reading 12%, grade F, #1,092 of 1,228 statewide, top 91%, 521 students, 100% FRL); Lithonia Middle School (math 8% / reading 17%, grade F, #411 of 470 statewide, top 87%, 1,214 students, 100% FRL); Lithonia High School (math 2% / reading 17%, grade F, #365 of 424 statewide, top 88%, 1,483 students, 100% FRL) — zoned schools average 100% FRL vs 68% district-wide (32 pts higher); higher-poverty schools than district average — tighter screening recommended.
- Zoned-school proficiency averages 11% at this address vs 24% district-wide (-13 pts) — the specific schools serving this property underperform the Dekalb County average; the district grade overstates school quality for this exact location.
- Market conditions: Rents rising (+1.2%/yr); 435 active listings in the ZIP; 40 comparable units currently listed for rent nearby; rentals leasing fast (median 13d on market — plan ~1-2 weeks tenant-placement turnaround); 1,240 units permitted in DeKalb County in 2024 (385 in 5+ unit buildings).
- This rent runs 35% of the median local income ($62k/yr) — at the standard rent-burdened threshold; future hikes will face affordability resistance.
Forward outlook
- Local home prices are declining (-3.0%/yr); year-one equity from $795 of loan paydown is wiped out by about $3k of value loss. Plan a longer hold.
- DeKalb County population projected at +28% by 2050 — long-run rental-demand tailwind backs the buy-and-hold thesis.
- At projected returns (-3.0% appreciation + 1.2% rent growth), your $32k cash investment doubles in ~8 years — after that, you're playing with house money.
Negotiation context
- Only 8 days on market — expect competitive offers; lowballing is unlikely to land.
- 4 sale attempts since 12y ago; this cycle's ask has dropped $25k (18%) from the opening price — seller is motivated, your offer sets the floor, not the list.
Risks & watch-outs
- Watch-outs: property tax is 3.0% of price.
- Climate carrying-cost: moderate wind risk, 26% chance of damaging wind over 30y; extreme-heat days projected 7→18/yr by 2055 (HVAC capex compounding) — expect insurance premiums to compound above CPI over the hold.
Questions for the listing agent
- Property tax is high relative to price — has the assessment been appealed recently, and will the sale trigger a re-assessment?
- Is there a deadline driving the sale (1031 exchange, divorce, estate, relocation)? That informs how much negotiation room exists.
- Schools are B-rated — typically a magnet for longer-tenancy family renters. What's the average tenant stay here, and is there a school-zone premium baked into asking?
- Crime grade is D in this area — have there been break-ins, vandalism, or insurance claims at this property in the last 3 years? What carrier currently insures it and at what premium?
- What's the average days-on-market for RENTAL listings here right now (not sales)? A rising rental-DOM trend means longer vacancies and softer asking-rent achievability than the comps imply.
- What's the recent tenant-quality profile in this submarket — average credit score on applications, eviction rate, late-payment / NSF rate, and stable-employment percentage? A property-management company in the area should have these aggregated.
- How much new for-sale + rental construction is in the pipeline within 1–3 miles? Heavy new supply typically softens prices + rents 12–24 months out; constrained supply supports both.
Investment metrics
- 1% rule
- 1.57% ✓
- Cap rate
- 11.42%
- Cash-on-cash
- 18.32%
- DSCR
- 1.81
- GRM
- 5.3
CMA / ARV
- ARV (on-the-fly)
- $202,272
- Comps found
- 12
Show comp detail 12 sales within ~0.75 mi
| Address | Dist | Beds/Ba | Sqft | Sold | Price | $/sf | Match |
|---|---|---|---|---|---|---|---|
| 5854 Bobbin Ln | 0.15mi | 3/2.0 | 1,176 (0%) | 13mo | $200,000 | $170 | 82 |
| 1821 Herringbone Holw | 0.30mi | 3/2.0 | 1,152 (-2%) | 2mo | $180,000 | $156 | 81 |
| 1829 Herringbone Holw | 0.31mi | 3/2.0 | 1,152 (-2%) | 11mo | $255,000 | $221 | 73 |
| 5676 Marbut Rd | 0.53mi | 3/2.0 | 1,215 (+3%) | 1mo | $225,000 | $185 | 69 |
| 1836 Gingham Ct | 0.62mi | 3/2.0 | 1,170 (-0%) | 2mo | $205,000 | $175 | 69 |
| 1914 Taffeta Trl | 0.63mi | 3/2.0 | 1,189 (+1%) | 1mo | $205,000 | $172 | 68 |
| 1815 Herringbone Holw | 0.28mi | 3/2.0 | 1,204 (+2%) | 18mo | $169,000 | $140 | 68 |
| 1803 Gingham Ct | 0.66mi | 3/2.0 | 1,170 (-0%) | 6mo | $173,000 | $148 | 64 |
| 2067 Singer Way | 0.28mi | 4/2.0 (+1) | 1,296 (+10%) | 16mo | $285,000 | $220 | 51 |
| 2083 Mallard Way | 0.71mi | 3/2.0 | 1,200 (+2%) | 17mo | $168,000 | $140 | 49 |
| 2067 Wellborn Close | 0.54mi | 3/2.5 | 1,333 (+13%) | 7mo | $225,000 | $169 | 45 |
| 1665 Dunbarton Dr | 0.75mi | 3/2.0 | 1,269 (+8%) | 9mo | $220,000 | $173 | 44 |
Match score weights: distance 35% · size 25% · config 20% · recency 20%. Top-matched comps best support the ARV.
Projected returns pro-forma
-3.0% appreciation · 1.18% rent growth · sell at horizon
- IRR
- 7.7%
- Equity multiple
- 1.30×
- Total profit
- $9,529
- Equity at exit
- $17,147
- IRR
- 15.2%
- Equity multiple
- 2.12×
- Total profit
- $36,197
- Equity at exit
- $9,943
Cash invested: $32,200 (down + closing). Projections, not guarantees.
Landlord ↔ Tenant lean methodology
- Overall (STATE)
- 90 Strongly Landlord-Friendly
- State Georgia
- 90 Strongly Landlord-Friendly · R+3
- County
- — inherits STATE
- City
- — inherits STATE
ZIP-level market 30058
- Home prices YoY
- -21.4%
- Rents YoY
- 1.2%
- Active inventory
- 435
- Price-to-rent
- 5.3×
Monthly cashflow live
- Estimated rent
- $1,810 high interval (Pro) →
- Mortgage (P&I)
- −$603
- Tax from tax record
- −$287 /mo · $3,447/yr
- Insurance
- −$48
- HOA
- −$0
- Vacancy / Maint / Mgmt
- −$380
- Net cashflow
- $491
Break-even live
UW: 25.0% down · 7.5% · 30yr · 1.5% tax · 5.0% vac · 8.0% maint · 8.0% mgmt
Financing live
Cash to close
- Down payment
- $28,750
- Closing costs
- $3,450
- Reserves months
- —
- Total cash needed
- —
Loan-product check · same deal, 3 products live
Conventional
25% down · 7.5% · 30yr
- Down + closing
- —
- Monthly P&I
- —
- Monthly cashflow
- —
- DSCR
- —
- Eligible?
- —
Personal DTI + credit; lowest rate.
DSCR
20% down · 8.5% · 30yr
- Down + closing
- —
- Monthly P&I
- —
- Monthly cashflow
- —
- DSCR
- —
- Eligible?
- —
No personal income docs; deal must DSCR.
Hard money
10% down · 12.0% · 12mo
- Down + closing
- —
- Monthly P&I
- —
- Monthly cashflow
- —
- DSCR
- —
- Eligible?
- —
Short-term bridge; refi at stabilization.
Rent comps 40 comps
| Address | Beds | Baths | Sqft | Rent | $/sqft | DOM | Units | Dist |
|---|---|---|---|---|---|---|---|---|
| 5663 Saint Thomas Dr Lithonia, GA | 4.0 | 2.0 | 1230 | $1,595 | $1.30 | 12d | 1 | 0.52mi |
| 2073 Raintree Pl Lithonia, GA | 3.0 | 2.5 | 1439 | $2,000 | $1.39 | 24d | 1 | 0.64mi |
| 2073 Raintree Pl Lithonia, GA | 3.0 | 2.5 | 1439 | $2,000 | $1.39 | 3d | 1 | 0.64mi |
| 1893 Gingham Way Lithonia, GA | 3.0 | 2.0 | 1144 | $1,730 | $1.51 | 16d | 1 | 0.68mi |
| 5579 Marbut Rd Lithonia, GA | 3.0 | 2.5 | 1280 | $1,850 | $1.45 | 43d | 1 | 0.74mi |
| 6158 Raintree Bnd Lithonia, GA | 3.0 | 2.0 | 1429 | $1,856 | $1.30 | 5d | 1 | 0.78mi |
| 5812 Wind Gate Ln Lithonia, GA | 3.0 | 2.5 | 1372 | $1,700 | $1.24 | 43d | 1 | 0.84mi |
| 5811 Strathmoor Manor Cir Lithonia, GA | 2.0 | 1.5 | 1044 | $1,560 | $1.49 | 12d | 1 | 0.84mi |
| 5823 Strathmoor Manor Cir Lithonia, GA | 3.0 | 2.5 | 1348 | $1,925 | $1.43 | 24d | 1 | 0.84mi |
| 5791 Strathmoor Manor Cir Lithonia, GA | 2.0 | 2.5 | 1428 | $1,600 | $1.12 | 21d | 1 | 0.88mi |
| 5883 Old Wellborn Trce Lithonia, GA | 3.0 | 2.0 | 1444 | $1,745 | $1.21 | 12d | 1 | 0.88mi |
| 5798 Strathmoor Manor Cir Lithonia, GA | 3.0 | 2.5 | 1347 | $1,575 | $1.17 | 43d | 1 | 0.88mi |
| 5536 Downs Way Lithonia, GA | 3.0 | 2.0 | 1400 | $1,600 | $1.14 | 43d | 1 | 0.88mi |
| 5712 Windfall Ln Lithonia, GA | 2.0 | 2.5 | 1372 | $1,681 | $1.23 | 5d | 1 | 0.88mi |
| 5720 Windfall Ln Lithonia, GA | 2.0 | 2.5 | 1372 | $1,500 | $1.09 | 43d | 1 | 0.89mi |
| 5792 Strathmoor Manor Cir Lithonia, GA | 2.0 | 2.5 | 1428 | $1,700 | $1.19 | 43d | 1 | 0.89mi |
| 2093 Drake Ct Lithonia, GA | 3.0 | 2.0 | 1168 | $1,494 | $1.28 | 3d | 1 | 0.89mi |
| 5739 Windfall Ln Lithonia, GA | 2.0 | 2.5 | 1342 | $1,625 | $1.21 | 12d | 1 | 0.90mi |
| 1610 Burnstone Dr Stone Mountain, GA | 3.0 | 2.0 | 1370 | $1,850 | $1.35 | 43d | 1 | 0.92mi |
| 5863 Strathmoor Manor Cir Lithonia, GA | 3.0 | 2.5 | 1347 | $1,650 | $1.22 | 2d | 1 | 0.92mi |
| 5876 Strathmoor Manor Cir Unit 1 Lithonia, GA | 3.0 | 2.5 | 1400 | $1,295 | $0.93 | 24d | 1 | 0.92mi |
| 5687 Windfall Ln Lithonia, GA | 2.0 | 2.0 | 1372 | $1,395 | $1.02 | 24d | 1 | 0.93mi |
| 5663 Windfall Ln Lithonia, GA | 3.0 | 2.5 | 1272 | $1,650 | $1.30 | 24d | 1 | 0.94mi |
| 5663 Windfall Ln Lithonia, GA | 3.0 | 2.5 | 1272 | $1,650 | $1.30 | 43d | 1 | 0.94mi |
| 6164 Saint Christophers Ct Lithonia, GA | 3.0 | 2.5 | 1340 | $1,730 | $1.29 | 20d | 1 | 0.94mi |
| 5749 Strathmoor Manor Cir Lithonia, GA | 2.0 | 1.5 | 1046 | $1,350 | $1.29 | 5d | 1 | 0.97mi |
| 5625 Strathmoor Manor Cir Lithonia, GA | 3.0 | 2.5 | 1336 | $1,550 | $1.16 | 2d | 1 | 0.97mi |
| 2286 Strathmoor Manor Dr Lithonia, GA | 3.0 | 2.5 | 1348 | $1,675 | $1.24 | 1d | 1 | 1.01mi |
| 5946 Crescent Ridge Ct Lithonia, GA | 3.0 | 2.0 | 1278 | $1,725 | $1.35 | 5d | 1 | 1.02mi |
| 2267 Cherokee Valley Dr Lithonia, GA | 3.0 | 2.0 | 1176 | $1,691 | $1.44 | 5d | 1 | 1.02mi |
| 2070 Corners Cir Lithonia, GA | 3.0 | 2.0 | 1392 | $1,620 | $1.16 | 24d | 1 | 1.04mi |
| 1874 Vauxhall Dr Lithonia, GA | 3.0 | 2.0 | 1367 | $1,595 | $1.17 | 2d | 1 | 1.05mi |
| 2325 Woodcrest Walk Lithonia, GA | 1.0–2.0 | 1.0–2.0 | 788 | $1,399 | $1.78 | 1d | 17 | 1.13mi |
| 6350 Laurel Post Dr Lithonia, GA | 3.0 | 2.0 | 1344 | $1,745 | $1.30 | 43d | 1 | 1.13mi |
| 6387 Laurel Post Dr Lithonia, GA | 3.0 | 2.5 | 1496 | $1,699 | $1.14 | 43d | 1 | 1.18mi |
| 1652 Downs Xing Stone Mountain, GA | 3.0 | 2.5 | 1376 | $1,675 | $1.22 | 5d | 1 | 1.20mi |
| 1717 Panola Rd Stone Mountain, GA | 3.0–4.0 | 2.5 | 2107 | $2,369 | $1.12 | 1d | 97 | 1.21mi |
| 6290 Marbut Farms Ln Lithonia, GA | 3.0 | 2.5 | 1392 | $1,780 | $1.28 | 5d | 1 | 1.21mi |
| 6388 Charter Way Lithonia, GA | 2.0 | 2.0 | 996 | $1,295 | $1.30 | 5d | 1 | 1.23mi |
| 6416 Phillips Creek Dr Lithonia, GA | 3.0 | 2.0 | 1365 | $1,928 | $1.41 | 5d | 1 | 1.24mi |
Listing history 6 events
-
2026-06-18days on market $115,000 Active 8 DOM
-
2026-06-17days on market $115,000 Active 7 DOM
-
2026-06-16pricedays on market $115,000 Active 6 DOM
-
2026-06-15days on market $139,900 Active 5 DOM
-
2026-06-13remarks 699-char remark
-
2026-06-13$139,900 Active 3 DOM
ⓘ Source: listings_history table (triggers on properties + properties_extension) + one-shot
backfill from property_details.listing_events for pre-trigger history.
Tax reassessment forecast GA · Resets to sale price
- Current annual tax
- $3,447 · $287/mo
- Projected year-2 tax
- $3,447 · $287/mo
- Expected delta
- $0/yr ($0/mo · 0.0%)
ⓘ Screening estimate from a state-policy table — verify with the county assessor before closing.
Climate risk First Street
- Flood 1/10 Low FEMA zone X (unshaded) · 0% chance over 30 yrs
- Wildfire 1/10 Low
- Heat 5/10 Major 7 d/yr ≥104°F today · 18 d/yr by 30 yrs out
- Wind 5/10 Major 26% chance of damaging wind over 30 yrs
- Air quality 5/10 Major 7 unhealthy d/yr today · 10 by 30 yrs out
Nearby sold comps map
Loading sold comps map…
Walkable amenities ~0.75 mi
Loading nearby amenities…
Taxation est. · year 1
- Rental income
- $21,718
- − Mortgage interest
- −$6,442
- − Property taxes
- −$3,447
- − Insurance
- −$575
- − Repairs & maintenance
- −$1,737
- − Management
- −$1,737
- − Depreciation
- −$3,345
- Taxable income
- $4,433
- Est. tax owed @ 24.0%
- −$1,064
- After-tax cash flow
- $4,834/yr
For passive investors: Depreciation is non-cash, so a rental often shows a tax loss while cash-flowing — sheltering income. Rental losses are passive: they offset passive income freely, and up to $25,000/yr can offset ordinary (W-2) income if you actively participate and your MAGI is under $100k (phasing out to $0 by $150k); unused losses carry forward. On sale, claimed depreciation is recaptured at up to 25%, and gains may owe capital-gains tax (a 1031 exchange can defer both). Figures are a year-1 estimate at your 24.0% rate — not tax advice; consult a CPA.
Schools (NCES district)
- District
- Dekalb County
- NCES district ID
- 1301740
- Math proficiency
- 19% ▼ -12.00%
- Reading proficiency
- 28% ▼ -7.00%
- Median HH income
- $51,448
- Composite
- 20.92/100
- National rank
- #8482
- State rank
- #125 of 174 in GA
Livability — Redan
- Score
- 64/100
- State rank
- #274
- US rank
- #14766
Category grades
Schools grade is shown separately in the Schools card above.
Census & demographics
- Census place
- Redan, GA
- County
- Dekalb County · 782,738 people
- City population
- 29,279
- Metro
- Atlanta-Sandy Springs-Alpharetta, GA
- Population (ZIP)
- 62,614
- Household income
- $61,684
- Rent vs Own
- Severe rent burden
- 3471.0
Population outlook (DeKalb County) Hauer SSP2
- Today (2025)
- 839,977 people
- By 2030
- 891,768 · +6.2%
- By 2040
- 988,894 · +17.7%
- By 2050
- 1,074,583 · +27.9%
- By 2075
- 1,245,026 · +48.2%
- By 2100
- 1,303,135 · +55.1%
Race, ethnicity, and origin ACS 2023
- Neighborhood character
- Predominantly Black (91%)
- Race & ethnicity
- Black 91% Hispanic / Latino 3% White 3% Two or more races 3%
- Common ancestry
- Hispanic 0%
- Foreign-born
- 12% · Canada, United Kingdom
- Languages at home
- 93% English-only · Spanish 2% French/Haitian/Cajun 1%
Political lean MEDSL · DeKalb
- 2024 margin
- Solid D (+64.8) · D 81.9% · R 17.1% · Other 1.0%
- 2008→2024 swing
- +6.1pp toward D · 2008: 58.6pp · 2024: 64.8pp
- All cycles
- 2024: D+64.8 2020: D+67.4 2016: D+64.8 2012: D+56.8 2008: D+58.6
Not yet ingested
- Civics
- —
Market trends
- HPI YoY
- ▼ -60.90%
- Current HPI
- 224.0366
- Rent YoY
- ▲ 1.18%
- Metro
- Atlanta-Sandy Springs-Alpharetta, GA
- State GDP YoY
- ▲ 2.66%
- F500 in state
- 28
Industry mix (Fortune 500 HQ in GA)
| Industry | F500 HQs | Revenue |
|---|---|---|
| Paper / Packaging | 2 | $29B |
|
||
| Retail | 1 | $160B |
|
||
| Transportation / Logistics | 1 | $91B |
|
||
| Airlines | 1 | $62B |
|
||
| Consumer Goods | 1 | $47B |
|
||
| Utilities | 1 | $25B |
|
||
Price history
+213.0% since first listed17 events — show timeline
- 2026-06-10 Listed $139,900 FMLS
- 2026-06-10 Listed $139,900 GAMLS
- 2018-08-28 Sold (Public Records) $35,135,800 Public Records
- 2014-12-18 Price Changed $55,000 FMLS
- 2014-12-11 Price Changed $55,000 GAMLS
- 2014-12-08 Sold (Public Records) $55,000 Public Records
- 2014-12-05 Listing Removed — FMLS
- 2014-11-25 Sold (MLS) $55,000 GAMLS
- 2014-11-25 Sold (MLS) $55,000 FMLS
- 2014-11-25 Price Changed $69,000 FMLS
- 2014-10-30 Pending — GAMLS
- 2014-10-30 Pending — FMLS
- 2014-10-15 Price Changed $69,000 GAMLS
- 2014-10-08 Listed $69,000 FMLS
- 2014-10-08 Listed $69,000 GAMLS
- 1986-07-03 Sold (Public Records) $60,900 Public Records
- 1980-05-29 Sold (Public Records) $44,700 Public Records
Property tax history
+3.3%/yrLatest (2025): $3,447 · +17.8% YoY. Source: county tax records.
Cash-flow waterfall
monthlySold comps — $/sqft
last 12 mo · ≤1 miLoading sold comps…