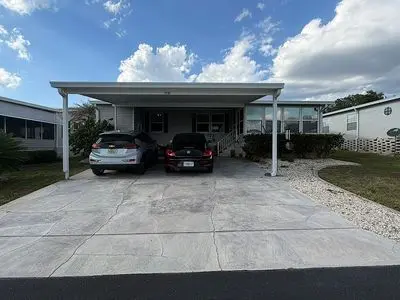
37701 El Sol Ave · Pasadena Hills, FL
Flood risk 1/10 · Minimal
- FEMA flood zone
- X (unshaded)
- Chance of flooding over 30 yrs
- 0.0%
- Est. flood insurance / yr
- $507 – $1,088
Fire risk 4/10 · Minor
- Est. fire insurance / yr
- $947 – $1,759
Heat risk 9/10 · Severe
- Hot days now (above 108°F)
- 7 days/yr
- Hot days in 30 yrs
- 24 days/yr
Wind risk 9/10 · Severe
- Chance of severe wind over 30 yrs
- 99.0%
Air-quality risk 2/10 · Minimal
- Unhealthy air days now
- 1 days/yr
- Unhealthy air days in 30 yrs
- 1 days/yr
Risk factors via First Street. Map © Google.
Why this score? — see what drove the B+ grade
The composite is a weighted blend of 9 inputs, each scored 0–100. Each bar is that input's sub-score; the figure is the points it added to the 100-point composite (weight × sub-score).
- Cash flow +30.0/30.0
- ARV discount +15.0/15.0
- 1% rule +10.0/10.0
- DSCR +10.0/10.0
- Schools +4.3/10.0
- Livability +3.2/5.0
- Condition / age +2.5/5.0
- Rent growth +1.9/5.0
- Appreciation +0.0/10.0
$85,000
🖨 Deal sheet 📄 Offer letter ✓ Due diligence
Listing remarks
Charming 3-Bedroom Home in a Quiet 55+ Community & acirc; & euro; & rdquo; Home Only, Lot Not Included This well-maintained 3-bedroom, 2-bath home with an enclosed lanai is nestled in the peaceful 55+ community of Spanish Trails West. Its central Zephyrhills location places you just one mile from a hospital, shopping, gyms, and everyday conveniences & acirc; & euro; & rdquo; an ideal blend of comfort and accessibility. Recent updates include laminate flooring in the main living area and primary bathroom, replacing the previous carpet. The guest bathroom features a shower/tub combo, and the home comes equipped with all appliances, each less than five years old. The
Key facts
- Laminate flooring
- Recent updates
- Central location
Tags
Property features AI
Exterior
- Home design: Built in 2002
- Construction: Living area approximately 1,107
- Exterior features: Located in the Spanish Trails West Residential Cooperative
Neighborhood map
What this means for you Summary
Snapshot
- This is a 3-bed/2.0-bath manufactured listed at $85k.
Deal economics
- At list price, monthly cash flow is $970 ($12k/yr) — positive.
- The deal already cash-flows at list — no discount required.
- Meets the 1% rule at list price ($2k rent vs $85k).
- Recommended offer: $82k (3.0% below list) — sets the bar for market timing.
- Cap rate 20.0% vs local median 3.7% in Pasadena Hills — top-decile yield for the area; either an underpriced asset or a hidden risk that comps aren't pricing in. Stress-test before assuming the spread holds.
Location & tenants
- Location reads 63/100 on livability (#723 in FL) — a middle-class / working-renter tenant base. Strengths: housing A+, crime A-, cost of living A-; Watch: schools F, amenities F, commute F.
- Pasco (suburban): math 50% / reading 52% proficiency, ranked #32 of 73 in FL (top 44%) — acceptable for families but not a draw, mixed tenant base, ~2y average lease.
- Market conditions: Rents soft (-2.5%/yr); 856 active listings in the ZIP; 18 comparable units currently listed for rent nearby; rentals at typical pace (median 24d on market — plan ~3-4 weeks tenant-placement turnaround); 6,765 units permitted in Pasco County in 2024 (1,250 in 5+ unit buildings).
- This rent runs 40% of the median local income ($57k/yr) — at the standard rent-burdened threshold; future hikes will face affordability resistance.
Forward outlook
- Local home prices are declining (-3.0%/yr); year-one equity from $588 of loan paydown is wiped out by about $3k of value loss. Plan a longer hold.
- Pasco County population projected at +29% by 2050 — long-run rental-demand tailwind backs the buy-and-hold thesis.
- At projected returns (-3.0% appreciation + 0.0% rent growth), your $24k cash investment doubles in ~3 years — after that, you're playing with house money.
Negotiation context
- It's been on market 33 days — a 3% lower offer ($82k) is reasonable based on typical stale-listing flexibility.
Risks & watch-outs
- Climate carrying-cost: severe wind risk, 99% chance of damaging wind over 30y; extreme-heat days projected 7→24/yr by 2055 (HVAC capex compounding) — expect insurance premiums to compound above CPI over the hold.
Questions for the listing agent
- It's been on market 33 days. Have you received any prior offers? Is the seller open to a 3% concession, seller financing, or rate buy-down credit?
- Is there a deadline driving the sale (1031 exchange, divorce, estate, relocation)? That informs how much negotiation room exists.
- Schools are F-rated, which usually means shorter tenancies and higher turnover. Who's the typical renter profile here, and what's been the actual vacancy rate?
- What's the average days-on-market for RENTAL listings here right now (not sales)? A rising rental-DOM trend means longer vacancies and softer asking-rent achievability than the comps imply.
- What's the recent tenant-quality profile in this submarket — average credit score on applications, eviction rate, late-payment / NSF rate, and stable-employment percentage? A property-management company in the area should have these aggregated.
- How much new for-sale + rental construction is in the pipeline within 1–3 miles? Heavy new supply typically softens prices + rents 12–24 months out; constrained supply supports both.
Investment metrics
- 1% rule
- 2.23% ✓
- Cap rate
- 19.98%
- Cash-on-cash
- 48.90%
- DSCR
- 3.18
- GRM
- 3.7
CMA / ARV
- ARV (on-the-fly)
- $130,626
- Comps found
- 12
Show comp detail 12 sales within ~0.75 mi
| Address | Dist | Beds/Ba | Sqft | Sold | Price | $/sf | Match |
|---|---|---|---|---|---|---|---|
| 37838 Barcelona Ave | 0.22mi | 2/2.0 (-1) | 1,128 (+2%) | 4mo | $136,000 | $121 | 79 |
| 37817 Granada Ave | 0.13mi | 2/2.0 (-1) | 1,056 (-5%) | 4mo | $125,000 | $118 | 78 |
| 6902 Orlo Dr | 0.40mi | 2/2.0 (-1) | 1,104 (-0%) | 2mo | $75,000 | $68 | 74 |
| 37838 Granada Ave | 0.17mi | 2/2.0 (-1) | 1,056 (-5%) | 9mo | $139,000 | $132 | 72 |
| 37642 Amigo Dr | 0.10mi | 3/2.0 | 1,204 (+9%) | 14mo | $156,000 | $130 | 69 |
| 7053 EL Conquistador St | 0.23mi | 2/2.0 (-1) | 1,056 (-5%) | 12mo | $122,000 | $116 | 67 |
| 37820 Madeira Ave | 0.16mi | 2/2.0 (-1) | 1,056 (-5%) | 16mo | $139,000 | $132 | 67 |
| 37848 Barcelona Ave | 0.23mi | 2/2.0 (-1) | 1,056 (-5%) | 13mo | $125,000 | $118 | 65 |
| 37611 Amigo Dr | 0.14mi | 2/2.0 (-1) | 1,196 (+8%) | 14mo | $140,000 | $117 | 64 |
| 37648 Campo Ave | 0.04mi | 2/2.0 (-1) | 972 (-12%) | 11mo | $114,000 | $117 | 63 |
| 37452 Attica Ave | 0.32mi | 2/1.5 (-1) | 1,028 (-7%) | 5mo | $94,000 | $91 | 62 |
| 7141 EL Matador St | 0.09mi | 2/2.0 (-1) | 1,218 (+10%) | 15mo | $137,500 | $113 | 62 |
Match score weights: distance 35% · size 25% · config 20% · recency 20%. Top-matched comps best support the ARV.
Projected returns pro-forma
-3.0% appreciation · 0.0% rent growth · sell at horizon
- IRR
- 43.1%
- Equity multiple
- 2.78×
- Total profit
- $42,421
- Equity at exit
- $12,674
- IRR
- 47.9%
- Equity multiple
- 4.99×
- Total profit
- $94,936
- Equity at exit
- $7,349
Cash invested: $23,800 (down + closing). Projections, not guarantees.
Landlord ↔ Tenant lean methodology
- Overall (STATE)
- 87 Strongly Landlord-Friendly
- State Florida
- 87 Strongly Landlord-Friendly · R+3
- County
- — inherits STATE
- City
- — inherits STATE
ZIP-level market 33541
- Home prices YoY
- -15.2%
- Rents YoY
- -2.5%
- Active inventory
- 856
- Price-to-rent
- 3.7×
Monthly cashflow live
- Estimated rent
- $1,900 high interval (Pro) →
- Mortgage (P&I)
- −$446
- Tax from tax record
- −$50 /mo · $596/yr
- Insurance
- −$35
- HOA
- −$0
- Vacancy / Maint / Mgmt
- −$399
- Net cashflow
- $970
Break-even live
UW: 25.0% down · 7.5% · 30yr · 1.5% tax · 5.0% vac · 8.0% maint · 8.0% mgmt
Financing live
Cash to close
- Down payment
- $21,250
- Closing costs
- $2,550
- Reserves months
- —
- Total cash needed
- —
Loan-product check · same deal, 3 products live
Conventional
25% down · 7.5% · 30yr
- Down + closing
- —
- Monthly P&I
- —
- Monthly cashflow
- —
- DSCR
- —
- Eligible?
- —
Personal DTI + credit; lowest rate.
DSCR
20% down · 8.5% · 30yr
- Down + closing
- —
- Monthly P&I
- —
- Monthly cashflow
- —
- DSCR
- —
- Eligible?
- —
No personal income docs; deal must DSCR.
Hard money
10% down · 12.0% · 12mo
- Down + closing
- —
- Monthly P&I
- —
- Monthly cashflow
- —
- DSCR
- —
- Eligible?
- —
Short-term bridge; refi at stabilization.
Rent comps 18 comps
| Address | Beds | Baths | Sqft | Rent | $/sqft | DOM | Units | Dist |
|---|---|---|---|---|---|---|---|---|
| 37814 Daughtery Rd Zephyrhills, FL | 2.0 | 1.0 | 1070 | $1,395 | $1.30 | 5d | 1 | 0.24mi |
| 7660 Emerson Hill Cir Zephyrhills, FL | 1.0–3.0 | 1.0–2.0 | 1077 | $2,315 | $2.15 | 1d | 34 | 0.63mi |
| 6633 Foxmoor Dr Zephyrhills, FL | 3.0 | 2.0 | 1300 | $2,000 | $1.54 | 24d | 1 | 0.76mi |
| 6335 Maisie Rd Zephyrhills, FL | 3.0 | 2.5 | 1363 | $1,650 | $1.21 | 20d | 1 | 0.85mi |
| 38350 Ironwood Pl #5 Zephyrhills, FL | 2.0 | 2.0 | 1094 | $1,800 | $1.65 | 24d | 1 | 0.87mi |
| 6788 Basswood Cir Zephyrhills, FL | 2.0 | 2.0 | 1067 | $1,250 | $1.17 | 24d | 1 | 0.89mi |
| 6262 Maisie Rd Zephyrhills, FL | 3.0 | 2.5 | 1363 | $1,700 | $1.25 | 24d | 1 | 0.90mi |
| 37732 Cecil Ln Zephyrhills, FL | 3.0 | 1.0 | 1040 | $1,800 | $1.73 | 24d | 1 | 0.90mi |
| 6246 Timberly Ln Zephyrhills, FL | 3.0 | 2.5 | 1363 | $1,900 | $1.39 | 24d | 1 | 0.90mi |
| 37661 Aaralyn Rd Zephyrhills, FL | 3.0 | 2.5 | 1363 | $1,800 | $1.32 | 24d | 1 | 0.91mi |
| 6773 Branham Mill Ct Zephyrhills, FL | 3.0 | 2.0 | 1454 | $1,950 | $1.34 | 24d | 1 | 0.96mi |
| 6302 Abbott Station Dr Zephyrhills, FL | 3.0 | 1.0–2.5 | 855 | $1,999 | $2.34 | 1d | 142 | 0.99mi |
| 38485 County Road 54 Zephyrhills, FL | 2.0 | 1.0 | 800 | $1,100 | $1.38 | 24d | 1 | 1.02mi |
| 6195 Daerr Ridge St Zephyrhills, FL | 3.0 | 2.5 | 1386 | $2,000 | $1.44 | 17d | 1 | 1.07mi |
| 38300 Henry Dr Zephyrhills, FL | 2.0 | 1.0 | 1152 | $1,650 | $1.43 | 5d | 1 | 1.13mi |
| 6136 Pina Colada St Zephyrhills, FL | 3.0 | 2.5 | 1386 | $2,100 | $1.52 | 12d | 1 | 1.16mi |
| 38748 Calumet Ave Zephyrhills, FL | 2.0 | 1.0 | 750 | $1,100 | $1.47 | 5d | 1 | 1.37mi |
| 37812 15th Ave Zephyrhills, FL | 2.0 | 2.0 | 1000 | $1,850 | $1.85 | 24d | 1 | 1.43mi |
Listing history 15 events
-
2026-06-18days on market $85,000 Active 33 DOM
-
2026-06-17days on market $85,000 Active 32 DOM
-
2026-06-16days on market $85,000 Active 31 DOM
-
2026-06-16price $85,000 Active 30 DOM
-
2026-06-15days on market $100,000 Active 30 DOM
-
2026-06-13days on market $100,000 Active 28 DOM
-
2026-06-09days on market $100,000 Active 24 DOM
-
2026-06-08days on market $100,000 Active 23 DOM
-
2026-06-07days on market $100,000 Active 22 DOM
-
2026-06-04days on market $100,000 Active 19 DOM
-
2026-06-03days on market $100,000 Active 18 DOM
-
2026-06-02days on market $100,000 Active 17 DOM
-
2026-06-01days on market $100,000 Active 16 DOM
-
2026-05-31days on market $100,000 Active 15 DOM
-
2026-05-17$100,000 Active
ⓘ Source: listings_history table (triggers on properties + properties_extension) + one-shot
backfill from property_details.listing_events for pre-trigger history.
Tax reassessment forecast FL · Resets to sale price
- Current annual tax
- $596 · $50/mo
- Projected year-2 tax
- $706 · $59/mo
- Expected delta
- +$110/yr (+$9/mo · 18.4%)
ⓘ Screening estimate from a state-policy table — verify with the county assessor before closing.
Climate risk First Street
- Flood 1/10 Low FEMA zone X (unshaded) · 0% chance over 30 yrs
- Wildfire 4/10 Moderate
- Heat 9/10 Extreme 7 d/yr ≥108°F today · 24 d/yr by 30 yrs out
- Wind 9/10 Extreme 99% chance of damaging wind over 30 yrs
- Air quality 2/10 Low 1 unhealthy d/yr today · 1 by 30 yrs out
Nearby sold comps map
Loading sold comps map…
Walkable amenities ~0.75 mi
Loading nearby amenities…
Taxation est. · year 1
- Rental income
- $22,794
- − Mortgage interest
- −$4,761
- − Property taxes
- −$596
- − Insurance
- −$425
- − Repairs & maintenance
- −$1,824
- − Management
- −$1,824
- − Depreciation
- −$2,473
- Taxable income
- $10,892
- Est. tax owed @ 24.0%
- −$2,614
- After-tax cash flow
- $9,023/yr
For passive investors: Depreciation is non-cash, so a rental often shows a tax loss while cash-flowing — sheltering income. Rental losses are passive: they offset passive income freely, and up to $25,000/yr can offset ordinary (W-2) income if you actively participate and your MAGI is under $100k (phasing out to $0 by $150k); unused losses carry forward. On sale, claimed depreciation is recaptured at up to 25%, and gains may owe capital-gains tax (a 1031 exchange can defer both). Figures are a year-1 estimate at your 24.0% rate — not tax advice; consult a CPA.
Schools (NCES district)
- District
- Pasco
- NCES district ID
- 1201530
- Math proficiency
- 50% ▼ -10.00%
- Reading proficiency
- 52% ▼ -5.00%
- Median HH income
- $45,039
- Composite
- 43.14/100
- National rank
- #3074
- State rank
- #32 of 73 in FL
Livability — Pasadena Hills
- Score
- 63/100
- State rank
- #723
- US rank
- #15499
Category grades
Schools grade is shown separately in the Schools card above.
Census & demographics
- Census place
- Pasadena Hills, FL
- County
- Pasco County · 524,098 people
- Metro
- Tampa-St. Petersburg-Clearwater, FL
- Population (ZIP)
- 24,654
- Household income
- $56,579
- Rent vs Own
- Severe rent burden
- 393.0
Population outlook (Pasco County) Hauer SSP2
- Today (2025)
- 570,045 people
- By 2030
- 605,844 · +6.3%
- By 2040
- 674,806 · +18.4%
- By 2050
- 736,022 · +29.1%
- By 2075
- 862,900 · +51.4%
- By 2100
- 906,364 · +59.0%
Race, ethnicity, and origin ACS 2023
- Neighborhood character
- Predominantly White (72%)
- Race & ethnicity
- White 72% Hispanic / Latino 15% Two or more races 8% Black 5% Asian 5%
- Hispanic origin (detail)
- Mexican 4% Puerto Rican 9%
- Common ancestry
- Lithuanian 4% Romanian 3% Serbian 3%
- Foreign-born
- 9% · Canada, Vietnam
- Languages at home
- 85% English-only · Spanish 9% Tagalog/Filipino 1% Other Asian/Pacific 1%
Political lean MEDSL · Pasco
- 2024 margin
- Strong R (+25.2) · D 36.9% · R 62.1% · Other 1.0%
- 2008→2024 swing
- -21.6pp toward R · 2008: -3.6pp · 2024: -25.2pp
- All cycles
- 2024: R+25.2 2020: R+20.1 2016: R+21.6 2012: R+6.7 2008: R+3.6
Not yet ingested
- Civics
- —
Market trends
- HPI YoY
- ▼ -55.21%
- Current HPI
- 308.0619
- Rent YoY
- ▼ -2.51%
- Metro
- Tampa-St. Petersburg-Clearwater, FL
- State GDP YoY
- ▲ 3.28%
- F500 in state
- 36
Industry mix (Fortune 500 HQ in FL)
| Industry | F500 HQs | Revenue |
|---|---|---|
| Industrial Technology | 2 | $29B |
|
||
| Insurance | 2 | $17B |
|
||
| Retail | 1 | $60B |
|
||
| Technology Distribution | 1 | $58B |
|
||
| Homebuilding | 1 | $35B |
|
||
| Technology Manufacturing | 1 | $35B |
|
||
Price history
1 event — show timeline
- 2026-05-17 Listed $100,000 FSBO.com
Property tax history
+1.6%/yrLatest (2025): $596 · +0.7% YoY. Source: county tax records.
Cash-flow waterfall
monthlySold comps — $/sqft
last 12 mo · ≤1 miLoading sold comps…