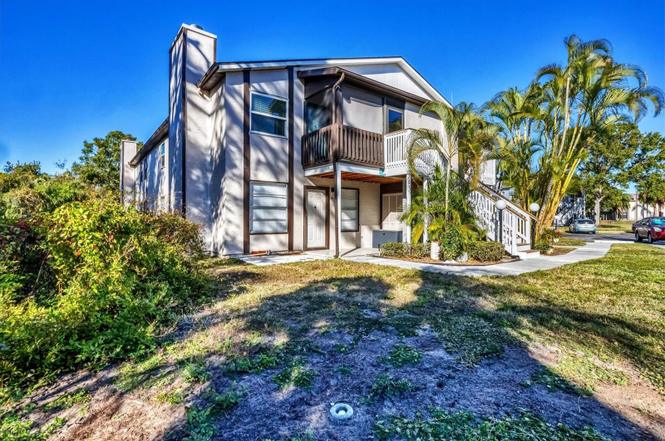
3636 59th Ave W · Bayshore Gardens, FL
Flood risk 1/10 · Minimal
- FEMA flood zone
- X (unshaded)
- Chance of flooding over 30 yrs
- 0.0%
- Est. flood insurance / yr
- $507 – $1,088
Fire risk 2/10 · Minimal
- Est. fire insurance / yr
- $947 – $1,759
Heat risk 10/10 · Severe
- Hot days now (above 106°F)
- 7 days/yr
- Hot days in 30 yrs
- 29 days/yr
Wind risk 10/10 · Severe
- Chance of severe wind over 30 yrs
- 99.0%
Air-quality risk 2/10 · Minimal
- Unhealthy air days now
- 1 days/yr
- Unhealthy air days in 30 yrs
- 2 days/yr
Risk factors via First Street. Map © Google.
Why this score? — see what drove the C- grade
The composite is a weighted blend of 9 inputs, each scored 0–100. Each bar is that input's sub-score; the figure is the points it added to the 100-point composite (weight × sub-score).
- Cash flow +19.3/30.0
- 1% rule +10.0/10.0
- ARV discount +7.5/15.0
- DSCR +6.1/10.0
- Schools +4.4/10.0
- Livability +4.1/5.0
- Condition / age +2.5/5.0
- Rent growth +1.0/5.0
- Appreciation +0.0/10.0
$111,500
🖨 Deal sheet 📄 Offer letter ✓ Due diligence
Listing remarks
Welcome to your aggressively priced, convenient condo retreat in the heart of West Bradenton, Mirror Lakes community. This bright and open second-floor 2-bedroom, 2-bathroom 912 square foot unit offers comfort and peace of mind. Cozy evenings by the charming fireplace, perfect for relaxing after a long day. Feel secure with hurricane rated windows installed in 2020 and a new A/C in 2022. The galley kitchen has new cabinets and granite counter tops, bar top seating at the pass through for additional dining space. For your convenience, a dedicated outside laundry closet with a washer and dryer. Mirror Lakes is a deed-restricted community with beautiful grounds and fantastic amenities, includi
Key facts
- Fitness center
- Galley kitchen
- Tennis courts
Tags
Neighborhood map
What this means for you Summary
Snapshot
- This is a 2-bed/2.0-bath condo listed at $112k.
Deal economics
- At list price, monthly cash flow is $123 ($1k/yr) — positive.
- The deal already cash-flows at list — no discount required.
- Meets the 1% rule at list price ($2k rent vs $112k).
- Recommended offer: $101k (9.0% below list) — sets the bar for market timing.
- Cap rate 7.6% vs local median 4.7% in Bayshore Gardens — top-decile yield for the area; either an underpriced asset or a hidden risk that comps aren't pricing in. Stress-test before assuming the spread holds.
Location & tenants
- Location reads 82/100 on livability (#72 in FL, #1,180 nationally) — a professional / high-income tenant draw. Strengths: cost of living A+, housing A+, health & safety A+; Watch: crime C-, commute C-, schools F.
- Manatee (suburban): math 54% / reading 50% proficiency, ranked #26 of 73 in FL (top 36%) — acceptable for families but not a draw, mixed tenant base, ~2y average lease.
- Market conditions: Rents falling (-6.1%/yr); 549 active listings in the ZIP; 40 comparable units currently listed for rent nearby; rentals at typical pace (median 16d on market — plan ~3-4 weeks tenant-placement turnaround); 7,472 units permitted in Manatee County in 2024 (1,782 in 5+ unit buildings).
- This rent runs 32% of the median local income ($64k/yr) — at the standard rent-burdened threshold; future hikes will face affordability resistance.
Forward outlook
- Local home prices are declining (-3.0%/yr); year-one equity from $771 of loan paydown is wiped out by about $3k of value loss. Plan a longer hold.
- Manatee County population projected at +43% by 2050 — long-run rental-demand tailwind backs the buy-and-hold thesis.
Negotiation context
- It's been on market 100 days — a 9% lower offer ($101k) is reasonable based on typical stale-listing flexibility.
- 2 sale attempts; this cycle's ask has dropped $8k (7%) from the opening price — seller is motivated, your offer sets the floor, not the list.
Risks & watch-outs
- Watch-outs: HOA is 28% of rent.
- Climate carrying-cost: severe wind risk, 99% chance of damaging wind over 30y; extreme-heat days projected 7→29/yr by 2055 (HVAC capex compounding) — expect insurance premiums to compound above CPI over the hold.
Questions for the listing agent
- It's been on market 100 days. Have you received any prior offers? Is the seller open to a 9% concession, seller financing, or rate buy-down credit?
- What does the HOA fee cover, when was the last increase, and are there any pending special assessments or reserve-fund shortfalls?
- Any open or pending special assessments — roof, HVAC, plumbing, elevator, façade? What's the per-unit balance and payoff schedule, and is the seller paying it off at close or rolling it to the buyer?
- Why hasn't it sold? Are there any deal-killer items the seller is aware of (foundation, flood, title, zoning, code violations)?
- Is there a deadline driving the sale (1031 exchange, divorce, estate, relocation)? That informs how much negotiation room exists.
- Schools are F-rated, which usually means shorter tenancies and higher turnover. Who's the typical renter profile here, and what's been the actual vacancy rate?
- What's the average days-on-market for RENTAL listings here right now (not sales)? A rising rental-DOM trend means longer vacancies and softer asking-rent achievability than the comps imply.
- What's the recent tenant-quality profile in this submarket — average credit score on applications, eviction rate, late-payment / NSF rate, and stable-employment percentage? A property-management company in the area should have these aggregated.
- How much new apartment / multifamily construction is in the pipeline within 1–3 miles? Heavy new supply (>2% of stock underway) typically softens rents 12–24 months out; light construction supports rent growth.
Investment metrics
- 1% rule
- 1.51% ✓
- Cap rate
- 7.62%
- Cash-on-cash
- 4.74%
- DSCR
- 1.21
- GRM
- 5.5
CMA / ARV
No comps found within radius.
Projected returns pro-forma
-3.0% appreciation · 0.0% rent growth · sell at horizon
- IRR
- -13.9%
- Equity multiple
- 0.52×
- Total profit
- $-14,871
- Equity at exit
- $16,625
- IRR
- -14.6%
- Equity multiple
- 0.34×
- Total profit
- $-20,758
- Equity at exit
- $9,640
Cash invested: $31,220 (down + closing). Projections, not guarantees.
Landlord ↔ Tenant lean methodology
- Overall (STATE)
- 87 Strongly Landlord-Friendly
- State Florida
- 87 Strongly Landlord-Friendly · R+3
- County
- — inherits STATE
- City
- — inherits STATE
ZIP-level market 34210
- Rents YoY
- -6.1%
- Active inventory
- 549
- Price-to-rent
- 5.5×
Monthly cashflow live
- Estimated rent
- $1,688 high interval (Pro) →
- Mortgage (P&I)
- −$585
- Tax from tax record
- −$99 /mo · $1,187/yr
- Insurance
- −$46
- HOA
- −$480
- Vacancy / Maint / Mgmt
- −$354
- Net cashflow
- $123
Break-even live
UW: 25.0% down · 7.5% · 30yr · 1.5% tax · 5.0% vac · 8.0% maint · 8.0% mgmt
Financing live
Cash to close
- Down payment
- $27,875
- Closing costs
- $3,345
- Reserves months
- —
- Total cash needed
- —
Loan-product check · same deal, 3 products live
Conventional
25% down · 7.5% · 30yr
- Down + closing
- —
- Monthly P&I
- —
- Monthly cashflow
- —
- DSCR
- —
- Eligible?
- —
Personal DTI + credit; lowest rate.
DSCR
20% down · 8.5% · 30yr
- Down + closing
- —
- Monthly P&I
- —
- Monthly cashflow
- —
- DSCR
- —
- Eligible?
- —
No personal income docs; deal must DSCR.
Hard money
10% down · 12.0% · 12mo
- Down + closing
- —
- Monthly P&I
- —
- Monthly cashflow
- —
- DSCR
- —
- Eligible?
- —
Short-term bridge; refi at stabilization.
Rent comps 40 comps
| Address | Beds | Baths | Sqft | Rent | $/sqft | DOM | Units | Dist |
|---|---|---|---|---|---|---|---|---|
| 3646 59th Ave W Unit 3646 Bradenton, FL | 2.0 | 2.0 | 912 | $1,400 | $1.54 | 3d | 1 | 0.04mi |
| 3739 59th Ave W Unit 3739 Bradenton, FL | 2.0 | 2.0 | 912 | $1,575 | $1.73 | 16d | 1 | 0.06mi |
| 3527 59th Ave W Unit 3527 Bradenton, FL | 2.0 | 2.0 | 912 | $1,400 | $1.54 | 23d | 1 | 0.06mi |
| 3545 59th Ave W #3545 Bradenton, FL | 3.0 | 2.0 | 1037 | $1,600 | $1.54 | 16d | 1 | 0.07mi |
| 3533 59th Ave W Unit 3533 Bradenton, FL | 2.0 | 2.0 | 912 | $1,500 | $1.64 | 16d | 1 | 0.08mi |
| 3774 59th Ave W Unit 3774 Bradenton, FL | 2.0 | 2.0 | 912 | $1,350 | $1.48 | 23d | 1 | 0.10mi |
| 3773 59th Ave W Bradenton, FL | 2.0 | 2.0 | 912 | $1,595 | $1.75 | 23d | 1 | 0.11mi |
| 3775 59th Ave W Unit 3775 Bradenton, FL | 2.0 | 2.0 | 912 | $3,500 | $3.84 | 23d | 1 | 0.11mi |
| 3843 59th Ave W Bradenton, FL | 2.0 | 2.0 | 912 | $1,200 | $1.32 | 23d | 1 | 0.18mi |
| 3848 59th Ave W Bradenton, FL | 2.0 | 2.0 | 912 | $1,395 | $1.53 | 23d | 1 | 0.19mi |
| 3851 59th Ave W Unit 3851 Bradenton, FL | 2.0 | 2.0 | 912 | $1,500 | $1.64 | 23d | 1 | 0.19mi |
| 6050 34th St W Bradenton, FL | 1.0–2.0 | 1.0 | 734 | $1,610 | $2.19 | 1d | 19 | 0.30mi |
| 6033 34th St W Bradenton, FL | 2.0 | 2.0 | 942 | $1,550 | $1.64 | 3d | 3 | 0.43mi |
| 6033 34th St W Bradenton, FL | 2.0 | 2.0 | 942 | $1,625 | $1.73 | 2d | 2 | 0.43mi |
| 6033 34th St W Bradenton, FL | 2.0 | 2.0 | 996 | $1,500 | $1.51 | 23d | 2 | 0.43mi |
| 3604 54th Dr W Bradenton, FL | 2.0 | 2.0 | 1114 | $4,050 | $3.64 | 3d | 3 | 0.43mi |
| 3506 54th Dr W Bradenton, FL | 1.0–2.0 | 1.0–2.0 | 953 | $2,800 | $2.94 | 3d | 2 | 0.44mi |
| 3605 54th Dr W Bradenton, FL | 2.0 | 2.0 | 1166 | $3,738 | $3.21 | 3d | 2 | 0.45mi |
| 3401 54th Dr W Bradenton, FL | 2.0–3.0 | 2.0–3.0 | 1293 | $3,300 | $2.55 | 3d | 3 | 0.48mi |
| 6147 43rd St W Bradenton, FL | 2.0 | 2.0 | 1116 | $3,200 | $2.87 | 23d | 1 | 0.56mi |
| 4148 53rd Ave W Unit 1210 Bradenton, FL | 2.0 | 2.0 | 1071 | $1,932 | $1.80 | 3d | 1 | 0.61mi |
| 4148 53rd Ave W Bradenton, FL | 1.0–2.0 | 1.0–2.0 | 899 | $2,412 | $2.68 | 21d | 10 | 0.61mi |
| 4148 53rd Ave W Bradenton, FL | 1.0–3.0 | 1.0–2.0 | 989 | $2,550 | $2.58 | 1d | 1 | 0.61mi |
| 4148 53rd Ave W Unit 0314 Bradenton, FL | 2.0 | 2.0 | 1071 | $1,967 | $1.84 | 23d | 1 | 0.61mi |
| 2713 60th Avenue Dr W Bradenton, FL | 2.0 | 2.0 | 1076 | $2,000 | $1.86 | 23d | 1 | 0.69mi |
| 4510 El Conquistador Pkwy #207 Bradenton, FL | 2.0 | 2.0 | 1074 | $3,400 | $3.17 | 23d | 1 | 0.73mi |
| 5400 26th St W Bradenton, FL | 1.0–2.0 | 1.0–2.0 | 902 | $1,651 | $1.83 | 23d | 1 | 0.83mi |
| 3304 McDill Rd Bradenton, FL | 2.0 | 1.0 | 1044 | $1,695 | $1.62 | 11d | 1 | 0.87mi |
| 2423 60th Ave W Unit K29 Bradenton, FL | 2.0 | 2.0 | 1026 | $1,495 | $1.46 | 23d | 1 | 0.92mi |
| 2547 60th Ave W Unit L-36 Bradenton, FL | 1.0 | 1.0 | 576 | $1,100 | $1.91 | 16d | 1 | 0.92mi |
| 5996 Hibiscus Dr #6 Bradenton, FL | 2.0 | 1.0 | 865 | $1,550 | $1.79 | 16d | 1 | 0.92mi |
| 3278 51st Avenue Dr W Unit 1 Bradenton, FL | 2.0 | 1.0 | 850 | $1,600 | $1.88 | 23d | 1 | 0.93mi |
| 3277 51st Avenue Dr W Bradenton, FL | 3.0 | 2.0 | 995 | $1,760 | $1.77 | 3d | 1 | 0.96mi |
| 5310 26th St W Bradenton, FL | 1.0–2.0 | 1.0 | 789 | $1,450 | $1.84 | 3d | 4 | 0.97mi |
| 5310 26th St W Bradenton, FL | 1.0–2.0 | 1.0 | 789 | $1,550 | $1.96 | 19d | 5 | 0.97mi |
| 5310 26th St W Bradenton, FL | 1.0–2.0 | 1.0 | 789 | $1,450 | $1.84 | 11d | 5 | 0.97mi |
| 586 Lakeside Dr Unit 586 Bradenton, FL | 2.0 | 2.0 | 940 | $3,200 | $3.40 | 23d | 1 | 0.98mi |
| 5906 Garden Ln Unit A22 Bradenton, FL | 2.0 | 2.0 | 840 | $1,200 | $1.43 | 3d | 1 | 0.98mi |
| 6043 Coral Way Bradenton, FL | 2.0 | 1.0 | 865 | $1,700 | $1.97 | 16d | 1 | 0.99mi |
| 184 Pineneedle Dr Bradenton, FL | 2.0 | 2.0 | 940 | $2,100 | $2.23 | 23d | 1 | 0.99mi |
HOA detail condo
- Monthly dues
- $480 · $5,760/yr
- Likely covers
- landscaping
- Assessments
- None detected in remarks — confirm with the listing agent.
Listing history 9 events
-
2026-03-23status Pending
-
2026-03-09price $111,500
-
2025-12-30status Active
-
2025-12-22status Pending
-
2025-12-05$119,995 Active
-
2004-06-22soldstatus $117,000
-
2001-06-26soldstatus $71,000
-
1992-12-01soldstatus $43,000
-
1992-10-23soldstatus $43,000
ⓘ Source: listings_history table (triggers on properties + properties_extension) + one-shot
backfill from property_details.listing_events for pre-trigger history.
Tax reassessment forecast FL · Resets to sale price
- Current annual tax
- $1,187 · $99/mo
- Projected year-2 tax
- $1,187 · $99/mo
- Expected delta
- $0/yr ($0/mo · 0.0%)
ⓘ Screening estimate from a state-policy table — verify with the county assessor before closing.
Climate risk First Street
- Flood 1/10 Low FEMA zone X (unshaded) · 0% chance over 30 yrs
- Wildfire 2/10 Low
- Heat 10/10 Extreme 7 d/yr ≥106°F today · 29 d/yr by 30 yrs out
- Wind 10/10 Extreme 99% chance of damaging wind over 30 yrs
- Air quality 2/10 Low 1 unhealthy d/yr today · 2 by 30 yrs out
Nearby sold comps map
Loading sold comps map…
Walkable amenities ~0.75 mi
Loading nearby amenities…
Taxation est. · year 1
- Rental income
- $20,253
- − Mortgage interest
- −$6,246
- − Property taxes
- −$1,187
- − Insurance
- −$558
- − Repairs & maintenance
- −$1,620
- − Management
- −$1,620
- − HOA
- −$5,760
- − Depreciation
- −$3,244
- Taxable income
- $18
- Est. tax owed @ 24.0%
- −$4
- After-tax cash flow
- $1,474/yr
For passive investors: Depreciation is non-cash, so a rental often shows a tax loss while cash-flowing — sheltering income. Rental losses are passive: they offset passive income freely, and up to $25,000/yr can offset ordinary (W-2) income if you actively participate and your MAGI is under $100k (phasing out to $0 by $150k); unused losses carry forward. On sale, claimed depreciation is recaptured at up to 25%, and gains may owe capital-gains tax (a 1031 exchange can defer both). Figures are a year-1 estimate at your 24.0% rate — not tax advice; consult a CPA.
Schools (NCES district)
- District
- Manatee
- NCES district ID
- 1201230
- Math proficiency
- 54% ▼ -6.00%
- Reading proficiency
- 50% ▼ -2.00%
- Median HH income
- $49,607
- Composite
- 44.43/100
- National rank
- #2806
- State rank
- #26 of 73 in FL
Livability — Bayshore Gardens
- Score
- 82/100
- State rank
- #72
- US rank
- #1180
Category grades
Schools grade is shown separately in the Schools card above.
Census & demographics
- County
- Manatee County · 416,364 people
- City population
- 33,840
- Metro
- North Port-Sarasota-Bradenton, FL
- Population (ZIP)
- 17,682
- Household income
- $64,244
- Rent vs Own
- Severe rent burden
- 895.0
Population outlook (Manatee County) Hauer SSP2
- Today (2025)
- 447,342 people
- By 2030
- 488,911 · +9.3%
- By 2040
- 567,934 · +27.0%
- By 2050
- 637,995 · +42.6%
- By 2075
- 781,970 · +74.8%
- By 2100
- 848,272 · +89.6%
Race, ethnicity, and origin ACS 2023
- Neighborhood character
- Predominantly White (68%)
- Race & ethnicity
- White 68% Hispanic / Latino 20% Black 8% Two or more races 7% Asian 2%
- Hispanic origin (detail)
- Mexican 4% Puerto Rican 3% Cuban 7%
- Common ancestry
- Hispanic 4% Romanian 3% Lithuanian 3%
- Foreign-born
- 17% · Canada, China, Jamaica
- Languages at home
- 76% English-only · Spanish 15% French/Haitian/Cajun 4% Other Indo-European 1%
Political lean MEDSL · Manatee
- 2024 margin
- Strong R (+23.5) · D 37.9% · R 61.4%
- 2008→2024 swing
- -16.5pp toward R · 2008: -7.0pp · 2024: -23.5pp
- All cycles
- 2024: R+23.5 2020: R+16.1 2016: R+17.1 2012: R+12.5 2008: R+7.0
Not yet ingested
- Civics
- —
Market trends
- HPI YoY
- ▼ -162.68%
- Current HPI
- 246.9247
- Rent YoY
- ▼ -6.08%
- Metro
- North Port-Sarasota-Bradenton, FL
- State GDP YoY
- ▲ 3.28%
- F500 in state
- 36
Industry mix (Fortune 500 HQ in FL)
| Industry | F500 HQs | Revenue |
|---|---|---|
| Industrial Technology | 2 | $29B |
|
||
| Insurance | 2 | $17B |
|
||
| Retail | 1 | $60B |
|
||
| Technology Distribution | 1 | $58B |
|
||
| Homebuilding | 1 | $35B |
|
||
| Technology Manufacturing | 1 | $35B |
|
||
Price history
+159.3% since first listed9 events — show timeline
- 2026-03-23 Pending — Stellar MLS as Distributed by MLS Grid
- 2026-03-09 Price Changed $111,500 Stellar MLS as Distributed by MLS Grid
- 2025-12-30 Relisted — Stellar MLS as Distributed by MLS Grid
- 2025-12-22 Pending — Stellar MLS as Distributed by MLS Grid
- 2025-12-05 Listed $119,995 Stellar MLS as Distributed by MLS Grid
- 2004-06-22 Sold (Public Records) $117,000 Public Records
- 2001-06-26 Sold (Public Records) $71,000 Public Records
- 1992-12-01 Sold (Public Records) $43,000 Public Records
- 1992-10-23 Sold (Public Records) $43,000 Public Records
Property tax history
+8.9%/yrLatest (2025): $1,187 · +4.7% YoY. Source: county tax records.
Cash-flow waterfall
monthlySold comps — $/sqft
last 12 mo · ≤1 miLoading sold comps…