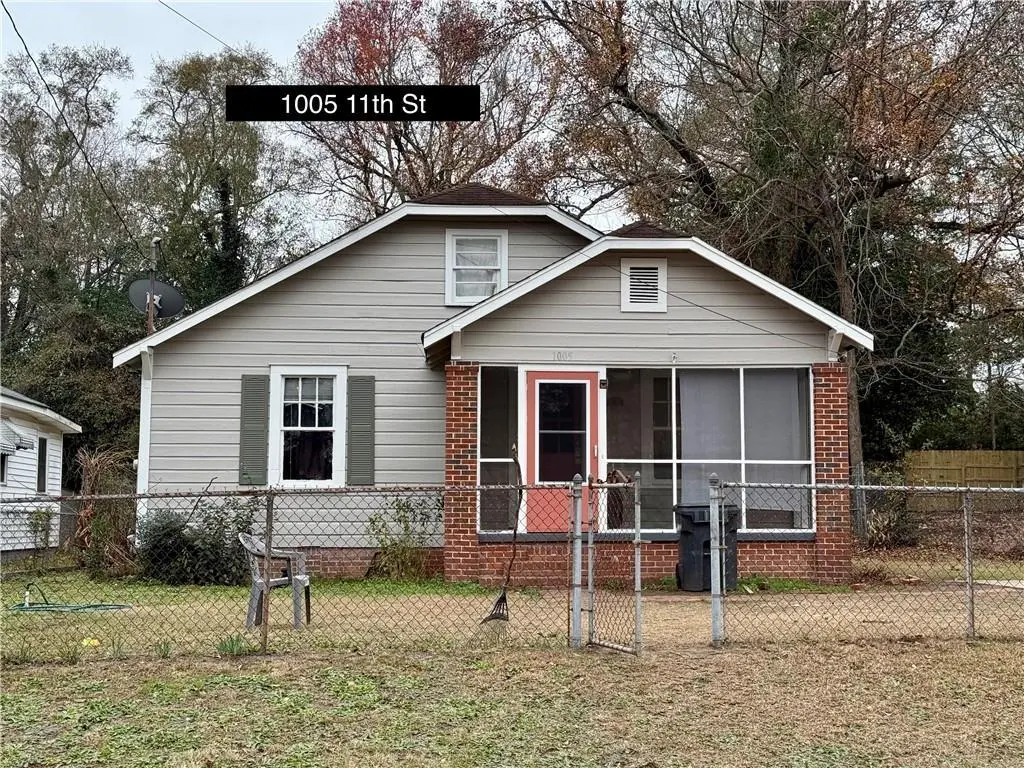
1005 11th St · Phenix City, AL
Flood risk 1/10 · Minimal
- FEMA flood zone
- X (unshaded)
- Chance of flooding over 30 yrs
- 0.0%
- Est. flood insurance / yr
- $507 – $1,088
Fire risk 1/10 · Minimal
- Est. fire insurance / yr
- $916 – $1,700
Heat risk 7/10 · Major
- Hot days now (above 107°F)
- 7 days/yr
- Hot days in 30 yrs
- 17 days/yr
Wind risk 6/10 · Moderate
- Chance of severe wind over 30 yrs
- 76.0%
Air-quality risk 5/10 · Moderate
- Unhealthy air days now
- 7 days/yr
- Unhealthy air days in 30 yrs
- 8 days/yr
Risk factors via First Street. Map © Google.
Why this score? — see what drove the B grade
The composite is a weighted blend of 9 inputs, each scored 0–100. Each bar is that input's sub-score; the figure is the points it added to the 100-point composite (weight × sub-score).
- Cash flow +30.0/30.0
- 1% rule +10.0/10.0
- DSCR +10.0/10.0
- ARV discount +9.6/15.0
- Livability +3.0/5.0
- Schools +2.7/10.0
- Rent growth +2.5/5.0
- Condition / age +2.5/5.0
- Appreciation +0.0/10.0
$79,500
🖨 Deal sheet 📄 Offer letter ✓ Due diligence
Listing remarks
Welcome to 1005 11th Street! This property could make for a great addition to your rental portfolio. Could be purchased as a package deal. The address are all in Phenix City and include 1705 Auburn Rd, 1604 Auburn Rd, 1015 11th Ave, 1005 11th St, & 1822 Sixth Ct. Most all have tenants in place and have been producing nearly $65,000 in rental income yearly! On top of that, 1705 Auburn Rd is already zoned commercial and is currently vacant but with a ton of interest. 1604 Auburn Rd is across the street and could pretty easily be converted to commercial as well; while being within eyesight of HWY 80. All of the HVACs are under 5 years old and most Water Heaters have been replaced. Reach o
Key facts
- 0.5 acre lot
- Built 1940
- Listed 79 days
Property features AI
Finance
- Other: Lot approximately 0.5 acres (186 x 70)
- HOA & community: No community features listed
Exterior
- Parking: No on-site parking
- Utilities: Public water; Sewer: other; Utilities: other; Paved road access
- Home design: Single-family residence; One level; No shared/common walls; Has a view
- Construction: Constructed with other materials
- Exterior features: Other exterior features; No patio or porch; No fencing; Shingle/other roof
Interior
- Bedrooms: One main-level bedroom
- Flooring: Other flooring
- Bathrooms: One full bathroom on the main level
- Heating & cooling: Has heating (type: other); Has cooling (type: other)
- Interior features: Other interior features; No fireplace
- Laundry & utility: No laundry hookups inside; No basement
Neighborhood map
What this means for you Summary
Snapshot
- This is a 1-bed/1.0-bath single-family listed at $80k.
Deal economics
- At list price, monthly cash flow is $678 ($8k/yr) — positive.
- The deal already cash-flows at list — no discount required.
- Meets the 1% rule at list price ($1k rent vs $80k).
- Recommended offer: $75k (6.0% below list) — sets the bar for market timing.
- Cap rate 16.5% vs local median 5.0% in Phenix City — top-decile yield for the area; either an underpriced asset or a hidden risk that comps aren't pricing in. Stress-test before assuming the spread holds.
Location & tenants
- Location reads 60/100 on livability (#297 in AL) — a middle-class / working-renter tenant base. Strengths: cost of living A+, housing A+; Watch: schools D+, crime F, amenities F.
- Phenix City (suburban): math 22% / reading 44% proficiency, ranked #59 of 129 in AL (top 46%) — families likely to look elsewhere, expect single-tenant / working-renter base with shorter leases; 64% free/reduced lunch — lower-income household profile, screen leases tightly.
- Market conditions: 132 active listings in the ZIP; 2 comparable units currently listed for rent nearby; 183 units permitted in Russell County in 2024 (0 in 5+ unit buildings).
Forward outlook
- Local home prices are declining (-3.0%/yr); year-one equity from $550 of loan paydown is wiped out by about $2k of value loss. Plan a longer hold.
- Russell County population projected at +42% by 2050 — long-run rental-demand tailwind backs the buy-and-hold thesis.
- At projected returns (-3.0% appreciation + 3.0% rent growth), your $22k cash investment doubles in ~4 years — after that, you're playing with house money.
Negotiation context
- It's been on market 79 days — a 6% lower offer ($75k) is reasonable based on typical stale-listing flexibility.
- 5 sale attempts since 4y ago with the ask held roughly flat each time — persistent listings suggest the price (not the market) is what's stuck; bring a comps-based counter.
- Current owner paid $22k; list at $80k implies a 264% gain — meaningful room to come down on a strong offer.
Risks & watch-outs
- Watch-outs: built in 1940 — expect roof / HVAC / electrical / plumbing capex.
- Climate carrying-cost: major wind risk, 76% chance of damaging wind over 30y; extreme-heat days projected 7→17/yr by 2055 (HVAC capex compounding) — expect insurance premiums to compound above CPI over the hold.
Questions for the listing agent
- It's been on market 79 days. Have you received any prior offers? Is the seller open to a 6% concession, seller financing, or rate buy-down credit?
- Built in 1940 — when were the roof, HVAC, electrical panel, plumbing, and water heater last replaced?
- Why hasn't it sold? Are there any deal-killer items the seller is aware of (foundation, flood, title, zoning, code violations)?
- Is there a deadline driving the sale (1031 exchange, divorce, estate, relocation)? That informs how much negotiation room exists.
- Schools are D-rated, which usually means shorter tenancies and higher turnover. Who's the typical renter profile here, and what's been the actual vacancy rate?
- Crime grade is F in this area — have there been break-ins, vandalism, or insurance claims at this property in the last 3 years? What carrier currently insures it and at what premium?
- What's the average days-on-market for RENTAL listings here right now (not sales)? A rising rental-DOM trend means longer vacancies and softer asking-rent achievability than the comps imply.
- What's the recent tenant-quality profile in this submarket — average credit score on applications, eviction rate, late-payment / NSF rate, and stable-employment percentage? A property-management company in the area should have these aggregated.
- How much new for-sale + rental construction is in the pipeline within 1–3 miles? Heavy new supply typically softens prices + rents 12–24 months out; constrained supply supports both.
Investment metrics
- 1% rule
- 1.84% ✓
- Cap rate
- 16.53%
- Cash-on-cash
- 36.55%
- DSCR
- 2.63
- GRM
- 4.5
CMA / ARV
- ARV (on-the-fly)
- $83,460
- Comps found
- 7
Show comp detail 7 sales within ~0.75 mi
| Address | Dist | Beds/Ba | Sqft | Sold | Price | $/sf | Match |
|---|---|---|---|---|---|---|---|
| 1009 11th St | 0.02mi | 2/1.0 (+1) | 802 (+3%) | 10mo | $86,000 | $107 | 81 |
| 700 12th Ave | 0.57mi | 2/1.0 (+1) | 825 (+6%) | 3mo | $132,000 | $160 | 57 |
| 1000 N Railroad St | 0.73mi | 1/1.0 | 802 (+3%) | 8mo | $9,500 | $12 | 55 |
| 1514 10th Ave | 0.61mi | 2/1.0 (+1) | 816 (+5%) | 10mo | $23,000 | $28 | 50 |
| 1201 Front Ave | 0.66mi | 1/1.0 | 664 (-15%) | 5mo | $235,000 | $354 | 40 |
| 1201 Front Ave #213 | 0.66mi | 1/1.0 | 719 (-8%) | 22mo | $232,500 | $323 | 38 |
| 1002 N Railroad St | 0.73mi | 2/1.0 (+1) | 818 (+5%) | 19mo | $10,000 | $12 | 37 |
Match score weights: distance 35% · size 25% · config 20% · recency 20%. Top-matched comps best support the ARV.
Projected returns pro-forma
-3.0% appreciation · 3.0% rent growth · sell at horizon
- IRR
- 32.3%
- Equity multiple
- 2.36×
- Total profit
- $30,279
- Equity at exit
- $11,854
- IRR
- 39.4%
- Equity multiple
- 4.68×
- Total profit
- $81,886
- Equity at exit
- $6,874
Cash invested: $22,260 (down + closing). Projections, not guarantees.
Landlord ↔ Tenant lean methodology
- Overall (STATE)
- 90 Strongly Landlord-Friendly
- State Alabama
- 90 Strongly Landlord-Friendly · R+15
- County
- — inherits STATE
- City
- — inherits STATE
ZIP-level market 36870
- Home prices YoY
- -10.5%
- Active inventory
- 132
- Price-to-rent
- 4.5×
Monthly cashflow live
- Estimated rent
- $1,466 medium interval (Pro) →
- Mortgage (P&I)
- −$417
- Tax from tax record
- −$30 /mo · $359/yr
- Insurance
- −$33
- HOA
- −$0
- Vacancy / Maint / Mgmt
- −$308
- Net cashflow
- $678
Break-even live
UW: 25.0% down · 7.5% · 30yr · 1.5% tax · 5.0% vac · 8.0% maint · 8.0% mgmt
Financing live
Cash to close
- Down payment
- $19,875
- Closing costs
- $2,385
- Reserves months
- —
- Total cash needed
- —
Loan-product check · same deal, 3 products live
Conventional
25% down · 7.5% · 30yr
- Down + closing
- —
- Monthly P&I
- —
- Monthly cashflow
- —
- DSCR
- —
- Eligible?
- —
Personal DTI + credit; lowest rate.
DSCR
20% down · 8.5% · 30yr
- Down + closing
- —
- Monthly P&I
- —
- Monthly cashflow
- —
- DSCR
- —
- Eligible?
- —
No personal income docs; deal must DSCR.
Hard money
10% down · 12.0% · 12mo
- Down + closing
- —
- Monthly P&I
- —
- Monthly cashflow
- —
- DSCR
- —
- Eligible?
- —
Short-term bridge; refi at stabilization.
Rent comps 2 comps
| Address | Beds | Baths | Sqft | Rent | $/sqft | DOM | Units | Dist |
|---|---|---|---|---|---|---|---|---|
| 1106 Broadway Unit 1106C Columbus, GA | 1.0 | 1.0 | 930 | $1,600 | $1.72 | 13d | 1 | 0.83mi |
| 1204 1st Ave #306 Columbus, GA | — | 1.0 | 898 | $1,295 | $1.44 | 43d | 1 | 0.92mi |
Listing history 22 events
-
2026-06-18days on market $79,500 Active 79 DOM
-
2026-06-17days on market $79,500 Active 78 DOM
-
2026-06-16days on market $79,500 Active 77 DOM
-
2026-06-15days on market $79,500 Active 76 DOM
-
2026-06-14days on market $79,500 Active 74 DOM
-
2026-06-13days on market $79,500 Active 73 DOM
-
2026-06-10days on market $79,500 Active 71 DOM
-
2026-06-09days on market $79,500 Active 70 DOM
-
2026-06-08days on market $79,500 Active 69 DOM
-
2026-06-07days on market $79,500 Active 68 DOM
-
2026-06-05days on market $79,500 Active 65 DOM
-
2026-06-02days on market $79,500 Active 63 DOM
-
2026-06-01days on market $79,500 Active 62 DOM
-
2026-05-31days on market $79,500 Active 61 DOM
-
2026-05-30days on market $79,500 Active 60 DOM
-
2026-03-31$79,500 Active
-
2025-04-03status Active
-
2025-02-12status Pending
-
2025-01-13$79,500 Active
-
2022-04-04$76,500
-
2022-04-04$76,500 Active
-
2006-07-27soldstatus $21,864
ⓘ Source: listings_history table (triggers on properties + properties_extension) + one-shot
backfill from property_details.listing_events for pre-trigger history.
Tax reassessment forecast AL · Resets to sale price
- Current annual tax
- $359 · $30/mo
- Projected year-2 tax
- $359 · $30/mo
- Expected delta
- $0/yr ($0/mo · 0.0%)
ⓘ Screening estimate from a state-policy table — verify with the county assessor before closing.
Climate risk First Street
- Flood 1/10 Low FEMA zone X (unshaded) · 0% chance over 30 yrs
- Wildfire 1/10 Low
- Heat 7/10 Severe 7 d/yr ≥107°F today · 17 d/yr by 30 yrs out
- Wind 6/10 Major 76% chance of damaging wind over 30 yrs
- Air quality 5/10 Major 7 unhealthy d/yr today · 8 by 30 yrs out
Nearby sold comps map
Loading sold comps map…
Walkable amenities ~0.75 mi
Loading nearby amenities…
Taxation est. · year 1
- Rental income
- $17,589
- − Mortgage interest
- −$4,453
- − Property taxes
- −$359
- − Insurance
- −$398
- − Repairs & maintenance
- −$1,407
- − Management
- −$1,407
- − Depreciation
- −$2,313
- Taxable income
- $7,252
- Est. tax owed @ 24.0%
- −$1,741
- After-tax cash flow
- $6,395/yr
For passive investors: Depreciation is non-cash, so a rental often shows a tax loss while cash-flowing — sheltering income. Rental losses are passive: they offset passive income freely, and up to $25,000/yr can offset ordinary (W-2) income if you actively participate and your MAGI is under $100k (phasing out to $0 by $150k); unused losses carry forward. On sale, claimed depreciation is recaptured at up to 25%, and gains may owe capital-gains tax (a 1031 exchange can defer both). Figures are a year-1 estimate at your 24.0% rate — not tax advice; consult a CPA.
Schools (NCES district)
- District
- Phenix City
- NCES district ID
- 0102700
- Math proficiency
- 22% ▼ -24.00%
- Reading proficiency
- 44% ▼ -1.00%
- Median HH income
- $36,228
- Composite
- 27.29/100
- National rank
- #7001
- State rank
- #59 of 129 in AL
Livability — Phenix City
- Score
- 60/100
- State rank
- #297
- US rank
- #19037
Category grades
Schools grade is shown separately in the Schools card above.
Census & demographics
- Census place
- Phenix City, AL
- County
- Lee County · 144,175 people
- Metro
- Auburn-Opelika, AL
- Population (ZIP)
- 17,951
- Household income
- $72,500
- Rent vs Own
- Severe rent burden
- 500.0
Population outlook (Russell County) Hauer SSP2
- Today (2025)
- 70,137 people
- By 2030
- 75,826 · +8.1%
- By 2040
- 87,858 · +25.3%
- By 2050
- 99,721 · +42.2%
- By 2075
- 128,009 · +82.5%
- By 2100
- 149,251 · +112.8%
Race, ethnicity, and origin ACS 2023
- Neighborhood character
- Predominantly White (72%)
- Race & ethnicity
- White 72% Black 18% Two or more races 4% Hispanic / Latino 4%
- Common ancestry
- Slovak 3% Romanian 2% Portuguese 2%
- Foreign-born
- 3% · Canada, South Korea, Jamaica
- Languages at home
- 95% English-only · Spanish 3% Korean 1%
Political lean MEDSL · Russell
- 2024 margin
- Toss-up / Even · D 50.4% · R 48.7%
- 2008→2024 swing
- -5.6pp toward R · 2008: 7.3pp · 2024: 1.7pp
- All cycles
- 2024: D+1.7 2020: D+6.4 2016: D+1.9 2012: D+11.8 2008: D+7.3
Not yet ingested
- Civics
- —
Market trends
- HPI YoY
- ▼ -28.19%
- Current HPI
- 241.1403
- Rent YoY
- —
- Metro
- Auburn-Opelika, AL
- State GDP YoY
- ▲ 2.94%
- F500 in state
- 4
Industry mix (Fortune 500 HQ in AL)
| Industry | F500 HQs | Revenue |
|---|---|---|
| Financial Services | 1 | $8B |
|
||
| Healthcare | 1 | $5B |
|
||
Price history
+263.6% since first listed7 events — show timeline
- 2026-03-31 Listed $79,500 EABOR
- 2025-04-03 Relisted — EABOR
- 2025-02-12 Pending — EABOR
- 2025-01-13 Listed $79,500 EABOR
- 2022-04-04 Listed $76,500 EABOR
- 2022-04-04 Listed $76,500 EABOR
- 2006-07-27 Sold (Public Records) $21,864 Public Records
Property tax history
+3.0%/yrLatest (2025): $359 · +4.8% YoY. Source: county tax records.
Cash-flow waterfall
monthlySold comps — $/sqft
last 12 mo · ≤1 miLoading sold comps…