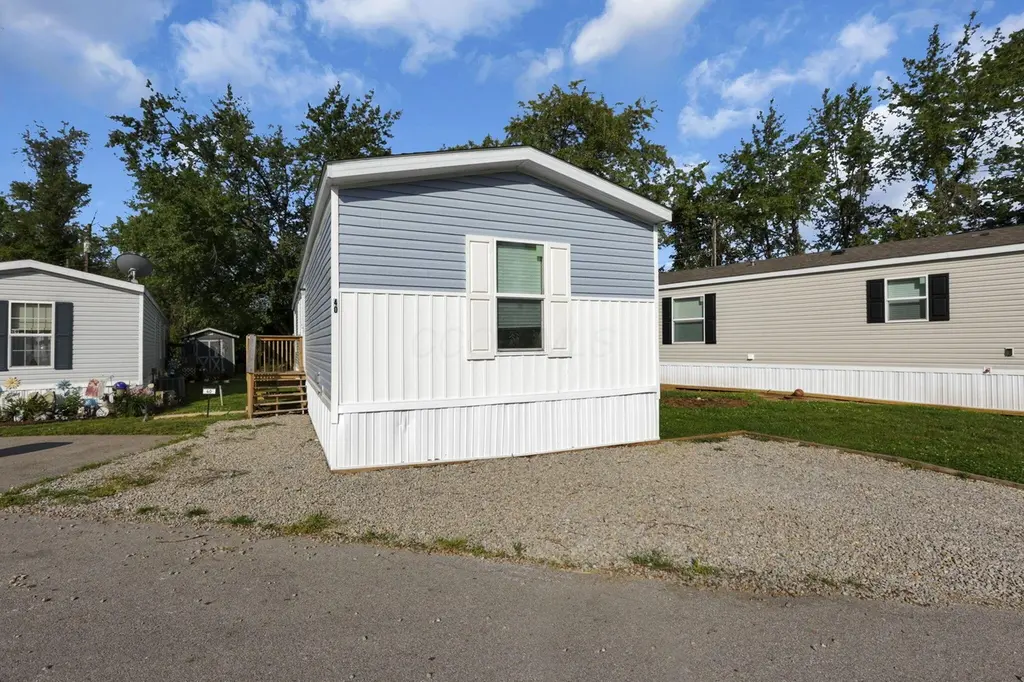
2288 W High St NE Lot 40 · Hanover, OH
Flood risk 1/10 · Minimal
- FEMA flood zone
- X (unshaded)
- Chance of flooding over 30 yrs
- 0.0%
- Est. flood insurance / yr
- $507 – $1,088
Fire risk 1/10 · Minimal
- Est. fire insurance / yr
- $713 – $1,323
Heat risk 3/10 · Minor
- Hot days now (above 99°F)
- 7 days/yr
- Hot days in 30 yrs
- 18 days/yr
Wind risk 2/10 · Minimal
- Chance of severe wind over 30 yrs
- 1.0%
Air-quality risk 2/10 · Minimal
- Unhealthy air days now
- 1 days/yr
- Unhealthy air days in 30 yrs
- 3 days/yr
Risk factors via First Street. Map © Google.
Why this score? — see what drove the C grade
The composite is a weighted blend of 9 inputs, each scored 0–100. Each bar is that input's sub-score; the figure is the points it added to the 100-point composite (weight × sub-score).
- Cash flow +19.1/30.0
- 1% rule +10.0/10.0
- ARV discount +7.5/15.0
- DSCR +6.0/10.0
- Schools +4.7/10.0
- Condition / age +4.0/5.0
- Livability +3.6/5.0
- Rent growth +2.9/5.0
- Appreciation +0.0/10.0
$77,800
🖨 Deal sheet 📄 Offer letter ✓ Due diligence
Listing remarks
Welcome to the Horizon, a 3 bed 2 bath beautifully maintained 2025 manufactured home located in a desirable mobile home community in Newark, Ohio. This modern residence features all electric, energy-efficient smart appliances and a thoughtfully designed layout that combines comfort, style, and functionality.
Key facts
- Built 2025
- Listed 28 days
Tags
Property features AI
Finance
- HOA & community: Homeowners association present; Association fee $500 per month; Association fee includes water, sewer and trash
Exterior
- Parking: On-street parking
- Utilities: Public sewer; Well water
- Home design: Single-story mobile/manufactured home; Other residential without deeded land
- Construction: Built in 2025; Other foundation type
- Exterior features: Mobile home dimensions roughly 66' x 16'; No additional parcels
Interior
- Bedrooms: Three main-level bedrooms
- Flooring: Vinyl flooring
- Bathrooms: Two full bathrooms
- Heating & cooling: Electric heating; Central air conditioning
- Interior features: Insulated windows throughout; Living area approximately 1,056
Neighborhood map
What this means for you Summary
Snapshot
- This is a 3-bed/2.0-bath single-family listed at $78k. Condition is rated good.
Deal economics
- At list price, monthly cash flow is $82 ($985/yr) — positive.
- The deal already cash-flows at list — no discount required.
- Meets the 1% rule at list price ($1k rent vs $78k).
- Recommended offer: $77k (1.5% below list) — sets the bar for market timing.
Location & tenants
- Location reads 71/100 on livability (#402 in OH) — a middle-class / working-renter tenant base. Strengths: crime A+, employment A+, cost of living A+; Watch: schools C-, amenities F, commute F.
- Licking Valley Local (rural): math 56% / reading 54% proficiency, ranked #360 of 656 in OH (top 55%) — acceptable for families but not a draw, mixed tenant base, ~2y average lease.
- Market conditions: Rents rising (+1.6%/yr); 204 active listings in the ZIP; 159 units permitted in Licking County in 2024 (0 in 5+ unit buildings).
Forward outlook
- Local home prices are declining (-3.0%/yr); year-one equity from $538 of loan paydown is wiped out by about $2k of value loss. Plan a longer hold.
Negotiation context
- It's been on market 28 days — a 2% lower offer ($77k) is reasonable based on typical stale-listing flexibility.
Risks & watch-outs
- Watch-outs: HOA is 35% of rent.
Questions for the listing agent
- What does the HOA fee cover, when was the last increase, and are there any pending special assessments or reserve-fund shortfalls?
- Is there a deadline driving the sale (1031 exchange, divorce, estate, relocation)? That informs how much negotiation room exists.
- What's the average days-on-market for RENTAL listings here right now (not sales)? A rising rental-DOM trend means longer vacancies and softer asking-rent achievability than the comps imply.
- What's the recent tenant-quality profile in this submarket — average credit score on applications, eviction rate, late-payment / NSF rate, and stable-employment percentage? A property-management company in the area should have these aggregated.
- How much new for-sale + rental construction is in the pipeline within 1–3 miles? Heavy new supply typically softens prices + rents 12–24 months out; constrained supply supports both.
Investment metrics
- 1% rule
- 1.82% ✓
- Cap rate
- 7.56%
- Cash-on-cash
- 4.52%
- DSCR
- 1.20
- GRM
- 4.6
CMA / ARV
- ARV (on-the-fly)
- $189,024
- Comps found
- 9
Show comp detail 9 sales within ~0.75 mi
| Address | Dist | Beds/Ba | Sqft | Sold | Price | $/sf | Match |
|---|---|---|---|---|---|---|---|
| 2288 W High St NE Lot 12 | 0.12mi | 3/2.0 | 1,056 (0%) | 13mo | $77,800 | $74 | 84 |
| 2288 W High St Lot 38 | 0.04mi | 3/2.0 | 935 (-12%) | 1mo | $38,000 | $41 | 78 |
| 2288 High St Lot 8 | 0.12mi | 3/2.0 | 1,061 (+0%) | 22mo | $62,500 | $59 | 76 |
| 232 Darla Dr | 0.30mi | 3/1.5 | 1,032 (-2%) | 21mo | $249,000 | $241 | 63 |
| 2850 E High St | 0.61mi | 3/1.0 | 1,065 (+1%) | 5mo | $190,000 | $178 | 62 |
| 1603 W High St NE | 0.68mi | 3/2.0 | 1,162 (+10%) | 1mo | $349,900 | $301 | 51 |
| 296 Sunset Dr NE | 0.72mi | 3/2.0 | 1,144 (+8%) | 15mo | $310,000 | $271 | 40 |
| 841 N N Main St NE | 0.57mi | 3/1.0 | 964 (-9%) | 22mo | $173,000 | $179 | 37 |
| 1549 W High St NE | 0.74mi | 3/1.0 | 1,188 (+12%) | 16mo | $260,000 | $219 | 27 |
Match score weights: distance 35% · size 25% · config 20% · recency 20%. Top-matched comps best support the ARV.
Projected returns pro-forma
-3.0% appreciation · 1.63% rent growth · sell at horizon
- IRR
- -11.6%
- Equity multiple
- 0.59×
- Total profit
- $-8,980
- Equity at exit
- $11,600
- IRR
- -5.8%
- Equity multiple
- 0.66×
- Total profit
- $-7,450
- Equity at exit
- $6,727
Cash invested: $21,784 (down + closing). Projections, not guarantees.
Landlord ↔ Tenant lean methodology
- Overall (STATE)
- 73 Landlord-Friendly
- State Ohio
- 73 Landlord-Friendly · R+6
- County
- — inherits STATE
- City
- — inherits STATE
ZIP-level market 43055
- Rents YoY
- 1.6%
- Active inventory
- 204
- Price-to-rent
- 4.6×
Monthly cashflow live
- Estimated rent
- $1,417 medium interval (Pro) →
- Mortgage (P&I)
- −$408
- Tax est. 1.5%
- −$97 /mo · $1,167/yr
- Insurance
- −$32
- HOA
- −$500
- Vacancy / Maint / Mgmt
- −$298
- Net cashflow
- $82
Break-even live
UW: 25.0% down · 7.5% · 30yr · 1.5% tax · 5.0% vac · 8.0% maint · 8.0% mgmt
Financing live
Cash to close
- Down payment
- $19,450
- Closing costs
- $2,334
- Reserves months
- —
- Total cash needed
- —
Loan-product check · same deal, 3 products live
Conventional
25% down · 7.5% · 30yr
- Down + closing
- —
- Monthly P&I
- —
- Monthly cashflow
- —
- DSCR
- —
- Eligible?
- —
Personal DTI + credit; lowest rate.
DSCR
20% down · 8.5% · 30yr
- Down + closing
- —
- Monthly P&I
- —
- Monthly cashflow
- —
- DSCR
- —
- Eligible?
- —
No personal income docs; deal must DSCR.
Hard money
10% down · 12.0% · 12mo
- Down + closing
- —
- Monthly P&I
- —
- Monthly cashflow
- —
- DSCR
- —
- Eligible?
- —
Short-term bridge; refi at stabilization.
HOA detail
- Monthly dues
- $500 · $6,000/yr
- Likely covers
- electric
Listing history 15 events
-
2026-06-18days on market $77,800 Active 28 DOM
-
2026-06-17days on market $77,800 Active 27 DOM
-
2026-06-16days on market $77,800 Active 26 DOM
-
2026-06-15days on market $77,800 Active 25 DOM
-
2026-06-13days on market $77,800 Active 23 DOM
-
2026-06-13days on market $77,800 Active 22 DOM
-
2026-06-09days on market $77,800 Active 19 DOM
-
2026-06-08days on market $77,800 Active 18 DOM
-
2026-06-07days on market $77,800 Active 17 DOM
-
2026-06-05days on market $77,800 Active 14 DOM
-
2026-06-03days on market $77,800 Active 13 DOM
-
2026-06-02days on market $77,800 Active 12 DOM
-
2026-06-01days on market $77,800 Active 11 DOM
-
2026-05-31days on market $77,800 Active 10 DOM
-
2026-05-21$77,800 Active
ⓘ Source: listings_history table (triggers on properties + properties_extension) + one-shot
backfill from property_details.listing_events for pre-trigger history.
Climate risk First Street
- Flood 1/10 Low FEMA zone X (unshaded) · 0% chance over 30 yrs
- Wildfire 1/10 Low
- Heat 3/10 Moderate 7 d/yr ≥99°F today · 18 d/yr by 30 yrs out
- Wind 2/10 Low 100% chance of damaging wind over 30 yrs
- Air quality 2/10 Low 1 unhealthy d/yr today · 3 by 30 yrs out
Nearby sold comps map
Loading sold comps map…
Walkable amenities ~0.75 mi
Loading nearby amenities…
Taxation est. · year 1
- Rental income
- $17,008
- − Mortgage interest
- −$4,358
- − Property taxes
- −$1,167
- − Insurance
- −$389
- − Repairs & maintenance
- −$1,361
- − Management
- −$1,361
- − HOA
- −$6,000
- − Depreciation
- −$2,263
- Taxable income
- $110
- Est. tax owed @ 24.0%
- −$26
- After-tax cash flow
- $958/yr
For passive investors: Depreciation is non-cash, so a rental often shows a tax loss while cash-flowing — sheltering income. Rental losses are passive: they offset passive income freely, and up to $25,000/yr can offset ordinary (W-2) income if you actively participate and your MAGI is under $100k (phasing out to $0 by $150k); unused losses carry forward. On sale, claimed depreciation is recaptured at up to 25%, and gains may owe capital-gains tax (a 1031 exchange can defer both). Figures are a year-1 estimate at your 24.0% rate — not tax advice; consult a CPA.
Condition & rehab AI · 30 photos
This modern manufactured home in a desirable mobile home community is in good condition with minimal repairs needed. It offers a good balance of style and functionality, making it an attractive option for both resale and rental.
Value-add opportunities
- Both Paint the exterior siding — Enhances curb appeal and value
- Both Replace the worn-out entryway mat — Improves first impression and cleanliness
- Both Add a small outdoor rug — Enhances curb appeal and comfort
Renovation cost estimate screening
Value-add ROI direction
- Both Paint the exterior siding — Enhances curb appeal and value ↑
- Both Replace the worn-out entryway mat — Improves first impression and cleanliness ↑
- Both Add a small outdoor rug — Enhances curb appeal and comfort ↑
ⓘ Cost ranges are severity-bucket heuristics (US national rule-of-thumb). Get contractor quotes + a written scope before underwriting a rehab budget.
Schools (NCES district)
- District
- Licking Valley Local
- NCES district ID
- 3904801
- Math proficiency
- 56% ▼ -5.00%
- Reading proficiency
- 54% ▼ -5.00%
- Median HH income
- $52,968
- Composite
- 47.23/100
- National rank
- #2315
- State rank
- #360 of 656 in OH
Livability — Hanover
- Score
- 71/100
- State rank
- #402
- US rank
- #6627
Category grades
Schools grade is shown separately in the Schools card above.
Census & demographics
- Census place
- Hanover, OH
- County
- Licking County · 109,194 people
- Metro
- Columbus, OH
- Population (ZIP)
- 63,281
- Household income
- $63,974
- Rent vs Own
- Severe rent burden
- 2269.0
Population outlook (Licking County) Hauer SSP2
- Today (2025)
- 178,210 people
- By 2030
- 180,917 · +1.5%
- By 2040
- 183,885 · +3.2%
- By 2050
- 182,985 · +2.7%
- By 2075
- 178,377 · +0.1%
- By 2100
- 161,075 · -9.6%
Race, ethnicity, and origin ACS 2023
- Neighborhood character
- Predominantly White (89%)
- Race & ethnicity
- White 89% Two or more races 5% Black 3% Hispanic / Latino 2%
- Common ancestry
- Slovak 2% Romanian 2% Lithuanian 2%
- Foreign-born
- 2% · Canada
- Languages at home
- 96% English-only · Spanish 2% Arabic 1%
Political lean MEDSL · Licking
- 2024 margin
- Solid R (+30.0) · D 34.5% · R 64.6%
- 2008→2024 swing
- -14.2pp toward R · 2008: -15.8pp · 2024: -30.0pp
- All cycles
- 2024: R+30.0 2020: R+28.1 2016: R+28.9 2012: R+14.7 2008: R+15.8
Not yet ingested
- Civics
- —
Market trends
- HPI YoY
- ▼ -253.54%
- Current HPI
- 247.9425
- Rent YoY
- ▲ 1.63%
- Metro
- Columbus, OH
- State GDP YoY
- ▲ 1.98%
- F500 in state
- 48
Industry mix (Fortune 500 HQ in OH)
| Industry | F500 HQs | Revenue |
|---|---|---|
| Insurance | 3 | $145B |
|
||
| Industrial Machinery | 3 | $49B |
|
||
| Financial Services | 3 | $24B |
|
||
| Consumer Goods | 2 | $93B |
|
||
| Aerospace / Defense | 2 | $47B |
|
||
| Utilities | 2 | $33B |
|
||
Price history
1 event — show timeline
- 2026-05-21 Listed $77,800 CBRMLS
Cash-flow waterfall
monthlySold comps — $/sqft
last 12 mo · ≤1 miLoading sold comps…