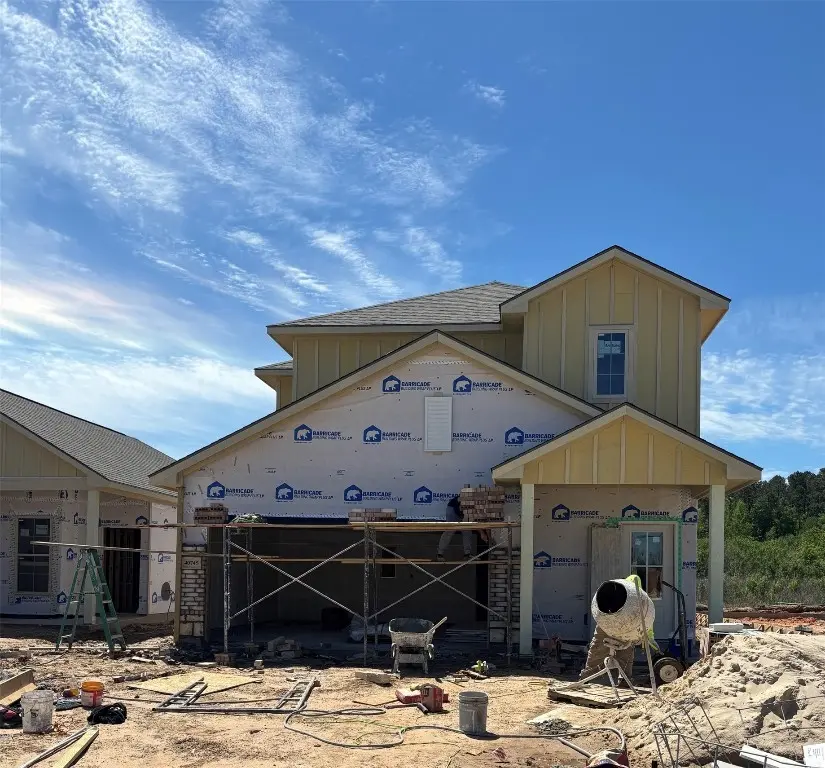
40745 Mostyn Lake Dr · Magnolia, TX
Flood risk No data
- FEMA flood zone
- —
- Chance of flooding over 30 yrs
- —
- Est. flood insurance / yr
- —
Fire risk No data
- Est. fire insurance / yr
- —
Heat risk No data
- Hot days now (above threshold)
- —
- Hot days in 30 yrs
- —
Wind risk No data
- Chance of severe wind over 30 yrs
- —
Air-quality risk No data
- Unhealthy air days now
- —
- Unhealthy air days in 30 yrs
- —
Risk factors via First Street. Map © Google.
Why this score? — see what drove the D+ grade
The composite is a weighted blend of 9 inputs, each scored 0–100. Each bar is that input's sub-score; the figure is the points it added to the 100-point composite (weight × sub-score).
- Cash flow +11.0/30.0
- Appreciation +10.0/10.0
- ARV discount +6.2/15.0
- Schools +3.9/10.0
- Livability +3.7/5.0
- DSCR +3.2/10.0
- Rent growth +2.6/5.0
- 1% rule +2.5/10.0
- Condition / age +2.5/5.0
$315,305
🖨 Deal sheet 📄 Offer letter ✓ Due diligence
Listing remarks MLS
The Canton II S offers a spacious two-story open-concept design with a versatile game room perfect for entertaining or relaxing. This thoughtfully designed home features stylish upgrades including a modern backsplash, enhanced cabinetry, stainless steel appliances with a gas range, and elegant under-cabinet lighting. Quartz countertops with undermount sinks create a clean, sophisticated look throughout. The downstairs primary suite includes a large walk-in closet and a fiberglass walk-in shower with a semi-frameless glass door for a spa-like feel. Additional highlights include a Wi-Fi-enabled thermostat, LED lighting, Low-E tilt-in windows, tankless gas water heater, structured wiring panel, and radiant barrier roof decking. With 5 bedrooms, 3.5 baths, ceiling fans in every bedroom, and a covered back patio, this home blends modern upgrades with everyday functionality.
Key facts
- Open-concept design
- Enhanced cabinetry
- Modern backsplash
Tags
Neighborhood map
What this means for you Summary
Snapshot
- This is a 5-bed/3.5-bath land listed at $315k.
Deal economics
- At list price, monthly cash flow is $-136 ($-2k/yr) — negative.
- To cash-flow at today's rent, offer at most $291k (7.6% below list).
- To meet the 1% rule (rent ≥ 1% of price), the offer needs to be $237k (24.7% below list).
- Recommended offer: $237k (24.7% below list) — sets the bar for 1% rule.
- Cap rate 5.8% vs local median 3.4% in Magnolia — top-decile yield for the area; either an underpriced asset or a hidden risk that comps aren't pricing in. Stress-test before assuming the spread holds.
Location & tenants
- Location reads 73/100 on livability (#222 in TX) — a middle-class / working-renter tenant base. Strengths: crime A+, cost of living A+, housing A+; Watch: schools D+, amenities F, commute F.
- Magnolia ISD (rural): math 42% / reading 45% proficiency, ranked #247 of 826 in TX (top 30%) — families likely to look elsewhere, expect single-tenant / working-renter base with shorter leases.
- Market conditions: Rents flat; 1604 active listings in the ZIP; high-income renter base; 13,259 units permitted in Montgomery County in 2024 (1,402 in 5+ unit buildings).
Forward outlook
- In year one you build about $34k of equity ($2k loan paydown + $32k appreciation (10.0% local appreciation)).
- Montgomery County population projected at +65% by 2050 — long-run rental-demand tailwind backs the buy-and-hold thesis.
- By year 2, paydown + projected appreciation supports a ~$54k cash-out refi (75% LTV) — recoverable capital for the next deal without selling this one.
Negotiation context
- It's been on market 24 days — a 2% lower offer ($311k) is reasonable based on typical stale-listing flexibility.
Questions for the listing agent
- What do current leases actually rent for vs. the listed asking? Can we see a recent rent roll and the last 12 months of T-12 income?
- What does the HOA fee cover, when was the last increase, and are there any pending special assessments or reserve-fund shortfalls?
- Is there a deadline driving the sale (1031 exchange, divorce, estate, relocation)? That informs how much negotiation room exists.
- Schools are D-rated, which usually means shorter tenancies and higher turnover. Who's the typical renter profile here, and what's been the actual vacancy rate?
- The area grade is low — what's the realistic commute time and amenity access for the typical tenant pool here? Any planned neighborhood developments (good or bad) we should know about?
- What's the average days-on-market for RENTAL listings here right now (not sales)? A rising rental-DOM trend means longer vacancies and softer asking-rent achievability than the comps imply.
- What's the recent tenant-quality profile in this submarket — average credit score on applications, eviction rate, late-payment / NSF rate, and stable-employment percentage? A property-management company in the area should have these aggregated.
- How much new for-sale + rental construction is in the pipeline within 1–3 miles? Heavy new supply typically softens prices + rents 12–24 months out; constrained supply supports both.
Investment metrics
- 1% rule
- 0.75% ✗
- Cap rate
- 5.78%
- Cash-on-cash
- -1.84%
- DSCR
- 0.92
- GRM
- 11.1
CMA / ARV
- ARV (median comp)
- $306,542
- List price
- $315,305
- Delta
- 2.86%
- Verdict
- FAIR
- Comps
- 20 within 1.0 mi
Projected returns pro-forma
10.0% appreciation · 0.32% rent growth · sell at horizon
- IRR
- 22.2%
- Equity multiple
- 2.78×
- Total profit
- $156,787
- Equity at exit
- $284,052
- IRR
- 19.4%
- Equity multiple
- 6.18×
- Total profit
- $457,051
- Equity at exit
- $612,568
Cash invested: $88,285 (down + closing). Projections, not guarantees.
Landlord ↔ Tenant lean methodology
- Overall (STATE)
- 87 Strongly Landlord-Friendly
- State Texas
- 87 Strongly Landlord-Friendly · R+5
- County
- — inherits STATE
- City
- — inherits STATE
ZIP-level market 77354
- Home prices YoY
- 2.4%
- Rents YoY
- 0.3%
- Active inventory
- 1604
- Price-to-rent
- 11.1×
Monthly cashflow live
- Estimated rent
- $2,374 medium interval (Pro) →
- Mortgage (P&I)
- −$1,653
- Tax from tax record
- −$159 /mo · $1,911/yr
- Insurance
- −$131
- HOA
- −$67
- Vacancy / Maint / Mgmt
- −$499
- Net cashflow
- $-136
Break-even live
UW: 25.0% down · 7.5% · 30yr · 1.5% tax · 5.0% vac · 8.0% maint · 8.0% mgmt
Financing live
Cash to close
- Down payment
- $78,826
- Closing costs
- $9,459
- Reserves months
- —
- Total cash needed
- —
Loan-product check · same deal, 3 products live
Conventional
25% down · 7.5% · 30yr
- Down + closing
- —
- Monthly P&I
- —
- Monthly cashflow
- —
- DSCR
- —
- Eligible?
- —
Personal DTI + credit; lowest rate.
DSCR
20% down · 8.5% · 30yr
- Down + closing
- —
- Monthly P&I
- —
- Monthly cashflow
- —
- DSCR
- —
- Eligible?
- —
No personal income docs; deal must DSCR.
Hard money
10% down · 12.0% · 12mo
- Down + closing
- —
- Monthly P&I
- —
- Monthly cashflow
- —
- DSCR
- —
- Eligible?
- —
Short-term bridge; refi at stabilization.
HOA detail
- Monthly dues
- $67 · $804/yr
- Likely covers
- watergasinternet
Listing history 2 events
-
2026-05-02status Pending 881-char remark
Show marketing remark (881 chars)
The Canton II S offers a spacious two-story open-concept design with a versatile game room perfect for entertaining or relaxing. This thoughtfully designed home features stylish upgrades including a modern backsplash, enhanced cabinetry, stainless steel appliances with a gas range, and elegant under-cabinet lighting. Quartz countertops with undermount sinks create a clean, sophisticated look throughout. The downstairs primary suite includes a large walk-in closet and a fiberglass walk-in shower with a semi-frameless glass door for a spa-like feel. Additional highlights include a Wi-Fi-enabled thermostat, LED lighting, Low-E tilt-in windows, tankless gas water heater, structured wiring panel, and radiant barrier roof decking. With 5 bedrooms, 3.5 baths, ceiling fans in every bedroom, and a covered back patio, this home blends modern upgrades with everyday functionality.
-
2026-04-08$315,305 Active 881-char remark
Show marketing remark (881 chars)
The Canton II S offers a spacious two-story open-concept design with a versatile game room perfect for entertaining or relaxing. This thoughtfully designed home features stylish upgrades including a modern backsplash, enhanced cabinetry, stainless steel appliances with a gas range, and elegant under-cabinet lighting. Quartz countertops with undermount sinks create a clean, sophisticated look throughout. The downstairs primary suite includes a large walk-in closet and a fiberglass walk-in shower with a semi-frameless glass door for a spa-like feel. Additional highlights include a Wi-Fi-enabled thermostat, LED lighting, Low-E tilt-in windows, tankless gas water heater, structured wiring panel, and radiant barrier roof decking. With 5 bedrooms, 3.5 baths, ceiling fans in every bedroom, and a covered back patio, this home blends modern upgrades with everyday functionality.
ⓘ Source: listings_history table (triggers on properties + properties_extension) + one-shot
backfill from property_details.listing_events for pre-trigger history.
Tax reassessment forecast TX · Resets to sale price
- Current annual tax
- $1,911 · $159/mo
- Projected year-2 tax
- $5,770 · $481/mo
- Expected delta
- +$3,859/yr (+$322/mo · 201.9%)
ⓘ Screening estimate from a state-policy table — verify with the county assessor before closing.
Nearby sold comps map
Loading sold comps map…
Walkable amenities ~0.75 mi
Loading nearby amenities…
Taxation est. · year 1
- Rental income
- $28,490
- − Mortgage interest
- −$17,662
- − Property taxes
- −$1,911
- − Insurance
- −$1,577
- − Repairs & maintenance
- −$2,279
- − Management
- −$2,279
- − HOA
- −$804
- − Depreciation
- −$9,173
- Taxable loss
- −$7,195
- Est. tax savings @ 24.0%
- +$1,727
- After-tax cash flow
- $100/yr
For passive investors: Depreciation is non-cash, so a rental often shows a tax loss while cash-flowing — sheltering income. Rental losses are passive: they offset passive income freely, and up to $25,000/yr can offset ordinary (W-2) income if you actively participate and your MAGI is under $100k (phasing out to $0 by $150k); unused losses carry forward. On sale, claimed depreciation is recaptured at up to 25%, and gains may owe capital-gains tax (a 1031 exchange can defer both). Figures are a year-1 estimate at your 24.0% rate — not tax advice; consult a CPA.
Schools (NCES district)
- District
- Magnolia ISD
- NCES district ID
- 4828740
- Math proficiency
- 42% ▼ -7.00%
- Reading proficiency
- 45% ▼ -4.00%
- Median HH income
- $71,692
- Composite
- 39.46/100
- National rank
- #3958
- State rank
- #247 of 826 in TX
Livability — Magnolia
- Score
- 73/100
- State rank
- #222
- US rank
- #5442
Category grades
Schools grade is shown separately in the Schools card above.
Census & demographics
- County
- Montgomery County · 663,713 people
- City population
- 32,847
- Metro
- Houston-The Woodlands-Sugar Land, TX
- Population (ZIP)
- 44,900
- Household income
- $112,504
- Rent vs Own
- Severe rent burden
- 586.0
Population outlook (Montgomery County) Hauer SSP2
- Today (2025)
- 713,896 people
- By 2030
- 805,263 · +12.8%
- By 2040
- 992,708 · +39.1%
- By 2050
- 1,179,590 · +65.2%
- By 2075
- 1,628,084 · +128.1%
- By 2100
- 1,937,880 · +171.5%
Race, ethnicity, and origin ACS 2023
- Neighborhood character
- Predominantly White (66%)
- Race & ethnicity
- White 66% Hispanic / Latino 25% Two or more races 18% Black 3% Asian 1%
- Hispanic origin (detail)
- Mexican 14% Puerto Rican 1%
- Common ancestry
- Lithuanian 4% Slovak 2% Italian 2%
- Foreign-born
- 11% · Canada, Vietnam
- Languages at home
- 83% English-only · Spanish 15% Other Indo-European 1% German/W. Germanic 1%
Political lean MEDSL · Montgomery
- 2024 margin
- Solid R (+45.5) · D 26.8% · R 72.3%
- 2008→2024 swing
- +7.2pp toward D · 2008: -52.7pp · 2024: -45.5pp
- All cycles
- 2024: R+45.5 2020: R+43.8 2016: R+51.4 2012: R+60.7 2008: R+52.7
Not yet ingested
- Civics
- —
Market trends
- HPI YoY
- ▲ 12.09%
- Current HPI
- 512.87
- Rent YoY
- ▲ 0.32%
- Metro
- Houston-The Woodlands-Sugar Land, TX
- State GDP YoY
- ▲ 3.95%
- F500 in state
- 110
Industry mix (Fortune 500 HQ in TX)
| Industry | F500 HQs | Revenue |
|---|---|---|
| Energy | 16 | $1,198B |
|
||
| Technology | 5 | $198B |
|
||
| Engineering / Construction | 4 | $72B |
|
||
| Energy Services | 3 | $60B |
|
||
| Utilities | 3 | $41B |
|
||
| Healthcare | 2 | $330B |
|
||
Price history
2 events — show timeline
- 2026-05-02 Pending — HARMLS
- 2026-04-08 Listed $315,305 HARMLS
Property tax history
-0.1%/yrLatest (2025): $1,911 · -0.1% YoY. Source: county tax records.
Cash-flow waterfall
monthlySold comps — $/sqft
last 12 mo · ≤1 miLoading sold comps…