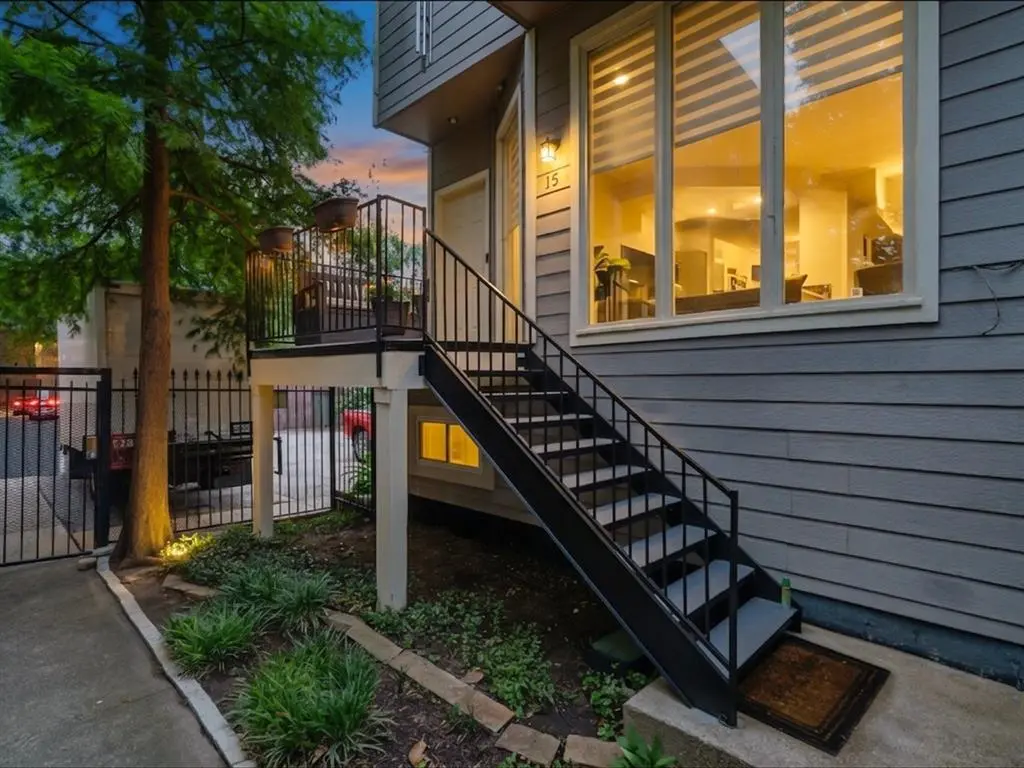
8522 Park Ln #15 · Dallas, TX
Flood risk 1/10 · Minimal
- FEMA flood zone
- X (unshaded)
- Chance of flooding over 30 yrs
- 0.0%
- Est. flood insurance / yr
- $507 – $1,088
Fire risk 1/10 · Minimal
- Est. fire insurance / yr
- $1,222 – $2,270
Heat risk 7/10 · Major
- Hot days now (above 109°F)
- 7 days/yr
- Hot days in 30 yrs
- 23 days/yr
Wind risk 6/10 · Moderate
- Chance of severe wind over 30 yrs
- 27.0%
Air-quality risk 3/10 · Minor
- Unhealthy air days now
- 3 days/yr
- Unhealthy air days in 30 yrs
- 3 days/yr
Risk factors via First Street. Map © Google.
Why this score? — see what drove the D- grade
The composite is a weighted blend of 9 inputs, each scored 0–100. Each bar is that input's sub-score; the figure is the points it added to the 100-point composite (weight × sub-score).
- Cash flow +8.1/30.0
- ARV discount +7.5/15.0
- 1% rule +6.7/10.0
- Livability +4.0/5.0
- Rent growth +3.0/5.0
- Schools +2.8/10.0
- Condition / age +2.5/5.0
- DSCR +2.1/10.0
- Appreciation +0.0/10.0
$220,000
🖨 Deal sheet 📄 Offer letter ✓ Due diligence
Listing remarks MLS
Wow! Look at all the space for the money! Large condo convenient to Presby Hospital and North Park Mall that was recently updated with paint, carpet, granite counter tops, new sinks and hardware. Community Pool and gas grills. Gated community, private garage, loft area - extra storage or play space? Work room off garage too.
Key facts
- Gated community
- Community amenities
- Finished room
Tags
Property features AI
Finance
- Other: Unit is part of the Boardwalk Condo subdivision; Directions available for access from US-75/Park Lane (unit located inside gated Boardwalk Condominiums)
- Financial info: Listing accepts Cash, Conventional, and FHA financing
- HOA & community: Mandatory association; Monthly HOA fee of $500; Association fee includes full use of facilities; Managed by Boardwalk Condominium HOA
Exterior
- Parking: Covered parking for 2 vehicles; 2-car attached garage with garage door opener and rear-facing garage; Additional concrete parking
- Security: Smoke detector(s)
- Utilities: City water; City sewer; Concrete (utility/access note)
- Home design: Condominium (residential); Three or more levels; Unit is not attached (standalone condo entry)
- Construction: Built in 1979; Siding construction; Composition roof; Slab foundation
- Exterior features: Balcony; Courtyard; Patio; Side porch; Gutters; Wrought iron fencing; Corner lot; Few trees; Located in a subdivision; In-ground pool
Interior
- Kitchen: Built-in cabinets; Water line to refrigerator; Dishwasher; Disposal; Electric cooktop; Electric oven; Microwave; Electric water heater
- Bedrooms: 3 bedrooms total; Primary bedroom on level 3 with walk-in closet
- Flooring: Ceramic tile; Vinyl
- Bathrooms: 2 full bathrooms; 1 half bathroom; Primary bathroom ensuite with natural stone/granite countertops and built-in cabinets; Additional bathroom with built-in cabinets and ensuite access; Half bath includes bidet
- Heating & cooling: Central heating (electric); Central air; Ceiling fan(s)
- Interior features: Open floorplan; Loft; Multiple staircases; Chandelier and decorative lighting; Cable TV available; High-speed internet available; Walk-in closet(s); Window coverings
- Laundry & utility: Utility room with sink and built-in cabinets; Full-size washer/dryer area; Washer hookup; Electric dryer hookup
Neighborhood map
What this means for you Summary
Snapshot
- This is a 2-bed/2.5-bath condo listed at $220k.
Deal economics
- At list price, monthly cash flow is $-220 ($-3k/yr) — negative.
- To cash-flow at today's rent, offer at most $181k (17.6% below list).
- Meets the 1% rule at list price ($3k rent vs $220k).
- Recommended offer: $181k (17.6% below list) — sets the bar for cash-flow.
- Cap rate 5.1% vs local median 2.3% in Dallas — top-decile yield for the area; either an underpriced asset or a hidden risk that comps aren't pricing in. Stress-test before assuming the spread holds.
Location & tenants
- Location reads 81/100 on livability (#24 in TX, #1,380 nationally) — a professional / high-income tenant draw. Strengths: amenities A+, commute A+, housing A+; Watch: crime F.
- Dallas ISD (urban): math 31% / reading 36% proficiency, ranked #559 of 826 in TX (top 68%) — families likely to look elsewhere, expect single-tenant / working-renter base with shorter leases; 83% free/reduced lunch — lower-income household profile, screen leases tightly.
- Zoned schools: Jack Lowe Sr El (math 67% / reading 72%, grade A-, #146 of 4,322 statewide, top 4%, 526 students, 98% FRL).
- Zoned-school proficiency averages 70% at this address vs 34% district-wide (+36 pts) — the actual schools serving this property are materially stronger than the Dallas ISD average implies; a family-tenant draw the district grade alone would hide.
- Market conditions: Rents rising (+2.0%/yr); 213 active listings in the ZIP; 25 comparable units currently listed for rent nearby; rentals at typical pace (median 24d on market — plan ~3-4 weeks tenant-placement turnaround); 12,577 units permitted in Dallas County in 2024 (6,829 in 5+ unit buildings).
- At $2,578/mo this rent would consume 53% of the median local household income ($59k/yr) (locally 3482% of renters already pay >50% of income on rent) — very limited rent-growth headroom before tenants either downsize or default.
Forward outlook
- Local home prices are declining (-3.0%/yr); year-one equity from $2k of loan paydown is wiped out by about $7k of value loss. Plan a longer hold.
- Dallas County population projected at +35% by 2050 — long-run rental-demand tailwind backs the buy-and-hold thesis.
Negotiation context
- Only 13 days on market — expect competitive offers; lowballing is unlikely to land.
- 2 sale attempts since 12y ago with the ask held roughly flat each time — persistent listings suggest the price (not the market) is what's stuck; bring a comps-based counter.
Risks & watch-outs
- Watch-outs: property tax is 2.8% of price.
- Climate carrying-cost: major wind risk, 27% chance of damaging wind over 30y; extreme-heat days projected 7→23/yr by 2055 (HVAC capex compounding) — expect insurance premiums to compound above CPI over the hold.
Questions for the listing agent
- What do current leases actually rent for vs. the listed asking? Can we see a recent rent roll and the last 12 months of T-12 income?
- Built in 1979 — when were the roof, HVAC, electrical panel, plumbing, and water heater last replaced?
- Property tax is high relative to price — has the assessment been appealed recently, and will the sale trigger a re-assessment?
- What does the HOA fee cover, when was the last increase, and are there any pending special assessments or reserve-fund shortfalls?
- Any open or pending special assessments — roof, HVAC, plumbing, elevator, façade? What's the per-unit balance and payoff schedule, and is the seller paying it off at close or rolling it to the buyer?
- Is there a deadline driving the sale (1031 exchange, divorce, estate, relocation)? That informs how much negotiation room exists.
- Crime grade is F in this area — have there been break-ins, vandalism, or insurance claims at this property in the last 3 years? What carrier currently insures it and at what premium?
- The area grade is low — what's the realistic commute time and amenity access for the typical tenant pool here? Any planned neighborhood developments (good or bad) we should know about?
- What's the average days-on-market for RENTAL listings here right now (not sales)? A rising rental-DOM trend means longer vacancies and softer asking-rent achievability than the comps imply.
- What's the recent tenant-quality profile in this submarket — average credit score on applications, eviction rate, late-payment / NSF rate, and stable-employment percentage? A property-management company in the area should have these aggregated.
- How much new apartment / multifamily construction is in the pipeline within 1–3 miles? Heavy new supply (>2% of stock underway) typically softens rents 12–24 months out; light construction supports rent growth.
Investment metrics
- 1% rule
- 1.17% ✓
- Cap rate
- 5.09%
- Cash-on-cash
- -4.28%
- DSCR
- 0.81
- GRM
- 7.1
CMA / ARV
No comps found within radius.
Projected returns pro-forma
-3.0% appreciation · 1.96% rent growth · sell at horizon
- IRR
- -25.0%
- Equity multiple
- 0.16×
- Total profit
- $-51,828
- Equity at exit
- $32,803
- IRR
- -25.5%
- Equity multiple
- -0.17×
- Total profit
- $-71,891
- Equity at exit
- $19,022
Cash invested: $61,600 (down + closing). Projections, not guarantees.
Landlord ↔ Tenant lean methodology
- Overall (STATE)
- 87 Strongly Landlord-Friendly
- State Texas
- 87 Strongly Landlord-Friendly · R+5
- County
- — inherits STATE
- City
- — inherits STATE
ZIP-level market 75231
- Rents YoY
- 2.0%
- Active inventory
- 213
- Price-to-rent
- 7.1×
Monthly cashflow live
- Estimated rent
- $2,578 high interval (Pro) →
- Mortgage (P&I)
- −$1,154
- Tax from tax record
- −$511 /mo · $6,137/yr
- Insurance
- −$92
- HOA
- −$500
- Vacancy / Maint / Mgmt
- −$541
- Net cashflow
- $-220
Break-even live
UW: 25.0% down · 7.5% · 30yr · 1.5% tax · 5.0% vac · 8.0% maint · 8.0% mgmt
Financing live
Cash to close
- Down payment
- $55,000
- Closing costs
- $6,600
- Reserves months
- —
- Total cash needed
- —
Loan-product check · same deal, 3 products live
Conventional
25% down · 7.5% · 30yr
- Down + closing
- —
- Monthly P&I
- —
- Monthly cashflow
- —
- DSCR
- —
- Eligible?
- —
Personal DTI + credit; lowest rate.
DSCR
20% down · 8.5% · 30yr
- Down + closing
- —
- Monthly P&I
- —
- Monthly cashflow
- —
- DSCR
- —
- Eligible?
- —
No personal income docs; deal must DSCR.
Hard money
10% down · 12.0% · 12mo
- Down + closing
- —
- Monthly P&I
- —
- Monthly cashflow
- —
- DSCR
- —
- Eligible?
- —
Short-term bridge; refi at stabilization.
Rent comps 25 comps
| Address | Beds | Baths | Sqft | Rent | $/sqft | DOM | Units | Dist |
|---|---|---|---|---|---|---|---|---|
| 5829 Phoenix Dr Dallas, TX | 2.0 | 2.0 | 1493 | $1,650 | $1.11 | 24d | 1 | 0.37mi |
| 7215 Holly Hill Dr Apt 104 Dallas, TX | 3.0 | 2.0 | 2050 | $2,700 | $1.32 | 24d | 1 | 0.44mi |
| 6738 Eastridge Dr Dallas, TX | 2.0 | 2.0 | 1732 | $2,100 | $1.21 | 24d | 1 | 0.48mi |
| 6738 Eastridge Dr Dallas, TX | 2.0 | 2.0 | 1743 | $2,050 | $1.18 | 43d | 2 | 0.48mi |
| 8110 Park Ln Dallas, TX | 2.0 | 1.0–2.0 | 1064 | $3,263 | $3.07 | 1d | 22 | 0.59mi |
| 7522 Holly Hill Dr #1 Dallas, TX | 3.0 | 3.0 | 1448 | $1,800 | $1.24 | 24d | 1 | 0.73mi |
| 30 Lincoln Park Dr Dallas, TX | 2.0 | 2.0 | 1508 | $3,555 | $2.36 | 43d | 1 | 1.00mi |
| 5445 Caruth Haven Ln Dallas, TX | 1.0–2.0 | 1.0–2.0 | 1163 | $3,616 | $3.11 | 2d | 19 | 1.03mi |
| 7825 Firefall Way Dallas, TX | 3.0 | 1.0–2.5 | 1442 | $10,243 | $7.10 | 1d | 48 | 1.17mi |
| 7775 Firefall Way Ste 100 Dallas, TX | 2.0 | 2.0 | 1493 | $2,825 | $1.89 | 43d | 1 | 1.22mi |
| 8250 Meadow Rd Dallas, TX | 3.0 | 1.0–2.0 | 980 | $2,093 | $2.14 | 1d | 28 | 1.22mi |
| 7525 Wentwood Dr Dallas, TX | 3.0 | 2.0 | 1740 | $4,700 | $2.70 | 3d | 1 | 1.22mi |
| 6481 Fisher Rd Dallas, TX | 3.0 | 2.0 | 1510 | $3,250 | $2.15 | 43d | 1 | 1.27mi |
| 7350 Fieldgate Dr Dallas, TX | 3.0 | 3.0 | 2924 | $6,000 | $2.05 | 43d | 1 | 1.29mi |
| 6050 E Lovers Ln Dallas, TX | 2.0 | 2.0 | 1561 | $2,827 | $1.81 | 21d | 1 | 1.34mi |
| 6050 E Lovers Ln Dallas, TX | 2.0 | 2.0 | 1561 | $2,827 | $1.81 | 43d | 1 | 1.34mi |
| 6418 E Lovers Ln Dallas, TX | 3.0 | 2.0 | 1470 | $3,290 | $2.24 | 43d | 1 | 1.38mi |
| 6044 E Lovers Ln Dallas, TX | 1.0–3.0 | 1.5–2.5 | 1605 | $3,248 | $2.02 | 2d | 8 | 1.38mi |
| 7104 Amber Grove Ct Dallas, TX | 3.0 | 2.5 | 1638 | $4,000 | $2.44 | 12d | 1 | 1.43mi |
| 5201 Amesbury Dr Dallas, TX | 1.0–3.0 | 1.0–3.0 | 1019 | $1,978 | $1.94 | 1d | 24 | 1.44mi |
| 7077 Watercrest Pkwy Dallas, TX | 3.0 | 1.0–2.0 | 1014 | $2,981 | $2.94 | 3d | 9 | 1.48mi |
| 8132 Bromley Dr Dallas, TX | 3.0 | 2.5 | 2416 | $4,100 | $1.70 | 43d | 1 | 1.49mi |
| 8132 Bromley Dr Dallas, TX | 3.0 | 2.5 | 2416 | $4,100 | $1.70 | 20d | 1 | 1.49mi |
| 7736 Meadow Rd #101 Dallas, TX | 3.0 | 3.0 | 1625 | $2,800 | $1.72 | 7d | 1 | 1.49mi |
| 8210 Manoa Dr Dallas, TX | 3.0 | 3.5 | 2400 | $3,700 | $1.54 | 43d | 1 | 1.49mi |
HOA detail condo
- Monthly dues
- $500 · $6,000/yr
- Likely covers
- gaspoolsecurity
- Assessments
- None detected in remarks — confirm with the listing agent.
Listing history 9 events
-
2026-06-18days on market $220,000 Active 13 DOM
-
2026-06-17days on market $220,000 Active 12 DOM
-
2026-06-16days on market $220,000 Active 11 DOM
-
2026-06-15days on market $220,000 Active 10 DOM
-
2026-06-13days on market $220,000 Active 8 DOM
-
2026-06-09days on market $220,000 Active 4 DOM
-
2026-06-08days on market $220,000 Active 3 DOM
-
2026-06-07remarks 699-char remark
-
2026-06-07$220,000 Active 2 DOM
ⓘ Source: listings_history table (triggers on properties + properties_extension) + one-shot
backfill from property_details.listing_events for pre-trigger history.
Tax reassessment forecast TX · Resets to sale price
- Current annual tax
- $6,137 · $511/mo
- Projected year-2 tax
- $6,137 · $511/mo
- Expected delta
- $0/yr ($0/mo · 0.0%)
ⓘ Screening estimate from a state-policy table — verify with the county assessor before closing.
Climate risk First Street
- Flood 1/10 Low FEMA zone X (unshaded) · 0% chance over 30 yrs
- Wildfire 1/10 Low
- Heat 7/10 Severe 7 d/yr ≥109°F today · 23 d/yr by 30 yrs out
- Wind 6/10 Major 27% chance of damaging wind over 30 yrs
- Air quality 3/10 Moderate 3 unhealthy d/yr today · 3 by 30 yrs out
Nearby sold comps map
Loading sold comps map…
Walkable amenities ~0.75 mi
Loading nearby amenities…
Taxation est. · year 1
- Rental income
- $30,941
- − Mortgage interest
- −$12,323
- − Property taxes
- −$6,137
- − Insurance
- −$1,100
- − Repairs & maintenance
- −$2,475
- − Management
- −$2,475
- − HOA
- −$6,000
- − Depreciation
- −$6,400
- Taxable loss
- −$5,969
- Est. tax savings @ 24.0%
- +$1,433
- After-tax cash flow
- $-1,205/yr
For passive investors: Depreciation is non-cash, so a rental often shows a tax loss while cash-flowing — sheltering income. Rental losses are passive: they offset passive income freely, and up to $25,000/yr can offset ordinary (W-2) income if you actively participate and your MAGI is under $100k (phasing out to $0 by $150k); unused losses carry forward. On sale, claimed depreciation is recaptured at up to 25%, and gains may owe capital-gains tax (a 1031 exchange can defer both). Figures are a year-1 estimate at your 24.0% rate — not tax advice; consult a CPA.
Schools (NCES district)
- District
- Dallas ISD
- NCES district ID
- 4816230
- Math proficiency
- 31% ▼ -16.00%
- Reading proficiency
- 36% ▼ -4.00%
- Median HH income
- $42,881
- Composite
- 28.41/100
- National rank
- #6763
- State rank
- #559 of 826 in TX
Livability — Dallas
- Score
- 81/100
- State rank
- #24
- US rank
- #1380
Category grades
Schools grade is shown separately in the Schools card above.
Census & demographics
- Census place
- Dallas, TX
- County
- Dallas County · 2,612,404 people
- City population
- 1,168,437
- Metro
- Dallas-Fort Worth-Arlington, TX
- Population (ZIP)
- 38,370
- Household income
- $58,540
- Rent vs Own
- Severe rent burden
- 3482.0
Population outlook (Dallas County) Hauer SSP2
- Today (2025)
- 2,979,839 people
- By 2030
- 3,191,823 · +7.1%
- By 2040
- 3,619,611 · +21.5%
- By 2050
- 4,026,915 · +35.1%
- By 2075
- 4,957,073 · +66.4%
- By 2100
- 5,508,725 · +84.9%
Race, ethnicity, and origin ACS 2023
- Neighborhood character
- Highly diverse neighborhood (Simpson 0.74)
- Race & ethnicity
- Hispanic / Latino 33% White 29% Black 24% Two or more races 13% Asian 9%
- Hispanic origin (detail)
- Mexican 26%
- Common ancestry
- Slovak 1% Lithuanian 1% Romanian 1%
- Foreign-born
- 29% · Canada, Philippines, India
- Languages at home
- 57% English-only · Spanish 27% Other Asian/Pacific 4% Other Indo-European 3%
Political lean MEDSL · Dallas
- 2024 margin
- Strong D (+22.2) · D 60.2% · R 38.0% · Other 1.8%
- 2008→2024 swing
- +6.9pp toward D · 2008: 15.3pp · 2024: 22.2pp
- All cycles
- 2024: D+22.2 2020: D+31.6 2016: D+26.2 2012: D+15.4 2008: D+15.3
Not yet ingested
- Civics
- —
Market trends
- HPI YoY
- ▼ -359.41%
- Current HPI
- 249.5841
- Rent YoY
- ▲ 1.96%
- Metro
- Dallas-Fort Worth-Arlington, TX
- State GDP YoY
- ▲ 3.95%
- F500 in state
- 110
Industry mix (Fortune 500 HQ in TX)
| Industry | F500 HQs | Revenue |
|---|---|---|
| Energy | 16 | $1,198B |
|
||
| Technology | 5 | $198B |
|
||
| Engineering / Construction | 4 | $72B |
|
||
| Energy Services | 3 | $60B |
|
||
| Utilities | 3 | $41B |
|
||
| Healthcare | 2 | $330B |
|
||
Price history
+60.0% since first listed8 events — show timeline
- 2026-06-04 Listed $220,000 NTREIS
- 2015-04-23 Sold (Public Records) — Public Records
- 2015-04-03 Sold (MLS) — NTREIS
- 2015-02-24 Pending — NTREIS
- 2015-02-17 Contingent — NTREIS
- 2015-01-29 Price Changed $129,900 NTREIS
- 2014-10-24 Listed $137,500 NTREIS
- 1983-03-10 Sold (Public Records) — Public Records
Property tax history
+6.6%/yrLatest (2025): $6,137 · -0.4% YoY. Source: county tax records.
Cash-flow waterfall
monthlySold comps — $/sqft
last 12 mo · ≤1 miLoading sold comps…