 Duplex
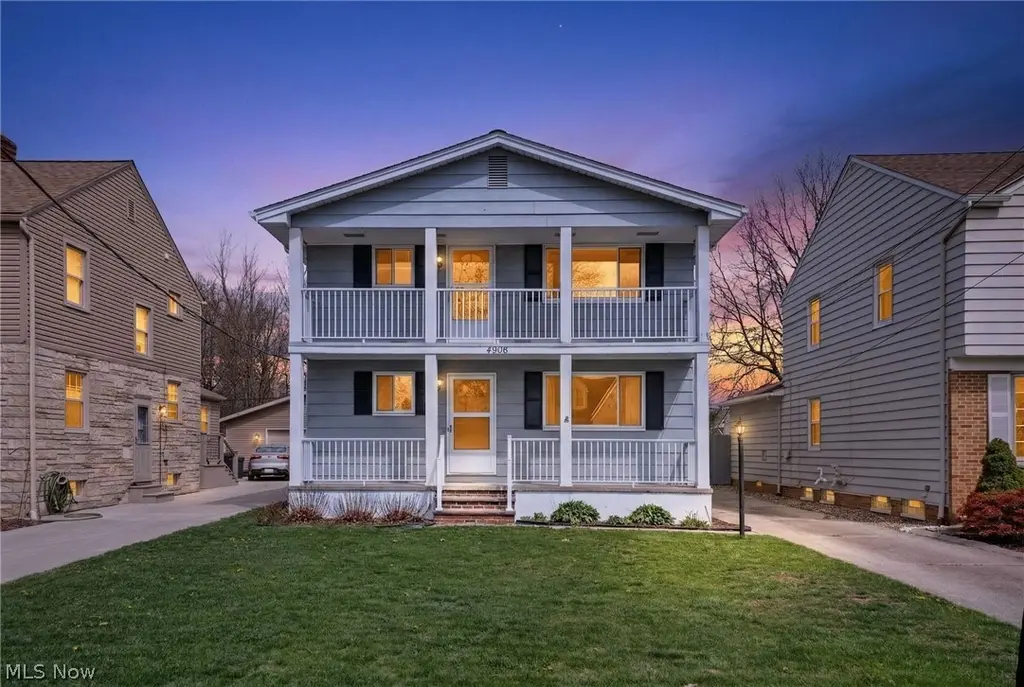
4906 Albertly Ave · Parma, OH
Flood risk 3/10 · Minor
- FEMA flood zone
- X (unshaded)
- Chance of flooding over 30 yrs
- 0.1%
- Est. flood insurance / yr
- $473 – $860
Fire risk 2/10 · Minimal
- Est. fire insurance / yr
- $713 – $1,323
Heat risk 3/10 · Minor
- Hot days now (above 95°F)
- 7 days/yr
- Hot days in 30 yrs
- 17 days/yr
Wind risk 1/10 · Minimal
- Chance of severe wind over 30 yrs
- —
Air-quality risk 3/10 · Minor
- Unhealthy air days now
- 2 days/yr
- Unhealthy air days in 30 yrs
- 4 days/yr
Risk factors via First Street. Map © Google.
Why this score? — see what drove the C grade
The composite is a weighted blend of 9 inputs, each scored 0–100. Each bar is that input's sub-score; the figure is the points it added to the 100-point composite (weight × sub-score).
- Cash flow +22.3/30.0
- DSCR +7.2/10.0
- 1% rule +6.1/10.0
- Rent growth +5.0/5.0
- ARV discount +4.8/15.0
- Schools +4.1/10.0
- Livability +4.1/5.0
- Condition / age +2.5/5.0
- Appreciation +0.0/10.0
$257,500
🖨 Deal sheet (PDF) 📄 Offer letter ✓ Due diligence
Multi-family units
County records classify this as Multi-Family (2-4 Unit). Listing-text estimate: 2 units. confirmed
Listing remarks
Welcome to 4906 Albertly Avenue in Parma! Built in 1973, this inviting, up/down duplex on a quiet street is a stand-out with its dual front porch design. Long-term owner (1990) has decided to sell so this is a perfect opportunity in an in-demand location for an owner-occupant or investor. Michael A. Ries Park is around the corner and offers 4 hard courts for tennis/pickleball. See the aerial photos! Both units are identical in layout and size: 988 sqft, 2 bedrooms, 1 full bath, large eat-in kitchen and a spacious living room with front-door access to a private front porch. The unfinished basement has two separate areas and each has its own HVAC, water/electric hookups plus ample space for s
Key facts
- 4,791 sq ft lot
- 2 garage spots
- Built 1973
Neighborhood map
What this means for you Summary
Snapshot
- This is a 2 × 2-bed/1.0-bath units multifamily listed at $258k.
Deal economics
- At list price, monthly cash flow is $426 ($5k/yr) — positive. Per door: $213/mo.
- The deal already cash-flows at list — no discount required.
- Meets the 1% rule at list price ($3k rent vs $258k).
- Cap rate 8.3% vs local median 5.0% in Parma — top-decile yield for the area; either an underpriced asset or a hidden risk that comps aren't pricing in. Stress-test before assuming the spread holds.
Location & tenants
- Location reads 82/100 on livability (#84 in OH, #1,232 nationally) — a professional / high-income tenant draw. Strengths: crime A+, amenities A+, cost of living A+; Watch: employment C-, commute F.
- Parma City (suburban): math 43% / reading 52% proficiency, ranked #469 of 656 in OH (top 72%) — families likely to look elsewhere, expect single-tenant / working-renter base with shorter leases.
- Market conditions: Rents rising fast (+10.6%/yr); 118 active listings in the ZIP; 15 comparable units currently listed for rent nearby; rentals leasing fast (median 8d on market — plan ~1-2 weeks tenant-placement turnaround); 1,441 units permitted in Cuyahoga County in 2024 (700 in 5+ unit buildings).
- At $2,862/mo this rent would consume 50% of the median local household income ($69k/yr) (locally 668% of renters already pay >50% of income on rent) — very limited rent-growth headroom before tenants either downsize or default.
Forward outlook
- Local home prices are declining (-3.0%/yr); year-one equity from $2k of loan paydown is wiped out by about $8k of value loss. Plan a longer hold.
- Cuyahoga County population projected to shrink 8% by 2050 — rents likely to lag national; underwrite the cash flow, not the appreciation.
- At projected returns (-3.0% appreciation + 8.0% rent growth), your $72k cash investment doubles in ~9 years — after that, you're playing with house money.
Negotiation context
- Only 4 days on market — expect competitive offers; lowballing is unlikely to land.
- Current owner paid $101k; list at $258k implies a 155% gain — meaningful room to come down on a strong offer.
Questions for the listing agent
- Can we see the unit-by-unit rent roll, current vacancy, and any below-market leases? What's the average tenancy length?
- What capital expenditures (roof, boiler, parking lot, exteriors) have been made in the last 5 years, and what's planned in the next 2?
- Built in 1973 — when were the roof, HVAC, electrical panel, plumbing, and water heater last replaced?
- Is there a deadline driving the sale (1031 exchange, divorce, estate, relocation)? That informs how much negotiation room exists.
- Schools are B-rated — typically a magnet for longer-tenancy family renters. What's the average tenant stay here, and is there a school-zone premium baked into asking?
- What's the average days-on-market for RENTAL listings here right now (not sales)? A rising rental-DOM trend means longer vacancies and softer asking-rent achievability than the comps imply.
- What's the recent tenant-quality profile in this submarket — average credit score on applications, eviction rate, late-payment / NSF rate, and stable-employment percentage? A property-management company in the area should have these aggregated.
- How much new apartment / multifamily construction is in the pipeline within 1–3 miles? Heavy new supply (>2% of stock underway) typically softens rents 12–24 months out; light construction supports rent growth.
Investment metrics
- 1% rule
- 1.11% ✓
- Cap rate
- 8.28%
- Cash-on-cash
- 7.09%
- DSCR
- 1.32
- GRM
- 7.5
CMA / ARV
- ARV (on-the-fly)
- $243,048
- Comps found
- 9
Show comp detail 9 sales within ~0.75 mi
| Address | Dist | Beds/Ba | Sqft | Sold | Price | $/sf | Match |
|---|---|---|---|---|---|---|---|
| 4906 Albertly Ave | 0.00mi | 4/2.0 | 1,976 (0%) | 0mo | $277,600 | $140 | 100 |
| 6003 Snow Rd | 0.43mi | 4/2.0 | 1,872 (-5%) | 5mo | $225,000 | $120 | 67 |
| 6125 W 54th St | 0.36mi | 4/2.0 | 2,160 (+9%) | 1mo | $261,900 | $121 | 67 |
| 5886 State Rd | 0.47mi | 4/2.0 | 1,900 (-4%) | 11mo | $238,000 | $125 | 62 |
| 6800 Wilber Ave | 0.62mi | 4/2.0 | 1,766 (-11%) | 2mo | $245,000 | $139 | 52 |
| 6708 Thornton Dr | 0.60mi | 4/2.0 | 1,792 (-9%) | 7mo | $277,500 | $155 | 51 |
| 5610-5612 Warwick Dr | 0.62mi | 4/2.0 | 2,160 (+9%) | 8mo | $265,000 | $123 | 49 |
| 6907 Gerald Ave | 0.71mi | 4/2.0 | 1,856 (-6%) | 17mo | $221,875 | $120 | 43 |
| 5711 Warwick Dr | 0.66mi | 4/2.0 | 2,160 (+9%) | 18mo | $250,000 | $116 | 39 |
Match score weights: distance 35% · size 25% · config 20% · recency 20%. Top-matched comps best support the ARV.
Projected returns pro-forma
-3.0% appreciation · 8.0% rent growth · sell at horizon
- IRR
- 0.2%
- Equity multiple
- 1.01×
- Total profit
- $597
- Equity at exit
- $38,394
- IRR
- 14.5%
- Equity multiple
- 2.45×
- Total profit
- $104,597
- Equity at exit
- $22,264
Cash invested: $72,100 (down + closing). Projections, not guarantees.
Landlord ↔ Tenant lean methodology
- Overall (STATE)
- 73 Landlord-Friendly
- State Ohio
- 73 Landlord-Friendly · R+6
- County
- — inherits STATE
- City
- — inherits STATE
ZIP-level market 44134
- Rents YoY
- 10.6%
- Active inventory
- 118
- Price-to-rent
- 15.0×
Monthly cashflow live
- Estimated rent
- $2,862 high interval (Pro) →
- Mortgage (P&I)
- −$1,350
- Tax from tax record
- −$378 /mo · $4,530/yr
- Insurance
- −$107
- HOA
- −$0
- Vacancy / Maint / Mgmt
- −$601
- Net cashflow
- $426
Break-even live
Sensitivity live
| Price | -10% $572 | -5% $499 | +0% $426 | +5% $353 | +10% $280 |
|---|---|---|---|---|---|
| Rent | -10% $200 | -5% $313 | +0% $426 | +5% $539 | +10% $652 |
| Rate | -1.0pp $555 | -0.5pp $491 | base $426 | +0.5pp $359 | +1.0pp $291 |
2-unit breakdown (identical units grouped — click to expand)
| Units | Beds | Baths | Est. rent |
|---|---|---|---|
| 2× units | 2 | 1 | $2,862 |
| #1 | 2 | 1 | $1,431 |
| #2 | 2 | 1 | $1,431 |
| Total (2 units) | $2,862 | ||
UW: 25.0% down · 7.5% · 30yr · 1.5% tax · 5.0% vac · 8.0% maint · 8.0% mgmt
Financing live
Cash to close
- Down payment
- $64,375
- Closing costs
- $7,725
- Reserves months
- —
- Total cash needed
- —
Loan-product check · same deal, 3 products live
Conventional
25% down · 7.5% · 30yr
- Down + closing
- —
- Monthly P&I
- —
- Monthly cashflow
- —
- DSCR
- —
- Eligible?
- —
Personal DTI + credit; lowest rate.
DSCR
20% down · 8.5% · 30yr
- Down + closing
- —
- Monthly P&I
- —
- Monthly cashflow
- —
- DSCR
- —
- Eligible?
- —
No personal income docs; deal must DSCR.
Hard money
10% down · 12.0% · 12mo
- Down + closing
- —
- Monthly P&I
- —
- Monthly cashflow
- —
- DSCR
- —
- Eligible?
- —
Short-term bridge; refi at stabilization.
Rent comps 15 comps
| Address | Beds | Baths | Sqft | Rent | $/sqft | DOM | Units | Dist |
|---|---|---|---|---|---|---|---|---|
| 6505 Snow Rd Unit REAR Parma, OH | 3.0 | 1.5 | 1312 | $1,599 | $1.22 | 8d | 1 | 0.54mi |
| 2915 Snow Rd Unit 2/UP Parma, OH | 3.0 | 1.5 | 2378 | $1,550 | $0.65 | 24d | 1 | 0.86mi |
| 7514 Bertha Ave Cleveland, OH | 5.0 | 2.0 | 1672 | $1,776 | $1.06 | 2d | 1 | 0.88mi |
| 5606 Theota Ave Cleveland, OH | 3.0 | 1.5 | 1676 | $1,400 | $0.84 | 8d | 1 | 0.89mi |
| 5606 Theota Ave Cleveland, OH | 3.0 | 1.5 | 1676 | $1,400 | $0.84 | 5d | 1 | 0.89mi |
| 4606 Lincoln Ave Cleveland, OH | 3.0 | 2.0 | 1418 | $1,995 | $1.41 | 2d | 1 | 0.90mi |
| 3330 Fortune Ave Cleveland, OH | 3.0 | 1.5 | 1258 | $1,775 | $1.41 | 44d | 1 | 0.96mi |
| 7906 Lanyard Dr Unit 1496071P Parma, OH | 4.0 | 1.5 | 1227 | $5,834 | $4.75 | 8d | 1 | 1.03mi |
| 4191 W Ridgewood Dr Unit 4193 Parma, OH | 4.0 | 3.0 | 1800 | $1,950 | $1.08 | 44d | 1 | 1.10mi |
| 4407 Woodway Ave Cleveland, OH | 3.0 | 2.0 | 1728 | $1,750 | $1.01 | 24d | 1 | 1.11mi |
| 6511 Luelda Ave Unit Na Parma, OH | 3.0 | 2.0 | 1577 | $1,975 | $1.25 | 44d | 1 | 1.14mi |
| 6007 Merkle Ave Unit Down Parma, OH | 3.0 | 1.0 | 1250 | $1,399 | $1.12 | 2d | 1 | 1.20mi |
| 5080 Whispering Oaks BLVD Parma, OH | 3.0 | 2.0 | 1332 | $1,799 | $1.35 | 13d | 1 | 1.34mi |
| 8326 Fernhill Ave Cleveland, OH | 3.0 | 1.0 | 1350 | $1,700 | $1.26 | 44d | 1 | 1.42mi |
| 5939 Pearl Rd Cleveland, OH | 4.0 | 2.0 | 2000 | $2,499 | $1.25 | 2d | 1 | 1.50mi |
Listing history 5 events
-
2026-04-26status Pending
-
2026-04-26historical Contingent
-
2026-04-21status Pending
-
2026-04-17$257,500 Active
-
1990-07-26soldstatus $101,000
ⓘ Source: listings_history table (triggers on properties + properties_extension) + one-shot
backfill from property_details.listing_events for pre-trigger history.
Tax reassessment forecast OH · Partial reset (capped growth)
- Current annual tax
- $4,530 · $378/mo
- Projected year-2 tax
- $4,530 · $378/mo
- Expected delta
- $0/yr ($0/mo · 0.0%)
ⓘ Screening estimate from a state-policy table — verify with the county assessor before closing.
Climate risk First Street
- Flood 3/10 Moderate FEMA zone X (unshaded) · 10% chance over 30 yrs
- Wildfire 2/10 Low
- Heat 3/10 Moderate 7 d/yr ≥95°F today · 17 d/yr by 30 yrs out
- Wind 1/10 Low
- Air quality 3/10 Moderate 2 unhealthy d/yr today · 4 by 30 yrs out
Nearby sold comps map
Loading sold comps map…
Walkable amenities ~0.75 mi
Loading nearby amenities…
Taxation est. · year 1
- Rental income
- $34,344
- − Mortgage interest
- −$14,424
- − Property taxes
- −$4,530
- − Insurance
- −$1,288
- − Repairs & maintenance
- −$2,748
- − Management
- −$2,748
- − Depreciation
- −$7,491
- Taxable income
- $1,116
- Est. tax owed @ 24.0%
- −$268
- After-tax cash flow
- $4,842/yr
For passive investors: Depreciation is non-cash, so a rental often shows a tax loss while cash-flowing — sheltering income. Rental losses are passive: they offset passive income freely, and up to $25,000/yr can offset ordinary (W-2) income if you actively participate and your MAGI is under $100k (phasing out to $0 by $150k); unused losses carry forward. On sale, claimed depreciation is recaptured at up to 25%, and gains may owe capital-gains tax (a 1031 exchange can defer both). Figures are a year-1 estimate at your 24.0% rate — not tax advice; consult a CPA.
Schools (NCES district)
- District
- Parma City
- NCES district ID
- 3904463
- Math proficiency
- 43% ▼ -18.00%
- Reading proficiency
- 52% ▼ -10.00%
- Median HH income
- $50,371
- Composite
- 40.72/100
- National rank
- #3662
- State rank
- #469 of 656 in OH
Livability — Parma
- Score
- 82/100
- State rank
- #84
- US rank
- #1232
Category grades
Schools grade is shown separately in the Schools card above.
Census & demographics
- Census place
- Parma, OH
- County
- Cuyahoga County · 1,090,369 people
- City population
- 66,574
- Metro
- Cleveland-Elyria, OH
- Population (ZIP)
- 37,774
- Household income
- $68,625
- Rent vs Own
- Severe rent burden
- 668.0
Population outlook (Cuyahoga County) Hauer SSP2
- Today (2025)
- 1,244,621 people
- By 2030
- 1,230,093 · -1.2%
- By 2040
- 1,189,108 · -4.5%
- By 2050
- 1,145,706 · -7.9%
- By 2075
- 1,076,557 · -13.5%
- By 2100
- 978,987 · -21.3%
Race, ethnicity, and origin ACS 2023
- Neighborhood character
- Predominantly White (85%)
- Race & ethnicity
- White 85% Two or more races 6% Hispanic / Latino 5% Black 3% Asian 3%
- Common ancestry
- Romanian 14% Subsaharan African 6% Slovak 1%
- Foreign-born
- 11% · Canada, Vietnam
- Languages at home
- 84% English-only · Russian/Polish/Slavic 7% Spanish 3% Other Indo-European 2%
Political lean MEDSL · Cuyahoga
- 2024 margin
- Solid D (+31.5) · D 65.4% · R 33.9%
- 2008→2024 swing
- -7.4pp toward R · 2008: 38.9pp · 2024: 31.5pp
- All cycles
- 2024: D+31.5 2020: D+34.1 2016: D+35.0 2012: D+38.7 2008: D+38.9
Not yet ingested
- Civics
- —
Market trends
- HPI YoY
- ▼ -215.17%
- Current HPI
- 184.0553
- Rent YoY
- ▲ 10.56%
- Metro
- Cleveland-Elyria, OH
- State GDP YoY
- ▲ 1.98%
- F500 in state
- 48
Industry mix (Fortune 500 HQ in OH)
| Industry | F500 HQs | Revenue |
|---|---|---|
| Insurance | 3 | $145B |
|
||
| Industrial Machinery | 3 | $49B |
|
||
| Financial Services | 3 | $24B |
|
||
| Consumer Goods | 2 | $93B |
|
||
| Aerospace / Defense | 2 | $47B |
|
||
| Utilities | 2 | $33B |
|
||
Price history
+155.0% since first listed5 events — show timeline
- 2026-04-26 Pending — MLSNOW
- 2026-04-26 Contingent — MLSNOW
- 2026-04-21 Pending — MLSNOW
- 2026-04-17 Listed $257,500 MLSNOW
- 1990-07-26 Sold (Public Records) $101,000 Public Records
Property tax history
+3.6%/yrLatest (2025): $4,530 · -4.8% YoY. Source: county tax records.
Cash-flow waterfall
monthlySold comps — $/sqft
last 12 mo · ≤1 miLoading sold comps…