 🌊 Lakefront
17320 Palm Dr · Montverde, FL
Flood risk 7/10 · Major
- FEMA flood zone
- X (unshaded)
- Chance of flooding over 30 yrs
- 0.99%
- Est. flood insurance / yr
- $507 – $1,088
Fire risk 3/10 · Minor
- Est. fire insurance / yr
- $947 – $1,759
Heat risk 8/10 · Major
- Hot days now (above 108°F)
- 7 days/yr
- Hot days in 30 yrs
- 23 days/yr
Wind risk 9/10 · Severe
- Chance of severe wind over 30 yrs
- 99.0%
Air-quality risk 1/10 · Minimal
- Unhealthy air days now
- 0 days/yr
- Unhealthy air days in 30 yrs
- 0 days/yr
Risk factors via First Street. Map © Google.
Why this score? — see what drove the C+ grade
The composite is a weighted blend of 9 inputs, each scored 0–100. Each bar is that input's sub-score; the figure is the points it added to the 100-point composite (weight × sub-score).
- Cash flow +26.7/30.0
- DSCR +9.2/10.0
- ARV discount +7.5/15.0
- 1% rule +6.8/10.0
- Schools +4.2/10.0
- Livability +3.3/5.0
- Rent growth +2.5/5.0
- Condition / age +2.5/5.0
- Appreciation +2.3/10.0
$216,500
🖨 Deal sheet 📄 Offer letter ✓ Due diligence
Listing remarks
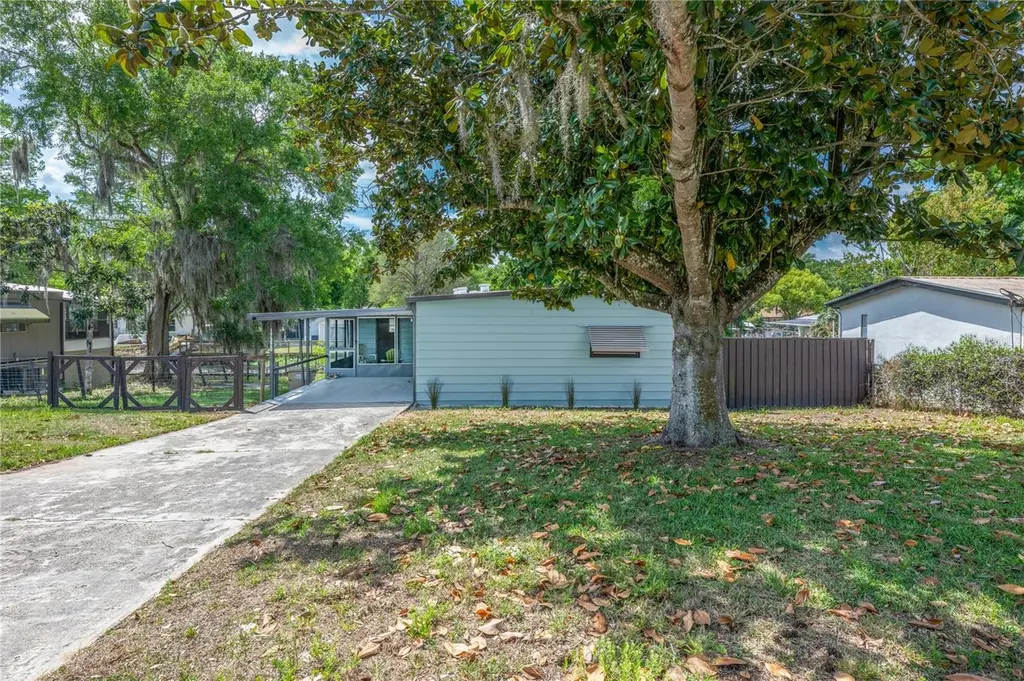
Stunning Lakefront Living in Charming Montverde Welcome to this beautifully maintained home nestled in the heart of Montverde, where small-town charm meets breathtaking lakefront living. This inviting property features a bright, open floor plan filled with abundant natural light, creating a warm and welcoming atmosphere throughout. Enjoy spacious living areas, a well-appointed kitchen perfect for everyday living or entertaining, and generously sized bedrooms designed for comfort. Step outside to your private backyard oasis, where you’ll find stunning water views and direct access to Lake Apopka—ideal for relaxing evenings, entertaining guests, or soaking in unforgettable sunset
Key facts
- Lake views
- Private backyard
- 8,296 sq ft lot
Tags
Property features AI
Finance
- Other: Unfurnished; Accessible stairway; Zoned RM; Total acreage: under 1/4 acre
- HOA & community: No community association
Exterior
- Parking: Driveway (ground level); 1-car carport
- Security: Smoke detector(s)
- Utilities: Private water; Private sewer; Cable available; Electricity connected; Water connected
- Home design: Residential modular home; Double wide; One story; North-facing
- Construction: Metal frame and frame construction; Other roof
- Exterior features: Front porch, rear porch and screened porch; Awning(s); Shade shutters; Sliding doors; Storage; Wire and wood fencing; Mature landscaping; Paved lot; Asphalt road frontage; Canal view and canal access to Lake Apopka; Seawall (other)
Interior
- Kitchen: Convection oven; Cooktop; Range; Range hood; Dishwasher; Refrigerator
- Bedrooms: 2 bedrooms
- Flooring: Ceramic tile; Slab foundation
- Bathrooms: 2 full bathrooms
- Heating & cooling: Central heating; Central air conditioning
- Interior features: Thermostat; Walk-in closet(s); Drapes and rods; Smoke detector(s)
- Laundry & utility: Laundry room with washer and electric dryer hookups
Neighborhood map
What this means for you Summary
Snapshot
- This is a 2-bed/2.0-bath manufactured listed at $216k.
Deal economics
- At list price, monthly cash flow is $523 ($6k/yr) — positive.
- The deal already cash-flows at list — no discount required.
- Meets the 1% rule at list price ($3k rent vs $216k).
- Recommended offer: $204k (6.0% below list) — sets the bar for market timing.
- Cap rate 9.6% vs local median 2.2% in Montverde — top-decile yield for the area; either an underpriced asset or a hidden risk that comps aren't pricing in. Stress-test before assuming the spread holds.
Location & tenants
- Location reads 66/100 on livability (#598 in FL) — a middle-class / working-renter tenant base. Strengths: crime A+, employment A+, housing A+; Watch: cost of living D, amenities F, commute F.
- Lake (suburban): math 49% / reading 50% proficiency, ranked #37 of 73 in FL (top 51%) — families likely to look elsewhere, expect single-tenant / working-renter base with shorter leases.
- Zoned schools: Grassy Lake Elementary School (math 58% / reading 63%, grade B-, #664 of 2,144 statewide, top 32%, 1,209 students, 29% FRL); Lake Minneola High School (math 44% / reading 57%, grade D+, #171 of 667 statewide, top 26%, 2,176 students, 28% FRL) — zoned schools average 29% FRL vs 49% district-wide (20 pts lower); this property's tenant base skews higher-income than the district average.
- Market conditions: 199 active listings in the ZIP; solid renter incomes; 4,799 units permitted in Lake County in 2024 (814 in 5+ unit buildings).
Forward outlook
- Local home prices are declining (-3.0%/yr); year-one equity from $1k of loan paydown is wiped out by about $6k of value loss. Plan a longer hold.
- Lake County population projected at +37% by 2050 — long-run rental-demand tailwind backs the buy-and-hold thesis.
Negotiation context
- It's been on market 77 days — a 6% lower offer ($204k) is reasonable based on typical stale-listing flexibility.
- 2 sale attempts since 22y ago with the ask held roughly flat each time — persistent listings suggest the price (not the market) is what's stuck; bring a comps-based counter.
- Current owner paid $60k; list at $216k implies a 261% gain — meaningful room to come down on a strong offer.
Risks & watch-outs
- Watch-outs: flood insurance adds $66/mo.
- Climate carrying-cost: major flood risk; severe wind risk, 99% chance of damaging wind over 30y; extreme-heat days projected 7→23/yr by 2055 (HVAC capex compounding) — expect insurance premiums to compound above CPI over the hold.
Questions for the listing agent
- It's been on market 77 days. Have you received any prior offers? Is the seller open to a 6% concession, seller financing, or rate buy-down credit?
- Built in 1977 — when were the roof, HVAC, electrical panel, plumbing, and water heater last replaced?
- What's the actual annual flood-insurance premium (NFIP or private), and is the property in a SFHA with mandatory coverage?
- Why hasn't it sold? Are there any deal-killer items the seller is aware of (foundation, flood, title, zoning, code violations)?
- Is there a deadline driving the sale (1031 exchange, divorce, estate, relocation)? That informs how much negotiation room exists.
- This sits on a lake — are riparian / water-frontage rights deeded with the parcel? Any dock permits, shoreline easements, or HOA water-use restrictions?
- What's the documented flood / surge / shoreline-erosion history here (FEMA AND non-FEMA — e.g., storm surge, creek backup, septic-field saturation)?
- Any water-quality or seasonal algae-bloom issues that affect tenant satisfaction or short-term-rental demand?
- What's the average days-on-market for RENTAL listings here right now (not sales)? A rising rental-DOM trend means longer vacancies and softer asking-rent achievability than the comps imply.
- What's the recent tenant-quality profile in this submarket — average credit score on applications, eviction rate, late-payment / NSF rate, and stable-employment percentage? A property-management company in the area should have these aggregated.
- How much new for-sale + rental construction is in the pipeline within 1–3 miles? Heavy new supply typically softens prices + rents 12–24 months out; constrained supply supports both.
Investment metrics
- 1% rule
- 1.18% ✓
- Cap rate
- 9.56%
- Cash-on-cash
- 11.66%
- DSCR
- 1.52
- GRM
- 7.1
CMA / ARV
- ARV (on-the-fly)
- $135,360
- Comps found
- 3
Show comp detail 3 sales within ~0.75 mi
| Address | Dist | Beds/Ba | Sqft | Sold | Price | $/sf | Match |
|---|---|---|---|---|---|---|---|
| 17142 Live Oak Ln | 0.13mi | 2/2.0 | 960 (0%) | 2mo | $135,000 | $141 | 92 |
| 17125 Bay Ave | 0.11mi | 2/2.0 | 960 (0%) | 14mo | $130,000 | $135 | 84 |
| 17513 Palm Dr | 0.14mi | 3/2.0 (+1) | 1,056 (+10%) | 12mo | $193,500 | $183 | 62 |
Match score weights: distance 35% · size 25% · config 20% · recency 20%. Top-matched comps best support the ARV.
Projected returns pro-forma
-3.0% appreciation · 3.0% rent growth · sell at horizon
- IRR
- -0.8%
- Equity multiple
- 0.97×
- Total profit
- $-1,761
- Equity at exit
- $32,281
- IRR
- 8.9%
- Equity multiple
- 1.68×
- Total profit
- $41,467
- Equity at exit
- $18,719
Cash invested: $60,620 (down + closing). Projections, not guarantees.
Landlord ↔ Tenant lean methodology
- Overall (STATE)
- 87 Strongly Landlord-Friendly
- State Florida
- 87 Strongly Landlord-Friendly · R+3
- County
- — inherits STATE
- City
- — inherits STATE
ZIP-level market 34756
- Home prices YoY
- -1.3%
- Active inventory
- 199
- Price-to-rent
- 7.1×
Monthly cashflow live
- Estimated rent
- $2,546 medium interval (Pro) →
- Mortgage (P&I)
- −$1,135
- Tax from tax record
- −$197 /mo · $2,361/yr
- Insurance
- −$90
- Flood insurance flood zone
- −$66 /mo · $798/yr
- HOA
- −$0
- Vacancy / Maint / Mgmt
- −$535
- Net cashflow
- $523
Break-even live
UW: 25.0% down · 7.5% · 30yr · 1.5% tax · 5.0% vac · 8.0% maint · 8.0% mgmt
Financing live
Cash to close
- Down payment
- $54,125
- Closing costs
- $6,495
- Reserves months
- —
- Total cash needed
- —
Loan-product check · same deal, 3 products live
Conventional
25% down · 7.5% · 30yr
- Down + closing
- —
- Monthly P&I
- —
- Monthly cashflow
- —
- DSCR
- —
- Eligible?
- —
Personal DTI + credit; lowest rate.
DSCR
20% down · 8.5% · 30yr
- Down + closing
- —
- Monthly P&I
- —
- Monthly cashflow
- —
- DSCR
- —
- Eligible?
- —
No personal income docs; deal must DSCR.
Hard money
10% down · 12.0% · 12mo
- Down + closing
- —
- Monthly P&I
- —
- Monthly cashflow
- —
- DSCR
- —
- Eligible?
- —
Short-term bridge; refi at stabilization.
Listing history 19 events
-
2026-06-18days on market $216,500 Active 77 DOM
-
2026-06-17days on market $216,500 Active 76 DOM
-
2026-06-16days on market $216,500 Active 75 DOM
-
2026-06-15days on market $216,500 Active 74 DOM
-
2026-06-13days on market $216,500 Active 72 DOM
-
2026-06-09days on market $216,500 Active 68 DOM
-
2026-06-08days on market $216,500 Active 67 DOM
-
2026-06-07days on market $216,500 Active 66 DOM
-
2026-06-04days on market $216,500 Active 63 DOM
-
2026-06-03days on market $216,500 Active 62 DOM
-
2026-06-02days on market $216,500 Active 61 DOM
-
2026-06-01days on market $216,500 Active 60 DOM
-
2026-05-31days on market $216,500 Active 59 DOM
-
2026-04-02$216,500 Active
-
2018-06-15soldstatus $60,000
-
2004-10-18historical
-
2004-04-05$65,000
-
1999-09-08soldstatus $58,000
-
1985-11-01soldstatus $45,000
ⓘ Source: listings_history table (triggers on properties + properties_extension) + one-shot
backfill from property_details.listing_events for pre-trigger history.
Tax reassessment forecast FL · Resets to sale price
- Current annual tax
- $2,361 · $197/mo
- Projected year-2 tax
- $2,361 · $197/mo
- Expected delta
- $0/yr ($0/mo · 0.0%)
ⓘ Screening estimate from a state-policy table — verify with the county assessor before closing.
Climate risk First Street
- Flood 7/10 Severe FEMA zone X (unshaded) · 99% chance over 30 yrs
- Wildfire 3/10 Moderate
- Heat 8/10 Severe 7 d/yr ≥108°F today · 23 d/yr by 30 yrs out
- Wind 9/10 Extreme 99% chance of damaging wind over 30 yrs
- Air quality 1/10 Low 0 unhealthy d/yr today · 0 by 30 yrs out
Nearby sold comps map
Loading sold comps map…
Walkable amenities ~0.75 mi
Loading nearby amenities…
Taxation est. · year 1
- Rental income
- $30,553
- − Mortgage interest
- −$12,127
- − Property taxes
- −$2,361
- − Insurance
- −$1,880
- − Repairs & maintenance
- −$2,444
- − Management
- −$2,444
- − Depreciation
- −$6,298
- Taxable income
- $2,998
- Est. tax owed @ 24.0%
- −$720
- After-tax cash flow
- $5,552/yr
For passive investors: Depreciation is non-cash, so a rental often shows a tax loss while cash-flowing — sheltering income. Rental losses are passive: they offset passive income freely, and up to $25,000/yr can offset ordinary (W-2) income if you actively participate and your MAGI is under $100k (phasing out to $0 by $150k); unused losses carry forward. On sale, claimed depreciation is recaptured at up to 25%, and gains may owe capital-gains tax (a 1031 exchange can defer both). Figures are a year-1 estimate at your 24.0% rate — not tax advice; consult a CPA.
Schools (NCES district)
- District
- Lake
- NCES district ID
- 1201050
- Math proficiency
- 49% ▼ -7.00%
- Reading proficiency
- 50% ▼ -4.00%
- Median HH income
- $46,632
- Composite
- 42.05/100
- National rank
- #3327
- State rank
- #37 of 73 in FL
Livability — Montverde
- Score
- 66/100
- State rank
- #598
- US rank
- #11453
Category grades
Schools grade is shown separately in the Schools card above.
Census & demographics
- County
- Lake County · 364,602 people
- City population
- 4,876
- Metro
- Orlando-Kissimmee-Sanford, FL
- Population (ZIP)
- 4,876
- Household income
- $108,500
- Rent vs Own
- Severe rent burden
- 24.0
Population outlook (Lake County) Hauer SSP2
- Today (2025)
- 386,640 people
- By 2030
- 417,107 · +7.9%
- By 2040
- 476,676 · +23.3%
- By 2050
- 531,296 · +37.4%
- By 2075
- 648,303 · +67.7%
- By 2100
- 698,530 · +80.7%
Race, ethnicity, and origin ACS 2023
- Neighborhood character
- Predominantly White (74%)
- Race & ethnicity
- White 74% Hispanic / Latino 17% Two or more races 6% Black 5%
- Hispanic origin (detail)
- Mexican 6% Puerto Rican 4% Cuban 6%
- Common ancestry
- Romanian 4% Italian 2% Lithuanian 1%
- Foreign-born
- 6% · Canada, Mexico, Jamaica
- Languages at home
- 84% English-only · Spanish 14% Arabic 2% Other Indo-European 1%
Political lean MEDSL · Lake
- 2024 margin
- Strong R (+24.7) · D 37.3% · R 62.0%
- 2008→2024 swing
- -11.2pp toward R · 2008: -13.5pp · 2024: -24.7pp
- All cycles
- 2024: R+24.7 2020: R+20.0 2016: R+23.1 2012: R+17.1 2008: R+13.5
Not yet ingested
- Civics
- —
Market trends
- HPI YoY
- ▼ -5.42%
- Current HPI
- 410.9213
- Rent YoY
- —
- Metro
- Orlando-Kissimmee-Sanford, FL
- State GDP YoY
- ▲ 3.28%
- F500 in state
- 36
Industry mix (Fortune 500 HQ in FL)
| Industry | F500 HQs | Revenue |
|---|---|---|
| Industrial Technology | 2 | $29B |
|
||
| Insurance | 2 | $17B |
|
||
| Retail | 1 | $60B |
|
||
| Technology Distribution | 1 | $58B |
|
||
| Homebuilding | 1 | $35B |
|
||
| Technology Manufacturing | 1 | $35B |
|
||
Price history
+381.1% since first listed6 events — show timeline
- 2026-04-02 Listed $216,500 Stellar MLS as Distributed by MLS Grid
- 2018-06-15 Sold (Public Records) $60,000 Public Records
- 2004-10-18 Listing Removed — Stellar MLS as Distributed by MLS Grid
- 2004-04-05 Listed $65,000 Stellar MLS as Distributed by MLS Grid
- 1999-09-08 Sold (Public Records) $58,000 Public Records
- 1985-11-01 Sold (Public Records) $45,000 Public Records
Property tax history
+9.9%/yrLatest (2025): $2,361 · +17.5% YoY. Source: county tax records.
Cash-flow waterfall
monthlySold comps — $/sqft
last 12 mo · ≤1 miLoading sold comps…