103 Saxony C · Delray Beach, FL
Flood risk 1/10 · Minimal
- FEMA flood zone
- X (unshaded)
- Chance of flooding over 30 yrs
- 0.0%
- Est. flood insurance / yr
- $507 – $1,088
Fire risk 1/10 · Minimal
- Est. fire insurance / yr
- $947 – $1,759
Heat risk 8/10 · Major
- Hot days now (above 107°F)
- 2 days/yr
- Hot days in 30 yrs
- 8 days/yr
Wind risk 10/10 · Severe
- Chance of severe wind over 30 yrs
- 99.0%
Air-quality risk 2/10 · Minimal
- Unhealthy air days now
- 2 days/yr
- Unhealthy air days in 30 yrs
- 2 days/yr
Risk factors via First Street. Map © Google.
Why this score? — see what drove the C+ grade
The composite is a weighted blend of 9 inputs, each scored 0–100. Each bar is that input's sub-score; the figure is the points it added to the 100-point composite (weight × sub-score).
- Cash flow +21.3/30.0
- 1% rule +10.0/10.0
- ARV discount +7.5/15.0
- DSCR +6.8/10.0
- Appreciation +5.3/10.0
- Schools +4.3/10.0
- Livability +3.9/5.0
- Rent growth +2.6/5.0
- Condition / age +2.5/5.0
$95,000
🖨 Deal sheet 📄 Offer letter ✓ Due diligence
Listing remarks
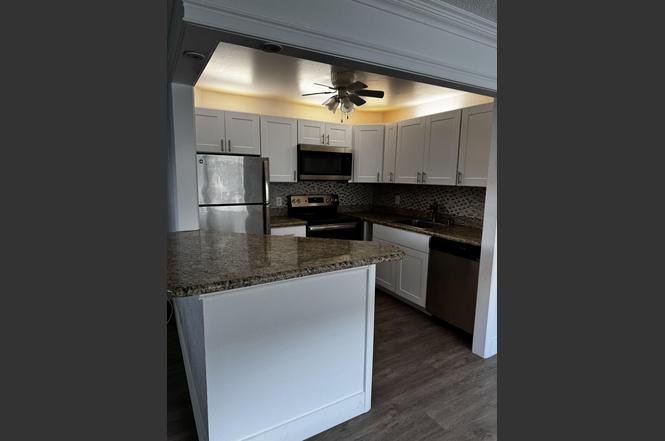
Don't miss out on the completely remodeled first floor unit. New floors throughout. Washer and dryer in the unit.
Key facts
- New floors
- $689 HOA
- Community pool
Tags
Property features AI
Finance
- Other: Living area reported as approximately 720–828 (sources vary)
- Financial info: Pets not allowed
- HOA & community: Association with monthly HOA dues; HOA includes common areas; Community amenities: Clubhouse, Fitness Center, Golf Course, Game Room, Pool, Tennis Courts, Community Room, Courtesy Bus, Library; Senior community
Exterior
- Parking: Assigned parking
- Security: Gated community with guard
- Utilities: Public water; Three-phase electric; Cable available; Water service available
- Home design: Condominium; 2 stories; Faces south; Resale condition
- Construction: Concrete construction
- Exterior features: Patio; Not waterfront
Interior
- Kitchen: Dishwasher; Refrigerator
- Bedrooms: 1 bedroom on the main level
- Flooring: Laminate flooring
- Bathrooms: 1 full bathroom; 1 half bathroom
- Heating & cooling: Central heating; Central air conditioning
- Interior features: No special interior features listed
- Laundry & utility: Laundry inside the unit
Neighborhood map
What this means for you Summary
Snapshot
- This is a 1-bed/1.5-bath condo listed at $95k.
Deal economics
- At list price, monthly cash flow is $139 ($2k/yr) — positive.
- The deal already cash-flows at list — no discount required.
- Meets the 1% rule at list price ($2k rent vs $95k).
- Recommended offer: $86k (9.0% below list) — sets the bar for market timing.
- Cap rate 8.1% vs local median 4.3% in Delray Beach — top-decile yield for the area; either an underpriced asset or a hidden risk that comps aren't pricing in. Stress-test before assuming the spread holds.
Location & tenants
- Location reads 77/100 on livability (#202 in FL, #3,160 nationally) — a middle-class / working-renter tenant base. Strengths: housing A+, health & safety A+, commute A-; Watch: cost of living C-, crime D-, amenities F.
- Palm Beach (suburban): math 46% / reading 53% proficiency, ranked #34 of 73 in FL (top 47%) — families likely to look elsewhere, expect single-tenant / working-renter base with shorter leases.
- Zoned schools: Orchard View Elementary School (math 48% / reading 47%, grade D, #1,182 of 2,144 statewide, top 55%, 596 students, 76% FRL); Spanish River Community High School (math 64% / reading 74%, grade B, #63 of 667 statewide, top 10%, 2,578 students, 25% FRL) — zoned schools at 50% FRL track the district average.
- Market conditions: Rents flat; 577 active listings in the ZIP; 40 comparable units currently listed for rent nearby; rentals at typical pace (median 25d on market — plan ~3-4 weeks tenant-placement turnaround); solid renter incomes; 3,974 units permitted in Palm Beach County in 2024 (1,012 in 5+ unit buildings).
Forward outlook
- In year one you build about $1k of equity ($657 loan paydown + $652 appreciation (0.7% local appreciation)).
- Palm Beach County population projected at +30% by 2050 — long-run rental-demand tailwind backs the buy-and-hold thesis.
Negotiation context
- It's been on market 105 days — a 9% lower offer ($86k) is reasonable based on typical stale-listing flexibility.
- 8 sale attempts since 21y ago; this cycle's ask is 5838% above the opening price — seller raised mid-cycle; expect resistance to lowballs.
- Current owner paid $80k; 19% above their basis — modest negotiation headroom, anchor on the comps not their cost.
Risks & watch-outs
- Watch-outs: HOA is 37% of rent.
- Climate carrying-cost: severe wind risk, 99% chance of damaging wind over 30y; extreme-heat days projected 2→8/yr by 2055 (HVAC capex compounding) — expect insurance premiums to compound above CPI over the hold.
Questions for the listing agent
- It's been on market 105 days. Have you received any prior offers? Is the seller open to a 9% concession, seller financing, or rate buy-down credit?
- Built in 1974 — when were the roof, HVAC, electrical panel, plumbing, and water heater last replaced?
- What does the HOA fee cover, when was the last increase, and are there any pending special assessments or reserve-fund shortfalls?
- Any open or pending special assessments — roof, HVAC, plumbing, elevator, façade? What's the per-unit balance and payoff schedule, and is the seller paying it off at close or rolling it to the buyer?
- Why hasn't it sold? Are there any deal-killer items the seller is aware of (foundation, flood, title, zoning, code violations)?
- Is there a deadline driving the sale (1031 exchange, divorce, estate, relocation)? That informs how much negotiation room exists.
- Schools are B-rated — typically a magnet for longer-tenancy family renters. What's the average tenant stay here, and is there a school-zone premium baked into asking?
- Crime grade is D in this area — have there been break-ins, vandalism, or insurance claims at this property in the last 3 years? What carrier currently insures it and at what premium?
- What's the average days-on-market for RENTAL listings here right now (not sales)? A rising rental-DOM trend means longer vacancies and softer asking-rent achievability than the comps imply.
- What's the recent tenant-quality profile in this submarket — average credit score on applications, eviction rate, late-payment / NSF rate, and stable-employment percentage? A property-management company in the area should have these aggregated.
- How much new apartment / multifamily construction is in the pipeline within 1–3 miles? Heavy new supply (>2% of stock underway) typically softens rents 12–24 months out; light construction supports rent growth.
Investment metrics
- 1% rule
- 1.94% ✓
- Cap rate
- 8.05%
- Cash-on-cash
- 6.29%
- DSCR
- 1.28
- GRM
- 4.3
CMA / ARV
No comps found within radius.
Projected returns pro-forma
0.69% appreciation · 0.51% rent growth · sell at horizon
- IRR
- 4.0%
- Equity multiple
- 1.19×
- Total profit
- $5,142
- Equity at exit
- $30,892
- IRR
- 5.8%
- Equity multiple
- 1.61×
- Total profit
- $16,186
- Equity at exit
- $39,889
Cash invested: $26,600 (down + closing). Projections, not guarantees.
Landlord ↔ Tenant lean methodology
- Overall (STATE)
- 87 Strongly Landlord-Friendly
- State Florida
- 87 Strongly Landlord-Friendly · R+3
- County
- — inherits STATE
- City
- — inherits STATE
ZIP-level market 33446
- Home prices YoY
- 0.3%
- Rents YoY
- 0.5%
- Active inventory
- 577
- Price-to-rent
- 4.3×
Monthly cashflow live
- Estimated rent
- $1,840 high interval (Pro) →
- Mortgage (P&I)
- −$498
- Tax from tax record
- −$88 /mo · $1,051/yr
- Insurance
- −$40
- HOA
- −$689
- Vacancy / Maint / Mgmt
- −$386
- Net cashflow
- $139
Break-even live
UW: 25.0% down · 7.5% · 30yr · 1.5% tax · 5.0% vac · 8.0% maint · 8.0% mgmt
Financing live
Cash to close
- Down payment
- $23,750
- Closing costs
- $2,850
- Reserves months
- —
- Total cash needed
- —
Loan-product check · same deal, 3 products live
Conventional
25% down · 7.5% · 30yr
- Down + closing
- —
- Monthly P&I
- —
- Monthly cashflow
- —
- DSCR
- —
- Eligible?
- —
Personal DTI + credit; lowest rate.
DSCR
20% down · 8.5% · 30yr
- Down + closing
- —
- Monthly P&I
- —
- Monthly cashflow
- —
- DSCR
- —
- Eligible?
- —
No personal income docs; deal must DSCR.
Hard money
10% down · 12.0% · 12mo
- Down + closing
- —
- Monthly P&I
- —
- Monthly cashflow
- —
- DSCR
- —
- Eligible?
- —
Short-term bridge; refi at stabilization.
Rent comps 40 comps
| Address | Beds | Baths | Sqft | Rent | $/sqft | DOM | Units | Dist |
|---|---|---|---|---|---|---|---|---|
| 52 Saxony Cir Unit 52 Delray Beach, FL | 2.0 | 2.0 | 1027 | $3,200 | $3.12 | 24d | 1 | 0.02mi |
| 99 Saxony C Delray Beach, FL | 1.0 | 1.5 | 720 | $2,500 | $3.47 | 24d | 1 | 0.03mi |
| 23 Flanders a Delray Beach, FL | 1.0 | 1.5 | 760 | $1,500 | $1.97 | 24d | 1 | 0.05mi |
| 151 Saxony D Delray Beach, FL | 1.0 | 1.5 | 726 | $1,500 | $2.07 | 12d | 1 | 0.06mi |
| 29 Flanders a Delray Beach, FL | 2.0 | 2.0 | 760 | $1,900 | $2.50 | 24d | 1 | 0.10mi |
| 211 Saxony Ln #211 Delray Beach, FL | 1.0 | 1.5 | 720 | $1,400 | $1.94 | 8d | 1 | 0.11mi |
| 127 Flanders C Delray Beach, FL | 1.0 | 1.5 | 760 | $1,550 | $2.04 | 24d | 1 | 0.17mi |
| 321 Saxony G Delray Beach, FL | 2.0 | 2.0 | 880 | $2,200 | $2.50 | 4d | 1 | 0.18mi |
| 669 Monaco N Delray Beach, FL | 2.0 | 2.0 | 880 | $1,700 | $1.93 | 24d | 1 | 0.18mi |
| 352 Saxony Trl Unit 352 Delray Beach, FL | 2.0 | 2.0 | 907 | $2,000 | $2.21 | 24d | 1 | 0.19mi |
| 492 Piedmont Ct Delray Beach, FL | 2.0 | 2.0 | 1040 | $2,200 | $2.12 | 24d | 1 | 0.19mi |
| 370 Saxony H Delray Beach, FL | 1.0 | 1.5 | 726 | $1,500 | $2.07 | 5d | 1 | 0.20mi |
| 514 Piedmont K Delray Beach, FL | 1.0 | 1.5 | 792 | $1,690 | $2.13 | 24d | 1 | 0.21mi |
| 514 Piedmont K Unit k Delray Beach, FL | 1.0 | 1.5 | 792 | $1,690 | $2.13 | 3d | 1 | 0.21mi |
| 189 Saxony Trl Unit 189 Delray Beach, FL | 2.0 | 2.0 | 880 | $1,475 | $1.68 | 22d | 1 | 0.22mi |
| 594 Saxony Trl Unit 594 Delray Beach, FL | 1.0 | 1.5 | 720 | $1,650 | $2.29 | 24d | 1 | 0.22mi |
| 516 Saxony K Delray Beach, FL | 2.0 | 2.0 | 880 | $1,450 | $1.65 | 24d | 1 | 0.22mi |
| 23 Saxony a Delray Beach, FL | 1.0 | 1.5 | 726 | $1,300 | $1.79 | 8d | 1 | 0.22mi |
| 594 Saxony Trl Unit 594 Delray Beach, FL | 1.0 | 1.5 | 720 | $1,550 | $2.15 | 2d | 1 | 0.22mi |
| 123 Saxony C Delray Beach, FL | 1.0 | 1.5 | 720 | $2,500 | $3.47 | 24d | 1 | 0.22mi |
| 445 Saxony Way #445 Delray Beach, FL | 2.0 | 2.0 | 883 | $1,550 | $1.76 | 24d | 1 | 0.22mi |
| 564 Saxony Dr #564 Delray Beach, FL | 2.0 | 2.0 | 880 | $2,200 | $2.50 | 5d | 1 | 0.22mi |
| 662 Saxony N Delray Beach, FL | 1.0 | 1.5 | 720 | $1,450 | $2.01 | 21d | 1 | 0.22mi |
| 569 Monaco L Delray Beach, FL | 2.0 | 2.0 | 880 | $1,500 | $1.70 | 24d | 1 | 0.24mi |
| 344 Piedmont Trl Delray Beach, FL | 2.0 | 2.0 | 910 | $1,600 | $1.76 | 24d | 1 | 0.25mi |
| 370 Piedmont H Delray Beach, FL | 1.0 | 1.5 | 760 | $1,600 | $2.11 | 24d | 1 | 0.26mi |
| 401 Monaco Way Unit 401 Delray Beach, FL | 2.0 | 2.0 | 920 | $1,950 | $2.12 | 24d | 1 | 0.26mi |
| 370 Piedmont Trl Unit 370 Delray Beach, FL | 1.0 | 2.0 | 760 | $1,700 | $2.24 | 24d | 1 | 0.26mi |
| 679 Saxony Way Delray Beach, FL | 1.0 | 1.5 | 720 | $1,600 | $2.22 | 5d | 1 | 0.26mi |
| 368 Piedmont H Unit H Delray Beach, FL | 2.0 | 2.0 | 910 | $1,850 | $2.03 | 24d | 1 | 0.27mi |
| 482 Monaco Blvd #482 Delray Beach, FL | 1.0 | 1.5 | 726 | $1,400 | $1.93 | 24d | 1 | 0.27mi |
| 399 Brittany I Delray Beach, FL | 1.0 | 1.5 | 720 | $1,450 | $2.01 | 19d | 1 | 0.27mi |
| 399 Brittany I Delray Beach, FL | 1.0 | 1.5 | 720 | $1,450 | $2.01 | 13d | 1 | 0.27mi |
| 451 Monaco Blvd Unit J Delray Beach, FL | 1.0 | 1.5 | 720 | $1,599 | $2.22 | 24d | 1 | 0.27mi |
| 153 Monaco D Delray Beach, FL | 2.0 | 2.0 | 880 | $1,750 | $1.99 | 17d | 1 | 0.27mi |
| 459 Monaco Blvd Unit 459 Delray Beach, FL | 1.0 | 1.5 | 720 | $1,500 | $2.08 | 21d | 1 | 0.27mi |
| 581 Monaco Blvd Unit 581 Delray Beach, FL | 2.0 | 2.0 | 880 | $2,000 | $2.27 | 24d | 1 | 0.27mi |
| 711 Monaco O Delray Beach, FL | 1.0 | 1.5 | 720 | $1,550 | $2.15 | 24d | 1 | 0.27mi |
| 7 Piedmont a Delray Beach, FL | 2.0 | 2.0 | 910 | $2,200 | $2.42 | 3d | 1 | 0.28mi |
| 177 Flanders D Delray Beach, FL | 2.0 | 2.0 | 920 | $1,600 | $1.74 | 24d | 1 | 0.28mi |
HOA detail condo
- Monthly dues
- $689 · $8,268/yr
- Assessments
- None detected in remarks — confirm with the listing agent.
Listing history 34 events
-
2026-06-18days on market $95,000 Active 105 DOM
-
2026-06-17days on market $95,000 Active 104 DOM
-
2026-06-16days on market $95,000 Active 103 DOM
-
2026-06-15days on market $95,000 Active 102 DOM
-
2026-06-13days on market $95,000 Active 100 DOM
-
2026-06-09days on market $95,000 Active 96 DOM
-
2026-06-08days on market $95,000 Active 95 DOM
-
2026-06-07days on market $95,000 Active 94 DOM
-
2026-06-04days on market $95,000 Active 91 DOM
-
2026-06-03days on market $95,000 Active 90 DOM
-
2026-06-02days on market $95,000 Active 89 DOM
-
2026-06-01days on market $95,000 Active 88 DOM
-
2026-05-31days on market $95,000 Active 87 DOM
-
2026-04-11price $95,000
-
2026-03-31historical $1,600
-
2026-03-06$1,600
-
2026-03-02$110,000 Active
-
2022-12-20historical
-
2020-12-10historical
-
2019-12-10$104,900 Active
-
2019-01-30historical
-
2018-12-20price $104,900
-
2018-12-10$114,000 Active
-
2015-04-09historical
-
2014-10-19historical
-
2014-06-19price $39,999
-
2014-04-09$49,999 Active
-
2008-05-31historical
-
2007-01-04$99,000
-
2005-12-13$124,999
-
2005-09-23soldstatus $80,000
-
2005-09-16soldstatus $80,000
-
2005-08-03historical
-
2005-07-22$84,500
ⓘ Source: listings_history table (triggers on properties + properties_extension) + one-shot
backfill from property_details.listing_events for pre-trigger history.
Tax reassessment forecast FL · Resets to sale price
- Current annual tax
- $1,051 · $88/mo
- Projected year-2 tax
- $1,051 · $88/mo
- Expected delta
- $0/yr ($0/mo · 0.0%)
ⓘ Screening estimate from a state-policy table — verify with the county assessor before closing.
Climate risk First Street
- Flood 1/10 Low FEMA zone X (unshaded) · 0% chance over 30 yrs
- Wildfire 1/10 Low
- Heat 8/10 Severe 2 d/yr ≥107°F today · 8 d/yr by 30 yrs out
- Wind 10/10 Extreme 99% chance of damaging wind over 30 yrs
- Air quality 2/10 Low 2 unhealthy d/yr today · 2 by 30 yrs out
Nearby sold comps map
Loading sold comps map…
Walkable amenities ~0.75 mi
Loading nearby amenities…
Taxation est. · year 1
- Rental income
- $22,082
- − Mortgage interest
- −$5,321
- − Property taxes
- −$1,051
- − Insurance
- −$475
- − Repairs & maintenance
- −$1,767
- − Management
- −$1,767
- − HOA
- −$8,268
- − Depreciation
- −$2,764
- Taxable income
- $670
- Est. tax owed @ 24.0%
- −$161
- After-tax cash flow
- $1,512/yr
For passive investors: Depreciation is non-cash, so a rental often shows a tax loss while cash-flowing — sheltering income. Rental losses are passive: they offset passive income freely, and up to $25,000/yr can offset ordinary (W-2) income if you actively participate and your MAGI is under $100k (phasing out to $0 by $150k); unused losses carry forward. On sale, claimed depreciation is recaptured at up to 25%, and gains may owe capital-gains tax (a 1031 exchange can defer both). Figures are a year-1 estimate at your 24.0% rate — not tax advice; consult a CPA.
Schools (NCES district)
- District
- Palm Beach
- NCES district ID
- 1201500
- Math proficiency
- 46% ▼ -16.00%
- Reading proficiency
- 53% ▼ -4.00%
- Median HH income
- $53,943
- Composite
- 42.72/100
- National rank
- #3160
- State rank
- #34 of 73 in FL
Livability — Delray Beach
- Score
- 77/100
- State rank
- #202
- US rank
- #3160
Category grades
Schools grade is shown separately in the Schools card above.
Census & demographics
- County
- Palm Beach County · 1,438,312 people
- City population
- 123,167
- Metro
- Miami-Fort Lauderdale-Pompano Beach, FL
- Population (ZIP)
- 28,431
- Household income
- $80,187
- Rent vs Own
- Severe rent burden
- 494.0
Population outlook (Palm Beach County) Hauer SSP2
- Today (2025)
- 1,637,487 people
- By 2030
- 1,743,255 · +6.5%
- By 2040
- 1,948,712 · +19.0%
- By 2050
- 2,132,979 · +30.3%
- By 2075
- 2,530,027 · +54.5%
- By 2100
- 2,706,979 · +65.3%
Race, ethnicity, and origin ACS 2023
- Neighborhood character
- Predominantly White (79%)
- Race & ethnicity
- White 79% Hispanic / Latino 13% Two or more races 9% Black 4%
- Hispanic origin (detail)
- Puerto Rican 3% Dominican 1%
- Common ancestry
- Romanian 9% Scotch-Irish 9% Italian 2%
- Foreign-born
- 20% · Canada, Jamaica, Guatemala
- Languages at home
- 80% English-only · Spanish 12% Other Indo-European 2% French/Haitian/Cajun 2%
Political lean MEDSL · Palm Beach
- 2024 margin
- Toss-up / Even · D 50.0% · R 49.2%
- 2008→2024 swing
- -22.1pp toward R · 2008: 22.9pp · 2024: 0.8pp
- All cycles
- 2024: D+0.8 2020: D+12.8 2016: D+15.3 2012: D+17.0 2008: D+22.9
Not yet ingested
- Civics
- —
Market trends
- HPI YoY
- ▲ 0.69%
- Current HPI
- 242.5138
- Rent YoY
- ▲ 0.51%
- Metro
- Miami-Fort Lauderdale-Pompano Beach, FL
- State GDP YoY
- ▲ 3.28%
- F500 in state
- 36
Industry mix (Fortune 500 HQ in FL)
| Industry | F500 HQs | Revenue |
|---|---|---|
| Industrial Technology | 2 | $29B |
|
||
| Insurance | 2 | $17B |
|
||
| Retail | 1 | $60B |
|
||
| Technology Distribution | 1 | $58B |
|
||
| Homebuilding | 1 | $35B |
|
||
| Technology Manufacturing | 1 | $35B |
|
||
Price history
+12.4% since first listed21 events — show timeline
- 2026-04-11 Price Changed $95,000 Beaches MLS
- 2026-03-31 Rental Removed $1,600 RMLSFL
- 2026-03-06 Listed for Rent $1,600 RMLSFL
- 2026-03-02 Listed $110,000 Beaches MLS
- 2022-12-20 Rental Removed — RMLSFL
- 2020-12-10 Listing Removed — Beaches MLS
- 2019-12-10 Listed $104,900 Beaches MLS
- 2019-01-30 Listing Removed — Beaches MLS
- 2018-12-20 Price Changed $104,900 Beaches MLS
- 2018-12-10 Listed $114,000 Beaches MLS
- 2015-04-09 Listing Removed — Beaches MLS
- 2014-10-19 Listing Removed — Beaches MLS
- 2014-06-19 Price Changed $39,999 Beaches MLS
- 2014-04-09 Listed $49,999 Beaches MLS
- 2008-05-31 Listing Removed — Beaches MLS
- 2007-01-04 Listed $99,000 Beaches MLS
- 2005-12-13 Listed $124,999 Beaches MLS
- 2005-09-23 Sold (Public Records) $80,000 Public Records
- 2005-09-16 Sold (MLS) $80,000 Beaches MLS
- 2005-08-03 Listing Removed — Beaches MLS
- 2005-07-22 Listed $84,500 Beaches MLS
Property tax history
+7.0%/yrLatest (2025): $1,051 · -8.6% YoY. Source: county tax records.
Cash-flow waterfall
monthlySold comps — $/sqft
last 12 mo · ≤1 miLoading sold comps…