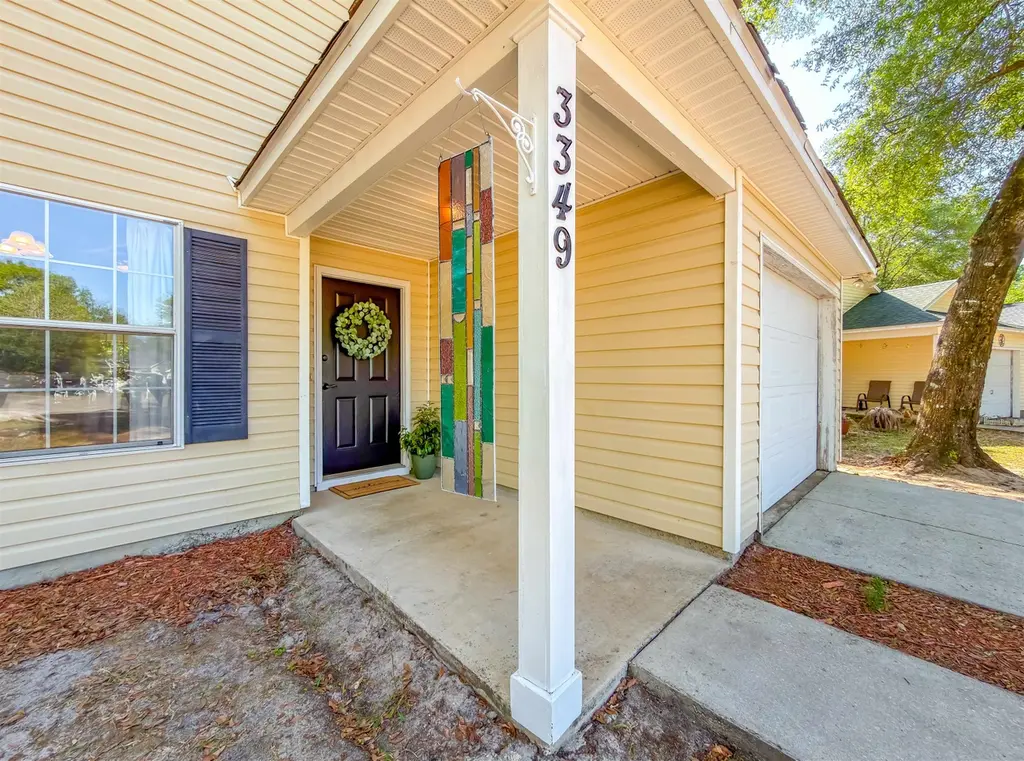
3349 Cypress Cove Ct · Tallahassee, FL
Flood risk 1/10 · Minimal
- FEMA flood zone
- X (unshaded)
- Chance of flooding over 30 yrs
- 0.0%
- Est. flood insurance / yr
- $507 – $1,088
Fire risk 5/10 · Moderate
- Est. fire insurance / yr
- $947 – $1,759
Heat risk 8/10 · Major
- Hot days now (above 108°F)
- 7 days/yr
- Hot days in 30 yrs
- 20 days/yr
Wind risk 9/10 · Severe
- Chance of severe wind over 30 yrs
- 99.0%
Air-quality risk 4/10 · Minor
- Unhealthy air days now
- 5 days/yr
- Unhealthy air days in 30 yrs
- 6 days/yr
Risk factors via First Street. Map © Google.
Why this score? — see what drove the D+ grade
The composite is a weighted blend of 9 inputs, each scored 0–100. Each bar is that input's sub-score; the figure is the points it added to the 100-point composite (weight × sub-score).
- ARV discount +15.0/15.0
- Cash flow +10.0/30.0
- Appreciation +4.7/10.0
- Schools +4.3/10.0
- Livability +4.3/5.0
- DSCR +2.8/10.0
- Rent growth +2.5/5.0
- Condition / age +2.5/5.0
- 1% rule +1.9/10.0
$225,000
🖨 Deal sheet (PDF) 📄 Offer letter ✓ Due diligence
Listing remarks
Brand new roof to be installed prior to closing with an acceptable offer! Located at the end of a cul-de-sac and backing to wooded greenspace protected by a conservation easement, this single-story 3-bedroom, 2-bath home with a garage offers privacy and convenience within walking distance of the Tallahassee Museum. The home features a split-bedroom floor plan, vaulted ceilings, a wood-burning fireplace, and a spacious primary suite with a walk-in closet. Much of the interior has been freshly painted, and the home is built on a solid slab foundation. The yard includes a goldfish pond, plum tree, blueberry bushes, and prickly pear, while the privacy-fenced backyard features a deck and covered
Key facts
- 6,098 sq ft lot
- Garage
- Built 2002
Property features AI
Exterior
- Parking: Detached or attached 1-car garage
- Security: Owned security system
- Utilities: Public sewer
- Home design: Single-story home; Vinyl siding
- Construction: Vinyl siding construction; Slab foundation
- Exterior features: Fully fenced yard; Privacy fencing; Covered patio/porch; Deck; Porch; Paved road access; Has view
Interior
- Kitchen: Oven; Range; Dishwasher; Garbage disposal; Refrigerator; Pantry
- Bedrooms: Bedroom 2 (12 x 12); Bedroom 3 (12 x 10)
- Bathrooms: 2 full bathrooms
- Heating & cooling: Central heating; Electric heating; Wood heating; Central air conditioning; Ceiling fan(s)
- Interior features: Tray and vaulted ceilings; Pantry; Split-bedroom floorplan; Walk-in closet(s); Fireplace
- Laundry & utility: Washer; Dryer; Utility room
Neighborhood map
What this means for you Summary
Snapshot
- This is a 3-bed/2.0-bath single-family listed at $225k.
Deal economics
- At list price, monthly cash flow is $-136 ($-2k/yr) — negative.
- To cash-flow at today's rent, offer at most $201k (10.7% below list).
- To meet the 1% rule (rent ≥ 1% of price), the offer needs to be $156k (30.7% below list).
- Recommended offer: $156k (30.7% below list) — sets the bar for 1% rule.
- Cap rate 5.6% vs local median 4.2% in Tallahassee — top-decile yield for the area; either an underpriced asset or a hidden risk that comps aren't pricing in. Stress-test before assuming the spread holds.
Location & tenants
- Location reads 86/100 on livability (#19 in FL, #429 nationally) — a professional / high-income tenant draw. Strengths: amenities A+, commute A+, health & safety A+; Watch: employment D.
- Leon (urban): math 48% / reading 53% proficiency, ranked #33 of 73 in FL (top 45%) — acceptable for families but not a draw, mixed tenant base, ~2y average lease.
- Zoned schools: Pineview Elementary School (math 32% / reading 32%, grade F, #1,797 of 2,144 statewide, top 86%, 362 students, 83% FRL); R. Frank Nims Middle School (math 20% / reading 24%, grade F, #549 of 571 statewide, top 97%, 609 students, 82% FRL); James Rickards High School (math 23% / reading 37%, grade F, #441 of 667 statewide, top 67%, 1,581 students, 57% FRL) — zoned schools average 74% FRL vs 45% district-wide (29 pts higher); higher-poverty schools than district average — tighter screening recommended.
- Zoned-school proficiency averages 28% at this address vs 50% district-wide (-22 pts) — the specific schools serving this property underperform the Leon average; the district grade overstates school quality for this exact location.
- Market conditions: 94 active listings in the ZIP; 5 comparable units currently listed for rent nearby; rentals at typical pace (median 23d on market — plan ~3-4 weeks tenant-placement turnaround); lower-income renter base — watch delinquency; 1,765 units permitted in Leon County in 2024 (975 in 5+ unit buildings).
- At $1,560/mo this rent would consume 49% of the median local household income ($38k/yr) (locally 1272% of renters already pay >50% of income on rent) — very limited rent-growth headroom before tenants either downsize or default.
Forward outlook
- In year one you build about $338 of equity ($2k loan paydown + $-1k appreciation (-0.5% local appreciation)).
- Leon County population projected at +23% by 2050 — long-run rental-demand tailwind backs the buy-and-hold thesis.
Negotiation context
- It's been on market 53 days — a 3% lower offer ($218k) is reasonable based on typical stale-listing flexibility.
- 2 sale attempts with the ask held roughly flat each time — persistent listings suggest the price (not the market) is what's stuck; bring a comps-based counter.
- Current owner paid $137k; list at $225k implies a 64% gain — meaningful room to come down on a strong offer.
Risks & watch-outs
- Climate carrying-cost: severe wind risk, 99% chance of damaging wind over 30y; moderate wildfire risk; extreme-heat days projected 7→20/yr by 2055 (HVAC capex compounding) — expect insurance premiums to compound above CPI over the hold.
Questions for the listing agent
- What do current leases actually rent for vs. the listed asking? Can we see a recent rent roll and the last 12 months of T-12 income?
- It's been on market 53 days. Have you received any prior offers? Is the seller open to a 31% concession, seller financing, or rate buy-down credit?
- Is there a deadline driving the sale (1031 exchange, divorce, estate, relocation)? That informs how much negotiation room exists.
- Schools are B-rated — typically a magnet for longer-tenancy family renters. What's the average tenant stay here, and is there a school-zone premium baked into asking?
- The area grade is low — what's the realistic commute time and amenity access for the typical tenant pool here? Any planned neighborhood developments (good or bad) we should know about?
- What's the average days-on-market for RENTAL listings here right now (not sales)? A rising rental-DOM trend means longer vacancies and softer asking-rent achievability than the comps imply.
- What's the recent tenant-quality profile in this submarket — average credit score on applications, eviction rate, late-payment / NSF rate, and stable-employment percentage? A property-management company in the area should have these aggregated.
- How much new for-sale + rental construction is in the pipeline within 1–3 miles? Heavy new supply typically softens prices + rents 12–24 months out; constrained supply supports both.
Investment metrics
- 1% rule
- 0.69% ✗
- Cap rate
- 5.57%
- Cash-on-cash
- -2.60%
- DSCR
- 0.88
- GRM
- 12.0
CMA / ARV
- ARV (on-the-fly)
- $269,742
- Comps found
- 2
Show comp detail 2 sales within ~0.75 mi
| Address | Dist | Beds/Ba | Sqft | Sold | Price | $/sf | Match |
|---|---|---|---|---|---|---|---|
| 2307 Cypress Cove Dr | 0.12mi | 3/2.0 | 1,360 (+1%) | 9mo | $273,000 | $201 | 85 |
| 4111 Pond Cypress Ct | 0.09mi | 3/2.0 | 1,204 (-10%) | 6mo | $230,000 | $191 | 74 |
Match score weights: distance 35% · size 25% · config 20% · recency 20%. Top-matched comps best support the ARV.
Projected returns pro-forma
-0.54% appreciation · 3.0% rent growth · sell at horizon
- IRR
- -7.4%
- Equity multiple
- 0.67×
- Total profit
- $-21,014
- Equity at exit
- $59,310
- IRR
- -1.1%
- Equity multiple
- 0.90×
- Total profit
- $-6,567
- Equity at exit
- $66,649
Cash invested: $63,000 (down + closing). Projections, not guarantees.
Landlord ↔ Tenant lean methodology
- Overall (STATE)
- 87 Strongly Landlord-Friendly
- State Florida
- 87 Strongly Landlord-Friendly · R+3
- County
- — inherits STATE
- City
- — inherits STATE
ZIP-level market 32310
- Home prices YoY
- -0.2%
- Active inventory
- 94
- Price-to-rent
- 12.0×
Monthly cashflow live
- Estimated rent
- $1,560 high interval (Pro) →
- Mortgage (P&I)
- −$1,180
- Tax from tax record
- −$95 /mo · $1,143/yr
- Insurance
- −$94
- HOA
- −$0
- Vacancy / Maint / Mgmt
- −$328
- Net cashflow
- $-136
Break-even live
Sensitivity live
| Price | -10% $-9 | -5% $-73 | +0% $-136 | +5% $-200 | +10% $-264 |
|---|---|---|---|---|---|
| Rent | -10% $-260 | -5% $-198 | +0% $-136 | +5% $-75 | +10% $-13 |
| Rate | -1.0pp $-23 | -0.5pp $-79 | base $-136 | +0.5pp $-195 | +1.0pp $-254 |
UW: 25.0% down · 7.5% · 30yr · 1.5% tax · 5.0% vac · 8.0% maint · 8.0% mgmt
Financing live
Cash to close
- Down payment
- $56,250
- Closing costs
- $6,750
- Reserves months
- —
- Total cash needed
- —
Loan-product check · same deal, 3 products live
Conventional
25% down · 7.5% · 30yr
- Down + closing
- —
- Monthly P&I
- —
- Monthly cashflow
- —
- DSCR
- —
- Eligible?
- —
Personal DTI + credit; lowest rate.
DSCR
20% down · 8.5% · 30yr
- Down + closing
- —
- Monthly P&I
- —
- Monthly cashflow
- —
- DSCR
- —
- Eligible?
- —
No personal income docs; deal must DSCR.
Hard money
10% down · 12.0% · 12mo
- Down + closing
- —
- Monthly P&I
- —
- Monthly cashflow
- —
- DSCR
- —
- Eligible?
- —
Short-term bridge; refi at stabilization.
Rent comps 5 comps
| Address | Beds | Baths | Sqft | Rent | $/sqft | DOM | Units | Dist |
|---|---|---|---|---|---|---|---|---|
| 2013 Tyson Green Trl Tallahassee, FL | 3.0 | 3.0 | 1308 | $1,400 | $1.07 | 23d | 1 | 0.32mi |
| 1692 Baldwin Park Dr Unit 1692 Tallahassee, FL | 3.0 | 3.0 | 1385 | $1,475 | $1.06 | 23d | 1 | 1.19mi |
| 1694 Baldwin Park Dr Tallahassee, FL | 3.0–4.0 | 3.0–4.0 | 1520 | $1,500 | $0.99 | 15d | 4 | 1.19mi |
| 1694 Baldwin Park Dr Unit 1607 Tallahassee, FL | 4.0 | 4.0 | 1683 | $1,900 | $1.13 | 23d | 1 | 1.22mi |
| 1694 Baldwin Park Dr Unit 1650 Tallahassee, FL | 3.0 | 3.0 | 1358 | $1,600 | $1.18 | 23d | 1 | 1.22mi |
Listing history 25 events
-
2026-06-22days on market $225,000 Active 53 DOM
-
2026-06-18days on market $225,000 Active 50 DOM
-
2026-06-17days on market $225,000 Active 49 DOM
-
2026-06-16days on market $225,000 Active 48 DOM
-
2026-06-15days on market $225,000 Active 47 DOM
-
2026-06-14days on market $225,000 Active 45 DOM
-
2026-06-10days on market $225,000 Active 42 DOM
-
2026-06-09days on market $225,000 Active 41 DOM
-
2026-06-08days on market $225,000 Active 40 DOM
-
2026-06-07days on market $225,000 Active 39 DOM
-
2026-06-05days on market $225,000 Active 36 DOM
-
2026-06-03days on market $225,000 Active 35 DOM
-
2026-06-02days on market $225,000 Active 34 DOM
-
2026-06-01days on market $225,000 Active 33 DOM
-
2026-05-31days on market $225,000 Active 32 DOM
-
2026-05-30days on market $225,000 Active 31 DOM
-
2026-05-23price $225,000
-
2026-04-29$235,000 Active
-
2026-02-15historical
-
2025-12-04price $240,000
-
2025-09-12price $260,000
-
2025-08-20price $280,000
-
2025-06-19$290,000 Active
-
2005-02-18soldstatus $136,900
-
2002-04-05soldstatus $100,000
ⓘ Source: listings_history table (triggers on properties + properties_extension) + one-shot
backfill from property_details.listing_events for pre-trigger history.
Tax reassessment forecast FL · Resets to sale price
- Current annual tax
- $1,143 · $95/mo
- Projected year-2 tax
- $1,868 · $156/mo
- Expected delta
- +$724/yr (+$60/mo · 63.3%)
ⓘ Screening estimate from a state-policy table — verify with the county assessor before closing.
Climate risk First Street
- Flood 1/10 Low FEMA zone X (unshaded) · 0% chance over 30 yrs
- Wildfire 5/10 Major
- Heat 8/10 Severe 7 d/yr ≥108°F today · 20 d/yr by 30 yrs out
- Wind 9/10 Extreme 99% chance of damaging wind over 30 yrs
- Air quality 4/10 Moderate 5 unhealthy d/yr today · 6 by 30 yrs out
Nearby sold comps map
Loading sold comps map…
Walkable amenities ~0.75 mi
Loading nearby amenities…
Taxation est. · year 1
- Rental income
- $18,724
- − Mortgage interest
- −$12,603
- − Property taxes
- −$1,143
- − Insurance
- −$1,125
- − Repairs & maintenance
- −$1,498
- − Management
- −$1,498
- − Depreciation
- −$6,545
- Taxable loss
- −$5,689
- Est. tax savings @ 24.0%
- +$1,365
- After-tax cash flow
- $-270/yr
For passive investors: Depreciation is non-cash, so a rental often shows a tax loss while cash-flowing — sheltering income. Rental losses are passive: they offset passive income freely, and up to $25,000/yr can offset ordinary (W-2) income if you actively participate and your MAGI is under $100k (phasing out to $0 by $150k); unused losses carry forward. On sale, claimed depreciation is recaptured at up to 25%, and gains may owe capital-gains tax (a 1031 exchange can defer both). Figures are a year-1 estimate at your 24.0% rate — not tax advice; consult a CPA.
Schools (NCES district)
- District
- Leon
- NCES district ID
- 1201110
- Math proficiency
- 48% ▼ -13.00%
- Reading proficiency
- 53% ▼ -5.00%
- Median HH income
- $46,339
- Composite
- 42.84/100
- National rank
- #3131
- State rank
- #33 of 73 in FL
Livability — Tallahassee
- Score
- 86/100
- State rank
- #19
- US rank
- #429
Category grades
Schools grade is shown separately in the Schools card above.
Census & demographics
- Census place
- Tallahassee, FL
- County
- Leon County · 294,472 people
- City population
- 294,472
- Metro
- Tallahassee, FL
- Population (ZIP)
- 14,888
- Household income
- $38,288
- Rent vs Own
- Severe rent burden
- 1272.0
Population outlook (Leon County) Hauer SSP2
- Today (2025)
- 315,507 people
- By 2030
- 330,677 · +4.8%
- By 2040
- 358,465 · +13.6%
- By 2050
- 386,804 · +22.6%
- By 2075
- 465,480 · +47.5%
- By 2100
- 519,959 · +64.8%
Race, ethnicity, and origin ACS 2023
- Neighborhood character
- Diverse neighborhood (Simpson 0.61)
- Race & ethnicity
- Black 50% White 36% Hispanic / Latino 9% Two or more races 5%
- Hispanic origin (detail)
- Mexican 3%
- Common ancestry
- Italian 1% Lithuanian 1% Slovak 1%
- Foreign-born
- 4% · Canada
- Languages at home
- 92% English-only · Spanish 6% French/Haitian/Cajun 1% German/W. Germanic 1%
Political lean MEDSL · Leon
- 2024 margin
- Strong D (+21.8) · D 60.3% · R 38.5% · Other 1.2%
- 2008→2024 swing
- -2.5pp toward R · 2008: 24.3pp · 2024: 21.8pp
- All cycles
- 2024: D+21.8 2020: D+28.3 2016: D+25.1 2012: D+23.6 2008: D+24.3
Not yet ingested
- Civics
- —
Market trends
- HPI YoY
- ▼ -0.54%
- Current HPI
- 270.5721
- Rent YoY
- —
- Metro
- Tallahassee, FL
- State GDP YoY
- ▲ 3.28%
- F500 in state
- 36
Industry mix (Fortune 500 HQ in FL)
| Industry | F500 HQs | Revenue |
|---|---|---|
| Industrial Technology | 2 | $29B |
|
||
| Insurance | 2 | $17B |
|
||
| Retail | 1 | $60B |
|
||
| Technology Distribution | 1 | $58B |
|
||
| Homebuilding | 1 | $35B |
|
||
| Technology Manufacturing | 1 | $35B |
|
||
Price history
+125.0% since first listed9 events — show timeline
- 2026-05-23 Price Changed $225,000 CATRS
- 2026-04-29 Listed $235,000 CATRS
- 2026-02-15 Listing Removed — CATRS
- 2025-12-04 Price Changed $240,000 CATRS
- 2025-09-12 Price Changed $260,000 CATRS
- 2025-08-20 Price Changed $280,000 CATRS
- 2025-06-19 Listed $290,000 CATRS
- 2005-02-18 Sold (Public Records) $136,900 Public Records
- 2002-04-05 Sold (Public Records) $100,000 Public Records
Property tax history
+3.1%/yrLatest (2025): $1,143 · +4.0% YoY. Source: county tax records.
Cash-flow waterfall
monthlySold comps — $/sqft
last 12 mo · ≤1 miLoading sold comps…