241 Farrar Drive Dr · Chester, CA
Flood risk 1/10 · Minimal
- FEMA flood zone
- X (unshaded)
- Chance of flooding over 30 yrs
- 0.0%
- Est. flood insurance / yr
- $507 – $1,088
Fire risk 4/10 · Minor
- Est. fire insurance / yr
- $659 – $1,223
Heat risk 3/10 · Minor
- Hot days now (above 90°F)
- 7 days/yr
- Hot days in 30 yrs
- 19 days/yr
Wind risk 1/10 · Minimal
- Chance of severe wind over 30 yrs
- —
Air-quality risk 10/10 · Severe
- Unhealthy air days now
- 21 days/yr
- Unhealthy air days in 30 yrs
- 22 days/yr
Risk factors via First Street. Map © Google.
Why this score? — see what drove the C- grade
The composite is a weighted blend of 9 inputs, each scored 0–100. Each bar is that input's sub-score; the figure is the points it added to the 100-point composite (weight × sub-score).
- ARV discount +15.0/15.0
- Appreciation +10.0/10.0
- Cash flow +9.5/30.0
- 1% rule +3.1/10.0
- Livability +3.0/5.0
- Schools +2.8/10.0
- DSCR +2.7/10.0
- Rent growth +2.5/5.0
- Condition / age +2.5/5.0
$180,000
🖨 Deal sheet 📄 Offer letter ✓ Due diligence
Listing remarks MLS
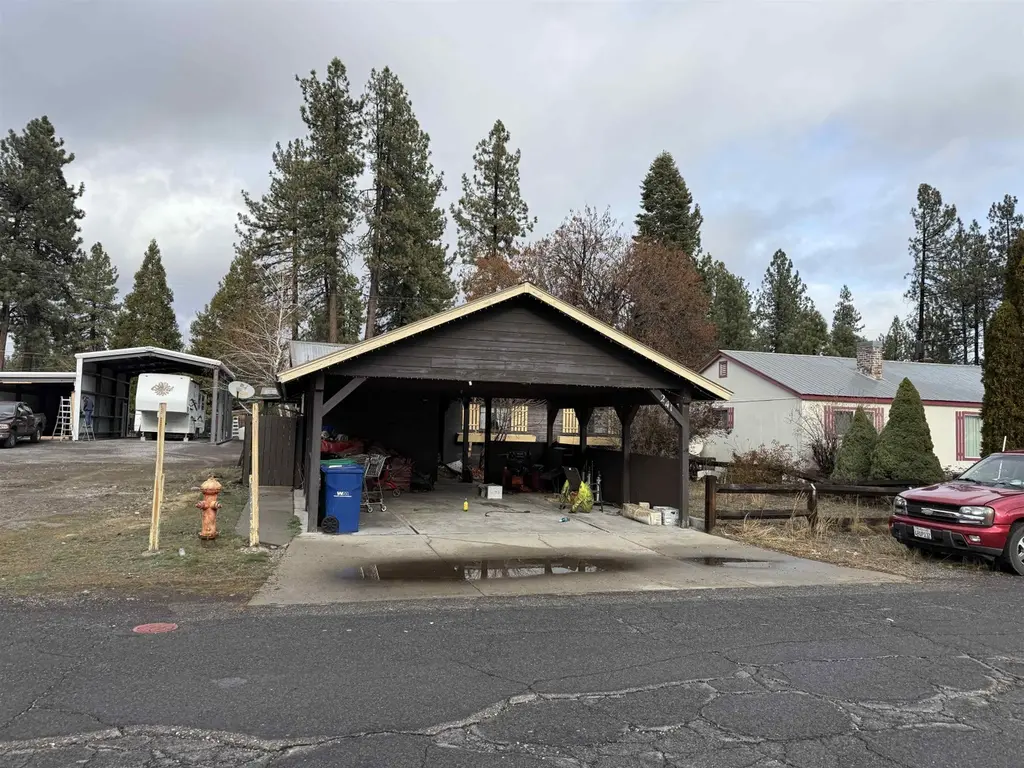
Large home with some needed repairs. Four bedrooms, two bathrooms and a two car carport. Two storage sheds in the back yard. Bring your tool belt, remodel plans and make this home yours!
Key facts
- Back yard
- Storage sheds
- 7,405 sq ft lot
Tags
Neighborhood map
What this means for you Summary
Snapshot
- This is a 4-bed/1.0-bath single-family listed at $180k.
Deal economics
- At list price, monthly cash flow is $-125 ($-2k/yr) — negative.
- To cash-flow at today's rent, offer at most $158k (12.3% below list).
- To meet the 1% rule (rent ≥ 1% of price), the offer needs to be $146k (18.6% below list).
- Recommended offer: $146k (18.6% below list) — sets the bar for 1% rule.
Location & tenants
- Location reads 60/100 on livability (#581 in CA) — a middle-class / working-renter tenant base. Strengths: housing A+, crime B+; Watch: cost of living D+, amenities F, commute F.
- Plumas Unified (rural): math 21% / reading 44% proficiency, ranked #306 of 517 in CA (top 59%) — families likely to look elsewhere, expect single-tenant / working-renter base with shorter leases.
- Market conditions: 74 active listings in the ZIP; 39 units permitted in Plumas County in 2024 (0 in 5+ unit buildings).
Forward outlook
- In year one you build about $19k of equity ($1k loan paydown + $18k appreciation (10.0% local appreciation)).
- Plumas County population projected at -42% by 2050 — secular population decline; favor cash flow + early exit over multi-decade hold.
- By year 2, paydown + projected appreciation supports a ~$31k cash-out refi (75% LTV) — recoverable capital for the next deal without selling this one.
Negotiation context
- It's been on market 147 days — a 12% lower offer ($158k) is reasonable based on typical stale-listing flexibility.
- 2 sale attempts; this cycle's ask has dropped $80k (31%) from the opening price — seller is motivated, your offer sets the floor, not the list.
Risks & watch-outs
- Watch-outs: built in 1957 — expect roof / HVAC / electrical / plumbing capex.
Questions for the listing agent
- What do current leases actually rent for vs. the listed asking? Can we see a recent rent roll and the last 12 months of T-12 income?
- It's been on market 147 days. Have you received any prior offers? Is the seller open to a 19% concession, seller financing, or rate buy-down credit?
- Built in 1957 — when were the roof, HVAC, electrical panel, plumbing, and water heater last replaced?
- Why hasn't it sold? Are there any deal-killer items the seller is aware of (foundation, flood, title, zoning, code violations)?
- Is there a deadline driving the sale (1031 exchange, divorce, estate, relocation)? That informs how much negotiation room exists.
- What's the average days-on-market for RENTAL listings here right now (not sales)? A rising rental-DOM trend means longer vacancies and softer asking-rent achievability than the comps imply.
- What's the recent tenant-quality profile in this submarket — average credit score on applications, eviction rate, late-payment / NSF rate, and stable-employment percentage? A property-management company in the area should have these aggregated.
- How much new for-sale + rental construction is in the pipeline within 1–3 miles? Heavy new supply typically softens prices + rents 12–24 months out; constrained supply supports both.
Investment metrics
- 1% rule
- 0.81% ✗
- Cap rate
- 5.46%
- Cash-on-cash
- -2.98%
- DSCR
- 0.87
- GRM
- 10.2
CMA / ARV
- ARV (median comp)
- $329,665
- List price
- $180,000
- Delta
- -45.40%
- Verdict
- UNDERPRICED
- Comps
- 20 within 1.0 mi
Show comp detail 7 sales within ~0.75 mi
| Address | Dist | Beds/Ba | Sqft | Sold | Price | $/sf | Match |
|---|---|---|---|---|---|---|---|
| 401 Main St | 0.16mi | 3/1.5 (-1) | 2,025 (+2%) | 22mo | $260,000 | $128 | 63 |
| 210 Riverwood Dr | 0.32mi | 4/2.0 | 1,844 (-7%) | 12mo | $330,000 | $179 | 60 |
| 164 Aldon Drive Dr | 0.33mi | 3/2.0 (-1) | 1,919 (-3%) | 13mo | $300,000 | $156 | 60 |
| 611 Purdy Rd | 0.50mi | 4/2.0 | 2,021 (+2%) | 12mo | $499,000 | $247 | 58 |
| 438 Watson Rd | 0.41mi | 4/2.0 | 1,819 (-8%) | 11mo | $400,000 | $220 | 54 |
| 545 Cross St | 0.28mi | 3/2.0 (-1) | 1,776 (-10%) | 9mo | $343,000 | $193 | 53 |
| 462 Watson Rd | 0.41mi | 3/2.0 (-1) | 1,746 (-12%) | 12mo | $417,500 | $239 | 42 |
Match score weights: distance 35% · size 25% · config 20% · recency 20%. Top-matched comps best support the ARV.
Projected returns pro-forma
10.0% appreciation · 3.0% rent growth · sell at horizon
- IRR
- 22.2%
- Equity multiple
- 2.79×
- Total profit
- $90,105
- Equity at exit
- $162,158
- IRR
- 19.9%
- Equity multiple
- 6.39×
- Total profit
- $271,707
- Equity at exit
- $349,700
Cash invested: $50,400 (down + closing). Projections, not guarantees.
Landlord ↔ Tenant lean methodology
- Overall (STATE)
- 18 Strongly Tenant-Friendly
- State California
- 18 Strongly Tenant-Friendly · D+13
- County
- — inherits STATE
- City
- — inherits STATE
ZIP-level market 96020
- Home prices YoY
- 12.8%
- Active inventory
- 74
- Price-to-rent
- 10.2×
Monthly cashflow live
- Estimated rent
- $1,465 medium interval (Pro) →
- Mortgage (P&I)
- −$944
- Tax from tax record
- −$264 /mo · $3,162/yr
- Insurance
- −$75
- HOA
- −$0
- Vacancy / Maint / Mgmt
- −$308
- Net cashflow
- $-125
Break-even live
UW: 25.0% down · 7.5% · 30yr · 1.5% tax · 5.0% vac · 8.0% maint · 8.0% mgmt
Financing live
Cash to close
- Down payment
- $45,000
- Closing costs
- $5,400
- Reserves months
- —
- Total cash needed
- —
Loan-product check · same deal, 3 products live
Conventional
25% down · 7.5% · 30yr
- Down + closing
- —
- Monthly P&I
- —
- Monthly cashflow
- —
- DSCR
- —
- Eligible?
- —
Personal DTI + credit; lowest rate.
DSCR
20% down · 8.5% · 30yr
- Down + closing
- —
- Monthly P&I
- —
- Monthly cashflow
- —
- DSCR
- —
- Eligible?
- —
No personal income docs; deal must DSCR.
Hard money
10% down · 12.0% · 12mo
- Down + closing
- —
- Monthly P&I
- —
- Monthly cashflow
- —
- DSCR
- —
- Eligible?
- —
Short-term bridge; refi at stabilization.
Listing history 24 events
-
2026-06-19days on market $180,000 Active 147 DOM
-
2026-06-18days on market $180,000 Active 146 DOM
-
2026-06-17days on market $180,000 Active 145 DOM
-
2026-06-16days on market $180,000 Active 144 DOM
-
2026-06-15days on market $180,000 Active 143 DOM
-
2026-06-14days on market $180,000 Active 141 DOM
-
2026-06-13days on market $180,000 Active 140 DOM
-
2026-06-10days on market $180,000 Active 138 DOM
-
2026-06-09days on market $180,000 Active 137 DOM
-
2026-06-08days on market $180,000 Active 136 DOM
-
2026-06-07days on market $180,000 Active 135 DOM
-
2026-06-05days on market $180,000 Active 132 DOM
-
2026-06-03days on market $180,000 Active 131 DOM
-
2026-06-02days on market $180,000 Active 130 DOM
-
2026-06-01days on market $180,000 Active 129 DOM
-
2026-05-31days on market $180,000 Active 128 DOM
-
2026-05-30days on market $180,000 Active 127 DOM
-
2026-05-08status Active 186-char remark
Show marketing remark (186 chars)
Large home with some needed repairs. Four bedrooms, two bathrooms and a two car carport. Two storage sheds in the back yard. Bring your tool belt, remodel plans and make this home yours!
-
2026-05-08price $180,000 186-char remark
Show marketing remark (186 chars)
Large home with some needed repairs. Four bedrooms, two bathrooms and a two car carport. Two storage sheds in the back yard. Bring your tool belt, remodel plans and make this home yours!
-
2026-04-06historical 186-char remark
Show marketing remark (186 chars)
Large home with some needed repairs. Four bedrooms, two bathrooms and a two car carport. Two storage sheds in the back yard. Bring your tool belt, remodel plans and make this home yours!
-
2026-03-23price $219,000 186-char remark
Show marketing remark (186 chars)
Large home with some needed repairs. Four bedrooms, two bathrooms and a two car carport. Two storage sheds in the back yard. Bring your tool belt, remodel plans and make this home yours!
-
2026-02-03price $235,000 186-char remark
Show marketing remark (186 chars)
Large home with some needed repairs. Four bedrooms, two bathrooms and a two car carport. Two storage sheds in the back yard. Bring your tool belt, remodel plans and make this home yours!
-
2026-01-24price $245,000 186-char remark
Show marketing remark (186 chars)
Large home with some needed repairs. Four bedrooms, two bathrooms and a two car carport. Two storage sheds in the back yard. Bring your tool belt, remodel plans and make this home yours!
-
2025-12-22$260,000 Active 186-char remark
Show marketing remark (186 chars)
Large home with some needed repairs. Four bedrooms, two bathrooms and a two car carport. Two storage sheds in the back yard. Bring your tool belt, remodel plans and make this home yours!
ⓘ Source: listings_history table (triggers on properties + properties_extension) + one-shot
backfill from property_details.listing_events for pre-trigger history.
Tax reassessment forecast CA · Resets to sale price
- Current annual tax
- $3,162 · $264/mo
- Projected year-2 tax
- $3,162 · $264/mo
- Expected delta
- $0/yr ($0/mo · 0.0%)
ⓘ Screening estimate from a state-policy table — verify with the county assessor before closing.
Climate risk First Street
- Flood 1/10 Low FEMA zone X (unshaded) · 0% chance over 30 yrs
- Wildfire 4/10 Moderate
- Heat 3/10 Moderate 7 d/yr ≥90°F today · 19 d/yr by 30 yrs out
- Wind 1/10 Low
- Air quality 10/10 Extreme 21 unhealthy d/yr today · 22 by 30 yrs out
Nearby sold comps map
Loading sold comps map…
Walkable amenities ~0.75 mi
Loading nearby amenities…
Taxation est. · year 1
- Rental income
- $17,579
- − Mortgage interest
- −$10,083
- − Property taxes
- −$3,162
- − Insurance
- −$900
- − Repairs & maintenance
- −$1,406
- − Management
- −$1,406
- − Depreciation
- −$5,236
- Taxable loss
- −$4,615
- Est. tax savings @ 24.0%
- +$1,108
- After-tax cash flow
- $-395/yr
For passive investors: Depreciation is non-cash, so a rental often shows a tax loss while cash-flowing — sheltering income. Rental losses are passive: they offset passive income freely, and up to $25,000/yr can offset ordinary (W-2) income if you actively participate and your MAGI is under $100k (phasing out to $0 by $150k); unused losses carry forward. On sale, claimed depreciation is recaptured at up to 25%, and gains may owe capital-gains tax (a 1031 exchange can defer both). Figures are a year-1 estimate at your 24.0% rate — not tax advice; consult a CPA.
Schools (NCES district)
- District
- Plumas Unified
- NCES district ID
- 0631170
- Math proficiency
- 21% ▼ -11.00%
- Reading proficiency
- 44% ▬ 0.00%
- Median HH income
- $46,935
- Composite
- 27.89/100
- National rank
- #6870
- State rank
- #306 of 517 in CA
Livability — Chester
- Score
- 60/100
- State rank
- #581
- US rank
- #18928
Category grades
Schools grade is shown separately in the Schools card above.
Census & demographics
- Census place
- Chester, CA
- Population (ZIP)
- 2,404
Population outlook (Plumas County) Hauer SSP2
- Today (2025)
- 15,564 people
- By 2030
- 14,014 · -10.0%
- By 2040
- 11,197 · -28.1%
- By 2050
- 9,069 · -41.7%
- By 2075
- 5,573 · -64.2%
- By 2100
- 3,392 · -78.2%
Race, ethnicity, and origin ACS 2023
- Neighborhood character
- Predominantly White (82%)
- Race & ethnicity
- White 82% Hispanic / Latino 15% Two or more races 4%
- Hispanic origin (detail)
- Mexican 8% Puerto Rican 4%
- Common ancestry
- Slovak 6% Italian 4% Iranian 2%
- Foreign-born
- 0%
- Languages at home
- 97% English-only · Spanish 3%
Political lean MEDSL · Plumas
- 2024 margin
- R (+16.9) · D 39.9% · R 56.9% · Other 3.2%
- 2008→2024 swing
- -5.0pp toward R · 2008: -12.0pp · 2024: -16.9pp
- All cycles
- 2024: R+16.9 2020: R+16.7 2016: R+21.0 2012: R+17.2 2008: R+12.0
Not yet ingested
- Civics
- —
Market trends
- HPI YoY
- ▲ 16.21%
- Current HPI
- 142.75
- Rent YoY
- —
- Metro
- —
- State GDP YoY
- ▲ 3.21%
- F500 in state
- 116
Industry mix (Fortune 500 HQ in CA)
| Industry | F500 HQs | Revenue |
|---|---|---|
| Technology | 27 | $1,492B |
|
||
| Financial Services | 3 | $174B |
|
||
| Retail | 3 | $44B |
|
||
| Insurance | 3 | $26B |
|
||
| Media / Entertainment | 2 | $115B |
|
||
| Pharmaceuticals / Biotech | 2 | $62B |
|
||
Price history
-30.8% since first listed7 events — show timeline
- 2026-05-08 Relisted — PAR
- 2026-05-08 Price Changed $180,000 PAR
- 2026-04-06 Delisted — PAR
- 2026-03-23 Price Changed $219,000 PAR
- 2026-02-03 Price Changed $235,000 PAR
- 2026-01-24 Price Changed $245,000 PAR
- 2025-12-22 Listed $260,000 PAR
Property tax history
+10.8%/yrLatest (2025): $3,162 · -0.5% YoY. Source: county tax records.
Cash-flow waterfall
monthlySold comps — $/sqft
last 12 mo · ≤1 miLoading sold comps…