250 E Jackson St · Equality, IL
Flood risk 1/10 · Minimal
- FEMA flood zone
- X (unshaded)
- Chance of flooding over 30 yrs
- 0.0%
- Est. flood insurance / yr
- $473 – $860
Fire risk 1/10 · Minimal
- Est. fire insurance / yr
- $804 – $1,492
Heat risk 5/10 · Moderate
- Hot days now (above 108°F)
- 7 days/yr
- Hot days in 30 yrs
- 20 days/yr
Wind risk 2/10 · Minimal
- Chance of severe wind over 30 yrs
- 4.0%
Air-quality risk 2/10 · Minimal
- Unhealthy air days now
- 0 days/yr
- Unhealthy air days in 30 yrs
- 1 days/yr
Risk factors via First Street. Map © Google.
Why this score? — see what drove the B grade
The composite is a weighted blend of 9 inputs, each scored 0–100. Each bar is that input's sub-score; the figure is the points it added to the 100-point composite (weight × sub-score).
- Cash flow +30.0/30.0
- 1% rule +10.0/10.0
- DSCR +10.0/10.0
- ARV discount +7.5/15.0
- Appreciation +5.0/10.0
- Livability +2.8/5.0
- Rent growth +2.5/5.0
- Condition / age +2.5/5.0
- Schools +1.9/10.0
$49,900
🖨 Deal sheet 📄 Offer letter ✓ Due diligence
Listing remarks MLS
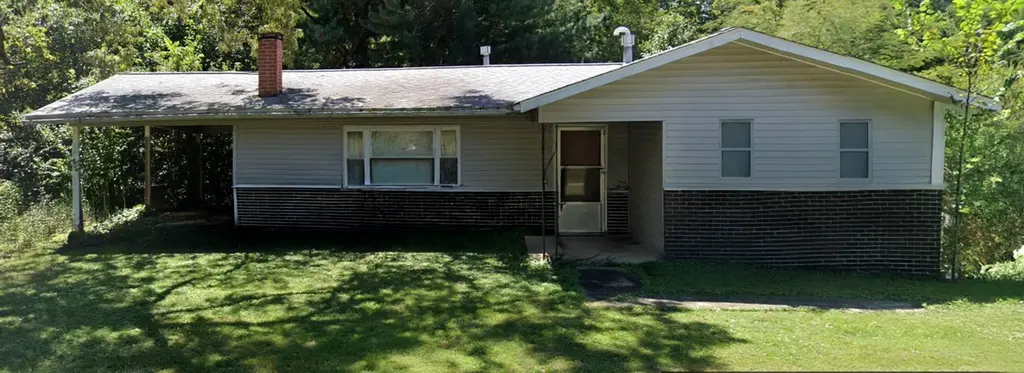
Sharp 3 bed, 2 bath brick and vinyl home that has been recently remodeled, featuring newer roof, windows, siding, and more. The property includes an attached carport and a separate two-car detached garage in the rear that offers additional potential. Enjoy a spacious yard that provides added privacy. The property is being sold as-is, with no warranties or representations. No interior access for showings or inspections. Cash only, no seller-financed offers will be considered. Seller does not provide survey.
Key facts
- Spacious yard
- Attached carport
- Newer roof
Tags
Neighborhood map
What this means for you Summary
Snapshot
- This is a 3-bed/2.0-bath other listed at $50k.
Deal economics
- At list price, monthly cash flow is $378 ($5k/yr) — positive.
- The deal already cash-flows at list — no discount required.
- Meets the 1% rule at list price ($912 rent vs $50k).
- Recommended offer: $47k (6.0% below list) — sets the bar for market timing.
Location & tenants
- Location reads 56/100 on livability (#1,182 in IL) — a working-class tenant base; expect higher turnover. Strengths: cost of living A+, housing A+; Watch: schools F, crime D-, amenities F.
- Gallatin CUSD 7 (rural): math 11% / reading 35% proficiency, ranked #387 of 620 in IL (top 62%) — low school quality limits family demand, transient renter base, plan for 1-2y turnover.
- Market conditions: 4 active listings in the ZIP.
Forward outlook
- In year one you build about $2k of equity ($345 loan paydown + $1k appreciation (3.0% local appreciation)).
- Gallatin County population projected at -28% by 2050 — secular population decline; favor cash flow + early exit over multi-decade hold.
- At projected returns (3.0% appreciation + 3.0% rent growth), your $14k cash investment doubles in ~3 years — after that, you're playing with house money.
Negotiation context
- It's been on market 70 days — a 6% lower offer ($47k) is reasonable based on typical stale-listing flexibility.
Risks & watch-outs
- Climate carrying-cost: extreme-heat days projected 7→20/yr by 2055 (HVAC capex compounding) — expect insurance premiums to compound above CPI over the hold.
Questions for the listing agent
- It's been on market 70 days. Have you received any prior offers? Is the seller open to a 6% concession, seller financing, or rate buy-down credit?
- Why hasn't it sold? Are there any deal-killer items the seller is aware of (foundation, flood, title, zoning, code violations)?
- Is there a deadline driving the sale (1031 exchange, divorce, estate, relocation)? That informs how much negotiation room exists.
- Schools are F-rated, which usually means shorter tenancies and higher turnover. Who's the typical renter profile here, and what's been the actual vacancy rate?
- Crime grade is D in this area — have there been break-ins, vandalism, or insurance claims at this property in the last 3 years? What carrier currently insures it and at what premium?
- What's the average days-on-market for RENTAL listings here right now (not sales)? A rising rental-DOM trend means longer vacancies and softer asking-rent achievability than the comps imply.
- What's the recent tenant-quality profile in this submarket — average credit score on applications, eviction rate, late-payment / NSF rate, and stable-employment percentage? A property-management company in the area should have these aggregated.
- How much new for-sale + rental construction is in the pipeline within 1–3 miles? Heavy new supply typically softens prices + rents 12–24 months out; constrained supply supports both.
Investment metrics
- 1% rule
- 1.83% ✓
- Cap rate
- 15.38%
- Cash-on-cash
- 32.46%
- DSCR
- 2.44
- GRM
- 4.6
CMA / ARV
- ARV (median comp)
- $116,491
- List price
- $49,900
- Delta
- -57.16%
- Verdict
- UNDERPRICED
- Comps
- 2 within 1.0 mi
Projected returns pro-forma
3.0% appreciation · 3.0% rent growth · sell at horizon
- IRR
- 38.2%
- Equity multiple
- 3.15×
- Total profit
- $30,097
- Equity at exit
- $22,437
- IRR
- 38.2%
- Equity multiple
- 6.26×
- Total profit
- $73,429
- Equity at exit
- $34,578
Cash invested: $13,972 (down + closing). Projections, not guarantees.
Landlord ↔ Tenant lean methodology
- Overall (STATE)
- 43 Moderately Tenant-Leaning
- State Illinois
- 43 Moderately Tenant-Leaning · D+7
- County
- — inherits STATE
- City
- — inherits STATE
ZIP-level market 62934
- Active inventory
- 4
- Price-to-rent
- 4.6×
Monthly cashflow live
- Estimated rent
- $912 medium interval (Pro) →
- Mortgage (P&I)
- −$262
- Tax from tax record
- −$60 /mo · $717/yr
- Insurance
- −$21
- HOA
- −$0
- Vacancy / Maint / Mgmt
- −$191
- Net cashflow
- $378
Break-even live
UW: 25.0% down · 7.5% · 30yr · 1.5% tax · 5.0% vac · 8.0% maint · 8.0% mgmt
Financing live
Cash to close
- Down payment
- $12,475
- Closing costs
- $1,497
- Reserves months
- —
- Total cash needed
- —
Loan-product check · same deal, 3 products live
Conventional
25% down · 7.5% · 30yr
- Down + closing
- —
- Monthly P&I
- —
- Monthly cashflow
- —
- DSCR
- —
- Eligible?
- —
Personal DTI + credit; lowest rate.
DSCR
20% down · 8.5% · 30yr
- Down + closing
- —
- Monthly P&I
- —
- Monthly cashflow
- —
- DSCR
- —
- Eligible?
- —
No personal income docs; deal must DSCR.
Hard money
10% down · 12.0% · 12mo
- Down + closing
- —
- Monthly P&I
- —
- Monthly cashflow
- —
- DSCR
- —
- Eligible?
- —
Short-term bridge; refi at stabilization.
Listing history 16 events
-
2026-06-18days on market $49,900 Active 70 DOM
-
2026-06-17days on market $49,900 Active 69 DOM
-
2026-06-16days on market $49,900 Active 68 DOM
-
2026-06-15days on market $49,900 Active 67 DOM
-
2026-06-13days on market $49,900 Active 65 DOM
-
2026-06-12days on market $49,900 Active 64 DOM
-
2026-06-09days on market $49,900 Active 61 DOM
-
2026-06-08days on market $49,900 Active 60 DOM
-
2026-06-07days on market $49,900 Active 59 DOM
-
2026-06-07days on market $49,900 Active 58 DOM
-
2026-06-04days on market $49,900 Active 55 DOM
-
2026-06-02days on market $49,900 Active 54 DOM
-
2026-06-01days on market $49,900 Active 53 DOM
-
2026-05-31days on market $49,900 Active 52 DOM
-
2026-05-31days on market $49,900 Active 51 DOM
-
2026-04-07$49,900 Active 511-char remark
Show marketing remark (511 chars)
Sharp 3 bed, 2 bath brick and vinyl home that has been recently remodeled, featuring newer roof, windows, siding, and more. The property includes an attached carport and a separate two-car detached garage in the rear that offers additional potential. Enjoy a spacious yard that provides added privacy. The property is being sold as-is, with no warranties or representations. No interior access for showings or inspections. Cash only, no seller-financed offers will be considered. Seller does not provide survey.
ⓘ Source: listings_history table (triggers on properties + properties_extension) + one-shot
backfill from property_details.listing_events for pre-trigger history.
Tax reassessment forecast IL · Partial reset (capped growth)
- Current annual tax
- $717 · $60/mo
- Projected year-2 tax
- $925 · $77/mo
- Expected delta
- +$208/yr (+$17/mo · 29.0%)
ⓘ Screening estimate from a state-policy table — verify with the county assessor before closing.
Climate risk First Street
- Flood 1/10 Low FEMA zone X (unshaded) · 0% chance over 30 yrs
- Wildfire 1/10 Low
- Heat 5/10 Major 7 d/yr ≥108°F today · 20 d/yr by 30 yrs out
- Wind 2/10 Low 4% chance of damaging wind over 30 yrs
- Air quality 2/10 Low 0 unhealthy d/yr today · 1 by 30 yrs out
Nearby sold comps map
Loading sold comps map…
Walkable amenities ~0.75 mi
Loading nearby amenities…
Taxation est. · year 1
- Rental income
- $10,940
- − Mortgage interest
- −$2,795
- − Property taxes
- −$717
- − Insurance
- −$250
- − Repairs & maintenance
- −$875
- − Management
- −$875
- − Depreciation
- −$1,452
- Taxable income
- $3,976
- Est. tax owed @ 24.0%
- −$954
- After-tax cash flow
- $3,581/yr
For passive investors: Depreciation is non-cash, so a rental often shows a tax loss while cash-flowing — sheltering income. Rental losses are passive: they offset passive income freely, and up to $25,000/yr can offset ordinary (W-2) income if you actively participate and your MAGI is under $100k (phasing out to $0 by $150k); unused losses carry forward. On sale, claimed depreciation is recaptured at up to 25%, and gains may owe capital-gains tax (a 1031 exchange can defer both). Figures are a year-1 estimate at your 24.0% rate — not tax advice; consult a CPA.
Schools (NCES district)
- District
- Gallatin CUSD 7
- NCES district ID
- 1700045
- Math proficiency
- 11% ▼ -4.00%
- Reading proficiency
- 35% ▼ -4.00%
- Median HH income
- $40,000
- Composite
- 19.35/100
- National rank
- #8788
- State rank
- #387 of 620 in IL
Livability — Equality
- Score
- 56/100
- State rank
- #1182
- US rank
- #22376
Category grades
Schools grade is shown separately in the Schools card above.
Census & demographics
- Census place
- Equality, IL
- Population (ZIP)
- 698
Population outlook (Gallatin County) Hauer SSP2
- Today (2025)
- 4,719 people
- By 2030
- 4,424 · -6.3%
- By 2040
- 3,872 · -17.9%
- By 2050
- 3,386 · -28.2%
- By 2075
- 2,363 · -49.9%
- By 2100
- 1,775 · -62.4%
Race, ethnicity, and origin ACS 2023
- Neighborhood character
- Predominantly White (97%)
- Race & ethnicity
- White 97% Two or more races 3%
- Common ancestry
- Lithuanian 7% Scottish 6% Romanian 5%
- Foreign-born
- 0%
Political lean MEDSL · Gallatin
- 2024 margin
- Solid R (+53.9) · D 22.2% · R 76.0% · Other 1.8%
- 2008→2024 swing
- -67.0pp toward R · 2008: 13.1pp · 2024: -53.9pp
- All cycles
- 2024: R+53.9 2020: R+52.2 2016: R+47.8 2012: R+18.1 2008: D+13.1
Not yet ingested
- Civics
- —
Market trends
- HPI YoY
- —
- Current HPI
- —
- Rent YoY
- —
- Metro
- —
- State GDP YoY
- ▲ 1.59%
- F500 in state
- 60
Industry mix (Fortune 500 HQ in IL)
| Industry | F500 HQs | Revenue |
|---|---|---|
| Insurance | 4 | $201B |
|
||
| Consumer Goods | 4 | $87B |
|
||
| Industrial Machinery | 3 | $64B |
|
||
| Healthcare | 2 | $55B |
|
||
| Retail / Pharmacy | 1 | $148B |
|
||
| Agriculture / Food | 1 | $86B |
|
||
Price history
1 event — show timeline
- 2026-04-07 Listed $49,900 MRED as Distributed by MLS Grid
Property tax history
+1.6%/yrLatest (2024): $717 · +7.5% YoY. Source: county tax records.
Cash-flow waterfall
monthlySold comps — $/sqft
last 12 mo · ≤1 miLoading sold comps…