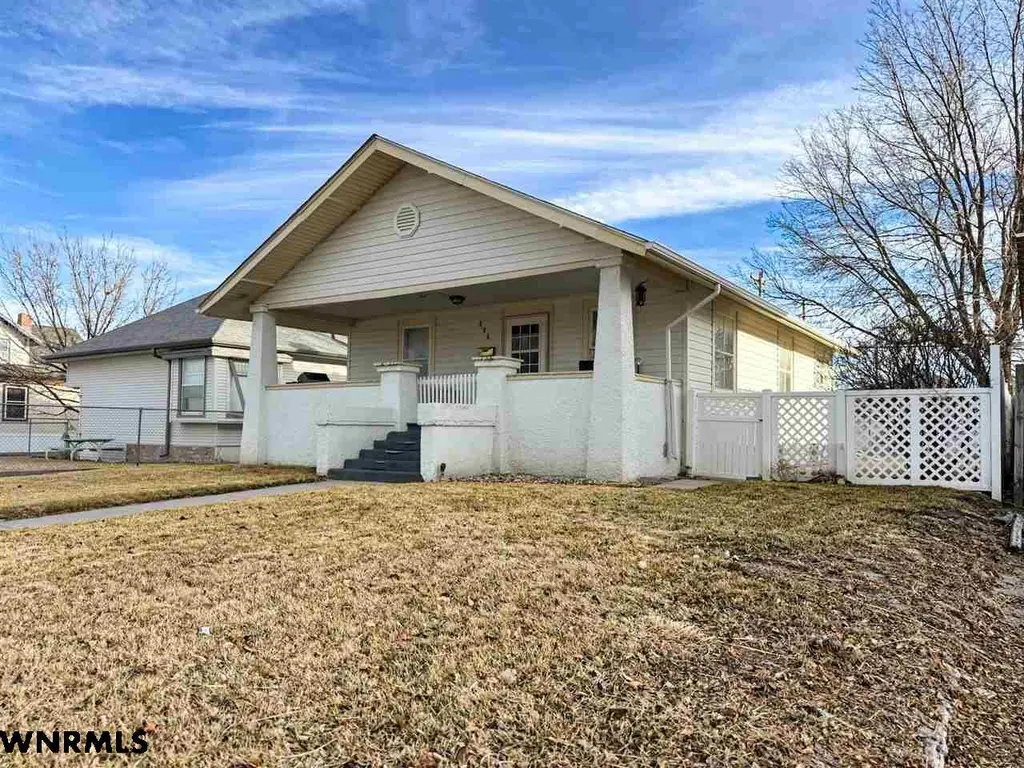
508 E 3rd St · Kimball, NE
Flood risk 1/10 · Minimal
- FEMA flood zone
- —
- Chance of flooding over 30 yrs
- 0.0%
- Est. flood insurance / yr
- —
Fire risk 4/10 · Minor
- Est. fire insurance / yr
- $1,161 – $2,155
Heat risk 2/10 · Minimal
- Hot days now (above 93°F)
- 7 days/yr
- Hot days in 30 yrs
- 17 days/yr
Wind risk 2/10 · Minimal
- Chance of severe wind over 30 yrs
- —
Air-quality risk 2/10 · Minimal
- Unhealthy air days now
- 1 days/yr
- Unhealthy air days in 30 yrs
- 1 days/yr
Risk factors via First Street. Map © Google.
Why this score? — see what drove the B grade
The composite is a weighted blend of 9 inputs, each scored 0–100. Each bar is that input's sub-score; the figure is the points it added to the 100-point composite (weight × sub-score).
- Cash flow +27.3/30.0
- ARV discount +15.0/15.0
- DSCR +9.5/10.0
- 1% rule +7.4/10.0
- Schools +3.7/10.0
- Livability +3.7/5.0
- Rent growth +2.5/5.0
- Condition / age +2.5/5.0
- Appreciation +0.0/10.0
$99,000
🖨 Deal sheet 📄 Offer letter ✓ Due diligence
Key facts
- Garage
- Built 1916
- Listed 121 days
Neighborhood map
What this means for you Summary
Snapshot
- This is a 4-bed/1.0-bath single-family listed at $99k.
Deal economics
- At list price, monthly cash flow is $285 ($3k/yr) — positive.
- The deal already cash-flows at list — no discount required.
- Meets the 1% rule at list price ($1k rent vs $99k).
- Recommended offer: $87k (12.0% below list) — sets the bar for market timing.
Location & tenants
- Location reads 74/100 on livability (#120 in NE, #4,631 nationally) — a middle-class / working-renter tenant base. Strengths: crime A+, cost of living A+, health & safety A+; Watch: schools D, amenities F, commute F.
- Kimball Public Schools (rural): math 39% / reading 43% proficiency, ranked #205 of 245 in NE (top 84%) — families likely to look elsewhere, expect single-tenant / working-renter base with shorter leases.
- Market conditions: 35 active listings in the ZIP; 12 units permitted in Kimball County in 2024 (0 in 5+ unit buildings).
Forward outlook
- Local home prices are declining (-3.0%/yr); year-one equity from $684 of loan paydown is wiped out by about $3k of value loss. Plan a longer hold.
- Kimball County population projected to shrink 9% by 2050 — rents likely to lag national; underwrite the cash flow, not the appreciation.
- At projected returns (-3.0% appreciation + 3.0% rent growth), your $28k cash investment doubles in ~10 years — after that, you're playing with house money.
Negotiation context
- It's been on market 122 days — a 12% lower offer ($87k) is reasonable based on typical stale-listing flexibility.
Risks & watch-outs
- Watch-outs: built in 1916 — expect roof / HVAC / electrical / plumbing capex.
Questions for the listing agent
- It's been on market 122 days. Have you received any prior offers? Is the seller open to a 12% concession, seller financing, or rate buy-down credit?
- Built in 1916 — when were the roof, HVAC, electrical panel, plumbing, and water heater last replaced?
- Why hasn't it sold? Are there any deal-killer items the seller is aware of (foundation, flood, title, zoning, code violations)?
- Is there a deadline driving the sale (1031 exchange, divorce, estate, relocation)? That informs how much negotiation room exists.
- Schools are D-rated, which usually means shorter tenancies and higher turnover. Who's the typical renter profile here, and what's been the actual vacancy rate?
- What's the average days-on-market for RENTAL listings here right now (not sales)? A rising rental-DOM trend means longer vacancies and softer asking-rent achievability than the comps imply.
- What's the recent tenant-quality profile in this submarket — average credit score on applications, eviction rate, late-payment / NSF rate, and stable-employment percentage? A property-management company in the area should have these aggregated.
- How much new for-sale + rental construction is in the pipeline within 1–3 miles? Heavy new supply typically softens prices + rents 12–24 months out; constrained supply supports both.
Investment metrics
- 1% rule
- 1.24% ✓
- Cap rate
- 9.75%
- Cash-on-cash
- 12.35%
- DSCR
- 1.55
- GRM
- 6.7
CMA / ARV
- ARV (median comp)
- $147,763
- List price
- $99,000
- Delta
- -33.00%
- Verdict
- UNDERPRICED
- Comps
- 20 within 1.0 mi
Show comp detail 12 sales within ~0.75 mi
| Address | Dist | Beds/Ba | Sqft | Sold | Price | $/sf | Match |
|---|---|---|---|---|---|---|---|
| 620 S Jefferson St | 0.60mi | 4/2.0 | 1,465 (-0%) | 1mo | $150,000 | $102 | 66 |
| 415 S Nadine St | 0.16mi | 4/2.0 | 1,652 (+13%) | 3mo | $285,000 | $173 | 65 |
| 706 S Howard St | 0.61mi | 4/2.0 | 1,424 (-3%) | 10mo | $190,000 | $133 | 54 |
| 801 S Walnut St | 0.47mi | 3/1.0 (-1) | 1,588 (+8%) | 7mo | $167,500 | $105 | 53 |
| 611 S Cedar St | 0.72mi | 4/3.0 | 1,424 (-3%) | 7mo | $275,000 | $193 | 48 |
| 3 Rodman Ct | 0.47mi | 4/2.0 | 1,272 (-13%) | 6mo | $145,000 | $114 | 47 |
| 500 S Webster St | 0.44mi | 5/2.0 (+1) | 1,276 (-13%) | 3mo | $282,000 | $221 | 46 |
| 713 S Maple St | 0.57mi | 4/2.0 | 1,282 (-13%) | 3mo | $187,000 | $146 | 46 |
| 311 S Walnut St | 0.23mi | 5/3.0 (+1) | 1,668 (+14%) | 9mo | $37,500 | $22 | 45 |
| 507 S Cedar St | 0.69mi | 3/3.0 (-1) | 1,482 (+1%) | 11mo | $105,000 | $71 | 44 |
| 412 S Webster St | 0.43mi | 4/3.0 | 1,302 (-11%) | 11mo | $155,000 | $119 | 44 |
| 405 S Cedar St | 0.66mi | 3/3.0 (-1) | 1,368 (-7%) | 8mo | $250,000 | $183 | 38 |
Match score weights: distance 35% · size 25% · config 20% · recency 20%. Top-matched comps best support the ARV.
Projected returns pro-forma
-3.0% appreciation · 3.0% rent growth · sell at horizon
- IRR
- 2.0%
- Equity multiple
- 1.08×
- Total profit
- $2,151
- Equity at exit
- $14,761
- IRR
- 11.6%
- Equity multiple
- 1.91×
- Total profit
- $25,351
- Equity at exit
- $8,560
Cash invested: $27,720 (down + closing). Projections, not guarantees.
Landlord ↔ Tenant lean methodology
- Overall (STATE)
- 83 Strongly Landlord-Friendly
- State Nebraska
- 83 Strongly Landlord-Friendly · R+13
- County
- — inherits STATE
- City
- — inherits STATE
ZIP-level market 69145
- Home prices YoY
- -34.5%
- Active inventory
- 35
- Price-to-rent
- 6.7×
Monthly cashflow live
- Estimated rent
- $1,227 medium interval (Pro) →
- Mortgage (P&I)
- −$519
- Tax est. 1.5%
- −$124 /mo · $1,485/yr
- Insurance
- −$41
- HOA
- −$0
- Vacancy / Maint / Mgmt
- −$258
- Net cashflow
- $285
Break-even live
UW: 25.0% down · 7.5% · 30yr · 1.5% tax · 5.0% vac · 8.0% maint · 8.0% mgmt
Financing live
Cash to close
- Down payment
- $24,750
- Closing costs
- $2,970
- Reserves months
- —
- Total cash needed
- —
Loan-product check · same deal, 3 products live
Conventional
25% down · 7.5% · 30yr
- Down + closing
- —
- Monthly P&I
- —
- Monthly cashflow
- —
- DSCR
- —
- Eligible?
- —
Personal DTI + credit; lowest rate.
DSCR
20% down · 8.5% · 30yr
- Down + closing
- —
- Monthly P&I
- —
- Monthly cashflow
- —
- DSCR
- —
- Eligible?
- —
No personal income docs; deal must DSCR.
Hard money
10% down · 12.0% · 12mo
- Down + closing
- —
- Monthly P&I
- —
- Monthly cashflow
- —
- DSCR
- —
- Eligible?
- —
Short-term bridge; refi at stabilization.
Listing history 16 events
-
2026-06-18days on market $99,000 Active 122 DOM
-
2026-06-17days on market $99,000 Active 121 DOM
-
2026-06-16days on market $99,000 Active 120 DOM
-
2026-06-15days on market $99,000 Active 119 DOM
-
2026-06-13days on market $99,000 Active 117 DOM
-
2026-06-12days on market $99,000 Active 116 DOM
-
2026-06-09days on market $99,000 Active 113 DOM
-
2026-06-08days on market $99,000 Active 112 DOM
-
2026-06-07days on market $99,000 Active 111 DOM
-
2026-06-05days on market $99,000 Active 109 DOM
-
2026-06-04days on market $99,000 Active 107 DOM
-
2026-06-02days on market $99,000 Active 106 DOM
-
2026-06-01days on market $99,000 Active 105 DOM
-
2026-05-31days on market $99,000 Active 104 DOM
-
2026-03-29price $99,000
-
2026-02-17$108,000 Active
ⓘ Source: listings_history table (triggers on properties + properties_extension) + one-shot
backfill from property_details.listing_events for pre-trigger history.
Climate risk First Street
- Flood 1/10 Low 0% chance over 30 yrs
- Wildfire 4/10 Moderate
- Heat 2/10 Low 7 d/yr ≥93°F today · 17 d/yr by 30 yrs out
- Wind 2/10 Low
- Air quality 2/10 Low 1 unhealthy d/yr today · 1 by 30 yrs out
Nearby sold comps map
Loading sold comps map…
Walkable amenities ~0.75 mi
Loading nearby amenities…
Taxation est. · year 1
- Rental income
- $14,727
- − Mortgage interest
- −$5,546
- − Property taxes
- −$1,485
- − Insurance
- −$495
- − Repairs & maintenance
- −$1,178
- − Management
- −$1,178
- − Depreciation
- −$2,880
- Taxable income
- $1,965
- Est. tax owed @ 24.0%
- −$472
- After-tax cash flow
- $2,953/yr
For passive investors: Depreciation is non-cash, so a rental often shows a tax loss while cash-flowing — sheltering income. Rental losses are passive: they offset passive income freely, and up to $25,000/yr can offset ordinary (W-2) income if you actively participate and your MAGI is under $100k (phasing out to $0 by $150k); unused losses carry forward. On sale, claimed depreciation is recaptured at up to 25%, and gains may owe capital-gains tax (a 1031 exchange can defer both). Figures are a year-1 estimate at your 24.0% rate — not tax advice; consult a CPA.
Schools (NCES district)
- District
- Kimball Public Schools
- NCES district ID
- 3172570
- Math proficiency
- 39% ▬ 0.00%
- Reading proficiency
- 43% ▲ 4.00%
- Median HH income
- $42,641
- Composite
- 37.0/100
- National rank
- #9092
- State rank
- #205 of 245 in NE
Livability — Kimball
- Score
- 74/100
- State rank
- #120
- US rank
- #4631
Category grades
Schools grade is shown separately in the Schools card above.
Census & demographics
- Census place
- Kimball, NE
- Population (ZIP)
- 2,583
Population outlook (Kimball County) Hauer SSP2
- Today (2025)
- 3,547 people
- By 2030
- 3,450 · -2.7%
- By 2040
- 3,302 · -6.9%
- By 2050
- 3,226 · -9.0%
- By 2075
- 3,329 · -6.1%
- By 2100
- 3,425 · -3.4%
Race, ethnicity, and origin ACS 2023
- Neighborhood character
- Predominantly White (84%)
- Race & ethnicity
- White 84% Hispanic / Latino 10% Two or more races 9% Native American 2% Black 2%
- Hispanic origin (detail)
- Mexican 8%
- Common ancestry
- Serbian 4% Italian 2% Portuguese 2%
- Foreign-born
- 3% · Canada
- Languages at home
- 96% English-only · Spanish 2%
Political lean MEDSL · Kimball
- 2024 margin
- Solid R (+67.0) · D 15.8% · R 82.8% · Other 1.4%
- 2008→2024 swing
- -16.9pp toward R · 2008: -50.1pp · 2024: -67.0pp
- All cycles
- 2024: R+67.0 2020: R+69.0 2016: R+66.6 2012: R+49.9 2008: R+50.1
Not yet ingested
- Civics
- —
Market trends
- HPI YoY
- ▼ -100.10%
- Current HPI
- 190.3732
- Rent YoY
- —
- Metro
- —
- State GDP YoY
- ▲ 0.68%
- F500 in state
- 2
Industry mix (Fortune 500 HQ in NE)
| Industry | F500 HQs | Revenue |
|---|---|---|
| Conglomerate | 1 | $371B |
|
||
Price history
-8.3% since first listed2 events — show timeline
- 2026-03-29 Price Changed $99,000 WNBOR
- 2026-02-17 Listed $108,000 WNBOR
Cash-flow waterfall
monthlySold comps — $/sqft
last 12 mo · ≤1 miLoading sold comps…