 Multi-family
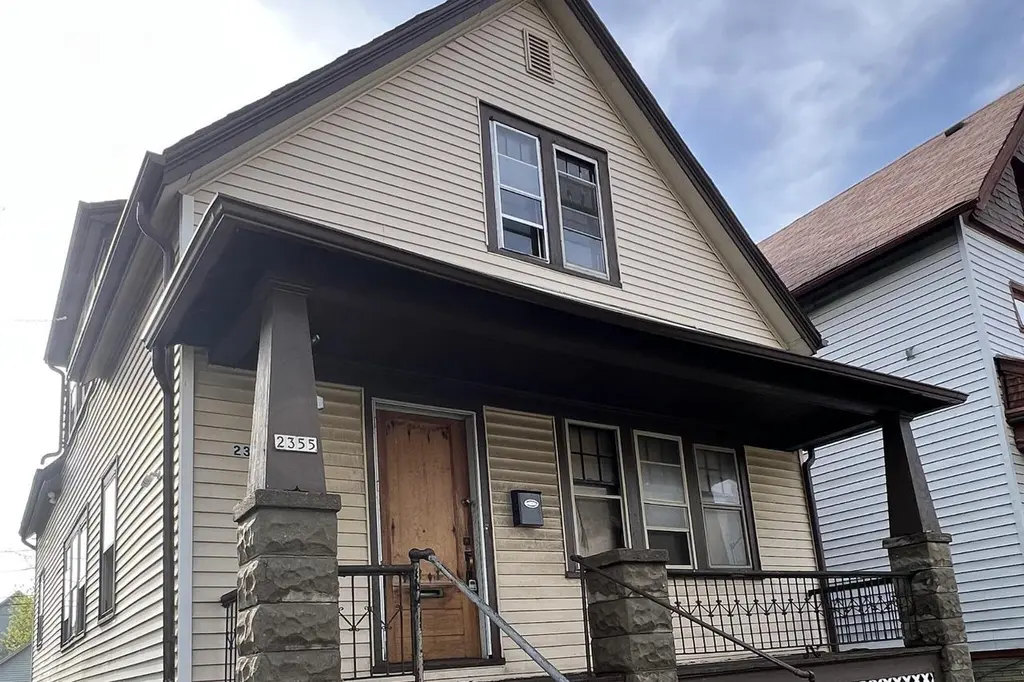
2355 N 20th St · Milwaukee, WI
Flood risk 3/10 · Minor
- FEMA flood zone
- X (unshaded)
- Chance of flooding over 30 yrs
- 0.1%
- Est. flood insurance / yr
- $473 – $860
Fire risk 1/10 · Minimal
- Est. fire insurance / yr
- $636 – $1,182
Heat risk 2/10 · Minimal
- Hot days now (above 98°F)
- 7 days/yr
- Hot days in 30 yrs
- 13 days/yr
Wind risk 2/10 · Minimal
- Chance of severe wind over 30 yrs
- —
Air-quality risk 3/10 · Minor
- Unhealthy air days now
- 3 days/yr
- Unhealthy air days in 30 yrs
- 4 days/yr
Risk factors via First Street. Map © Google.
Why this score? — see what drove the B grade
The composite is a weighted blend of 9 inputs, each scored 0–100. Each bar is that input's sub-score; the figure is the points it added to the 100-point composite (weight × sub-score).
- Cash flow +30.0/30.0
- DSCR +10.0/10.0
- Appreciation +10.0/10.0
- 1% rule +8.3/10.0
- Rent growth +4.6/5.0
- Livability +4.0/5.0
- Condition / age +2.5/5.0
- Schools +1.2/10.0
- ARV discount +0.0/15.0
$97,000
🖨 Deal sheet 📄 Offer letter ✓ Due diligence
Multi-family units
County records classify this as Multi-Family (2-4 Unit). Listing-text estimate: 1 unit. estimate disagrees with records
Listing remarks MLS
Investment | Single Family or Duplex | High Cash Flow Potential Flexible-use property recently renting for $1,450/month with low taxes -- strong cash flow from day one. Operate as a duplex or single family. Both units feature spacious kitchens with solid cabinet space and natural woodwork throughout. Off-street parking with alley access. Needs TLC -- priced to reflect. Bring your vision and add instant equity.
Key facts
- Natural woodwork
- Spacious kitchens
- Off-street parking
Tags
Property features AI
Exterior
- Parking: One off-street parking space; Two-car garage
- Utilities: Municipal water; Municipal sewer
- Home design: Single-family home; 1.5-story design; Less than 1/2 acre lot (approximately 0.09 acre); Zoned RT4
- Construction: Information source lists year built (assessor/public record)
- Exterior features: Vinyl exterior
Interior
- Kitchen: Kitchen on main level (12 x 11)
- Bedrooms: Main-level primary bedroom (11 x 10); Upper-level bedroom/kitchen area (11 x 10)
- Bathrooms: Two full bathrooms
- Heating & cooling: Radiant / hot water heating; Natural gas as heat source
- Interior features: Full basement; Shower over tub
Neighborhood map
What this means for you Summary
Snapshot
- This is a 3-bed/2.0-bath multifamily listed at $97k.
Deal economics
- At list price, monthly cash flow is $397 ($5k/yr) — positive.
- The deal already cash-flows at list — no discount required.
- Meets the 1% rule at list price ($1k rent vs $97k).
- Cap rate 11.2% vs local median 5.1% in Milwaukee — top-decile yield for the area; either an underpriced asset or a hidden risk that comps aren't pricing in. Stress-test before assuming the spread holds.
Location & tenants
- Location reads 81/100 on livability (#55 in WI, #1,534 nationally) — a professional / high-income tenant draw. Strengths: amenities A+, commute A+, cost of living A+; Watch: employment D+, schools F, crime F.
- Milwaukee School District (urban): math 10% / reading 18% proficiency, ranked #337 of 342 in WI (top 98%) — low school quality limits family demand, transient renter base, plan for 1-2y turnover; 77% free/reduced lunch — lower-income household profile, screen leases tightly.
- Market conditions: Rents rising fast (+8.3%/yr); 150 active listings in the ZIP; 32 comparable units currently listed for rent nearby; rentals at typical pace (median 15d on market — plan ~3-4 weeks tenant-placement turnaround); lower-income renter base — watch delinquency; 1,017 units permitted in Milwaukee County in 2024 (803 in 5+ unit buildings).
- At $1,293/mo this rent would consume 53% of the median local household income ($29k/yr) (locally 2061% of renters already pay >50% of income on rent) — very limited rent-growth headroom before tenants either downsize or default.
Forward outlook
- In year one you build about $10k of equity ($671 loan paydown + $10k appreciation (10.0% local appreciation)).
- Milwaukee County population projected at +4% by 2050 — modest demand growth; plan on rents tracking national, not racing it.
- At projected returns (10.0% appreciation + 8.0% rent growth), your $27k cash investment doubles in ~2 years — after that, you're playing with house money.
- By year 4, paydown + projected appreciation supports a ~$37k cash-out refi (75% LTV) — recoverable capital for the next deal without selling this one.
Negotiation context
- Only 7 days on market — expect competitive offers; lowballing is unlikely to land.
- 12 sale attempts since 14y ago with the ask held roughly flat each time — persistent listings suggest the price (not the market) is what's stuck; bring a comps-based counter.
Risks & watch-outs
- Watch-outs: built in 1890 — expect roof / HVAC / electrical / plumbing capex.
Questions for the listing agent
- Built in 1890 — when were the roof, HVAC, electrical panel, plumbing, and water heater last replaced?
- Is there a deadline driving the sale (1031 exchange, divorce, estate, relocation)? That informs how much negotiation room exists.
- Schools are F-rated, which usually means shorter tenancies and higher turnover. Who's the typical renter profile here, and what's been the actual vacancy rate?
- Crime grade is F in this area — have there been break-ins, vandalism, or insurance claims at this property in the last 3 years? What carrier currently insures it and at what premium?
- What's the average days-on-market for RENTAL listings here right now (not sales)? A rising rental-DOM trend means longer vacancies and softer asking-rent achievability than the comps imply.
- What's the recent tenant-quality profile in this submarket — average credit score on applications, eviction rate, late-payment / NSF rate, and stable-employment percentage? A property-management company in the area should have these aggregated.
- How much new apartment / multifamily construction is in the pipeline within 1–3 miles? Heavy new supply (>2% of stock underway) typically softens rents 12–24 months out; light construction supports rent growth.
Investment metrics
- 1% rule
- 1.33% ✓
- Cap rate
- 11.21%
- Cash-on-cash
- 17.55%
- DSCR
- 1.78
- GRM
- 6.3
CMA / ARV
- ARV (median comp)
- $67,226
- List price
- $97,000
- Delta
- 44.29%
- Verdict
- OVERPRICED
- Comps
- 20 within 1.0 mi
Show comp detail 7 sales within ~0.75 mi
| Address | Dist | Beds/Ba | Sqft | Sold | Price | $/sf | Match |
|---|---|---|---|---|---|---|---|
| 2638 N 22nd St | 0.37mi | 4/2.0 (+1) | 1,687 (+4%) | 3mo | $55,000 | $33 | 68 |
| 2245 N 16th St #2247 | 0.27mi | 4/2.0 (+1) | 1,521 (-6%) | 15mo | $40,000 | $26 | 60 |
| 2848 N 19th St | 0.63mi | 4/2.0 (+1) | 1,650 (+2%) | 3mo | $60,000 | $36 | 59 |
| 2747 N 16th St Unit 2747A | 0.54mi | 4/2.0 (+1) | 1,596 (-1%) | 18mo | $45,000 | $28 | 53 |
| 2828 W Meinecke Ave Unit 2828A | 0.60mi | 4/2.0 (+1) | 1,636 (+1%) | 23mo | $4,900 | $3 | 45 |
| 2926 N 17th St Unit 2926A | 0.74mi | 3/2.0 | 1,575 (-2%) | 20mo | $55,000 | $35 | 45 |
| 2741 N 25th St | 0.62mi | 4/2.0 (+1) | 1,713 (+6%) | 15mo | $75,000 | $44 | 44 |
Match score weights: distance 35% · size 25% · config 20% · recency 20%. Top-matched comps best support the ARV.
Projected returns pro-forma
10.0% appreciation · 8.0% rent growth · sell at horizon
- IRR
- 39.8%
- Equity multiple
- 4.13×
- Total profit
- $84,946
- Equity at exit
- $87,385
- IRR
- 36.2%
- Equity multiple
- 10.10×
- Total profit
- $247,166
- Equity at exit
- $188,450
Cash invested: $27,160 (down + closing). Projections, not guarantees.
Landlord ↔ Tenant lean methodology
- Overall (STATE)
- 73 Landlord-Friendly
- State Wisconsin
- 73 Landlord-Friendly · R+2
- County
- — inherits STATE
- City
- — inherits STATE
ZIP-level market 53206
- Rents YoY
- 8.3%
- Active inventory
- 150
- Price-to-rent
- 6.3×
Monthly cashflow live
- Estimated rent
- $1,293 high interval (Pro) →
- Mortgage (P&I)
- −$509
- Tax from tax record
- −$75 /mo · $900/yr
- Insurance
- −$40
- HOA
- −$0
- Vacancy / Maint / Mgmt
- −$271
- Net cashflow
- $397
Break-even live
UW: 25.0% down · 7.5% · 30yr · 1.5% tax · 5.0% vac · 8.0% maint · 8.0% mgmt
Financing live
Cash to close
- Down payment
- $24,250
- Closing costs
- $2,910
- Reserves months
- —
- Total cash needed
- —
Loan-product check · same deal, 3 products live
Conventional
25% down · 7.5% · 30yr
- Down + closing
- —
- Monthly P&I
- —
- Monthly cashflow
- —
- DSCR
- —
- Eligible?
- —
Personal DTI + credit; lowest rate.
DSCR
20% down · 8.5% · 30yr
- Down + closing
- —
- Monthly P&I
- —
- Monthly cashflow
- —
- DSCR
- —
- Eligible?
- —
No personal income docs; deal must DSCR.
Hard money
10% down · 12.0% · 12mo
- Down + closing
- —
- Monthly P&I
- —
- Monthly cashflow
- —
- DSCR
- —
- Eligible?
- —
Short-term bridge; refi at stabilization.
Rent comps 32 comps
| Address | Beds | Baths | Sqft | Rent | $/sqft | DOM | Units | Dist |
|---|---|---|---|---|---|---|---|---|
| 2308 W Clarke St Milwaukee, WI | 4.0 | 2.0 | 1545 | $1,750 | $1.13 | 23d | 1 | 0.34mi |
| 2119 W Brown St Milwaukee, WI | 3.0 | 1.0 | 1754 | $995 | $0.57 | 3d | 1 | 0.42mi |
| 2809 W Clarke St Unit 12811 Milwaukee, WI | 3.0 | 1.0 | 1400 | $1,200 | $0.86 | 17d | 1 | 0.62mi |
| 2765 N 26th St Unit 2 Milwaukee, WI | 2.0 | 1.0 | 1100 | $1,100 | $1.00 | 4d | 1 | 0.66mi |
| 2765 N 26th St Unit 1 Milwaukee, WI | 3.0 | 1.0 | 1125 | $1,200 | $1.07 | 4d | 1 | 0.66mi |
| 2201 N 32nd St Unit 2201 Milwaukee, WI | 3.0 | 1.0 | 1100 | $1,195 | $1.09 | 16d | 1 | 0.84mi |
| 2870 N 29th St #2872 Milwaukee, WI | 3.0 | 1.0 | 1300 | $1,250 | $0.96 | 44d | 1 | 0.86mi |
| 3100 W Center St Milwaukee, WI | 3.0 | 2.0 | 1174 | $1,531 | $1.30 | 1d | 1 | 0.88mi |
| 912 W Hadley St Milwaukee, WI | 2.0 | 1.0 | 2222 | $1,250 | $0.56 | 14d | 1 | 0.92mi |
| 2931 W Chambers St Milwaukee, WI | 2.0 | 1.0 | 1400 | $1,050 | $0.75 | 23d | 1 | 1.01mi |
| 3045 N 11th St #3047 Milwaukee, WI | 3.0 | 1.0 | 1065 | $1,175 | $1.10 | 4d | 1 | 1.05mi |
| 2419 W McKinley Ave Milwaukee, WI | 2.0 | 1.0 | 1852 | $1,200 | $0.65 | 44d | 1 | 1.07mi |
| 1639 N 33rd St Milwaukee, WI | 3.0 | 1.0 | 1424 | $950 | $0.67 | 23d | 1 | 1.11mi |
| 1239 N 26th St Unit 1 Milwaukee, WI | 3.0 | 1.0 | 1300 | $1,400 | $1.08 | 44d | 1 | 1.14mi |
| 1239 N 26th St Unit 1 Milwaukee, WI | 3.0 | 1.0 | 1300 | $1,400 | $1.08 | 44d | 1 | 1.14mi |
| 1515 N 32nd St Unit 1515 Milwaukee, WI | 3.0 | 1.0 | 1200 | $1,245 | $1.04 | 4d | 1 | 1.15mi |
| 2478-2480 W Juneau Ave Unit 2478 Milwaukee, WI | 4.0 | 1.0 | 1375 | $1,495 | $1.09 | 23d | 1 | 1.15mi |
| 1303 N 10th St Milwaukee, WI | 3.0 | 1.0–2.0 | 797 | $2,990 | $3.75 | 2d | 26 | 1.22mi |
| 2403-2405 N 39th St Unit 2403 Lower Milwaukee, WI | 3.0 | 1.0 | 1200 | $995 | $0.83 | 10d | 1 | 1.24mi |
| 2403-2405 N 39th St Unit 2405 Upper Milwaukee, WI | 3.0 | 1.0 | 1141 | $995 | $0.87 | 10d | 1 | 1.25mi |
| 2001 N 38th St #2003 Milwaukee, WI | 3.0 | 1.0 | 1326 | $950 | $0.72 | 2d | 1 | 1.25mi |
| 3025 N 6th St Milwaukee, WI | 2.0 | 1.0 | 1153 | $1,125 | $0.98 | 44d | 1 | 1.27mi |
| 1116 N 13th St Milwaukee, WI | 3.0 | 1.0 | 1400 | $1,345 | $0.96 | 14d | 1 | 1.28mi |
| 901 W Winnebago St Milwaukee, WI | 1.0–3.0 | 1.0–2.0 | 1359 | $2,629 | $1.93 | 2d | 10 | 1.28mi |
| 3124 N 33rd St Milwaukee, WI | 2.0 | 1.0 | 1200 | $1,200 | $1.00 | 44d | 1 | 1.28mi |
| 2821 W Concordia Ave Milwaukee, WI | 3.0 | 1.5 | 1098 | $1,595 | $1.45 | 2d | 1 | 1.30mi |
| 3416 N 17th St Unit 1 Milwaukee, WI | 3.0 | 1.0 | 1200 | $1,100 | $0.92 | 44d | 1 | 1.32mi |
| 2251 N 41st St Unit Lower Milwaukee, WI | 3.0 | 1.0 | 1187 | $1,198 | $1.01 | 14d | 1 | 1.37mi |
| 3388 N 27th St Unit 3388 Front House Milwaukee, WI | 4.0 | 1.0 | 1212 | $1,550 | $1.28 | 4d | 1 | 1.39mi |
| 2719 N 1st St Milwaukee, WI | 2.0 | 1.0 | 1300 | $1,095 | $0.84 | 14d | 1 | 1.41mi |
| 2106A W Keefe Ave Unit 2106 Lower Milwaukee, WI | 3.0 | 1.0 | 1300 | $1,100 | $0.85 | 17d | 1 | 1.42mi |
| 2110 N Palmer St Milwaukee, WI | 2.0 | 1.0 | 1100 | $1,985 | $1.80 | 4d | 1 | 1.47mi |
Listing history 43 events
-
2026-06-18days on market $97,000 Active 7 DOM
-
2026-06-17days on market $97,000 Active 6 DOM
-
2026-06-16days on market $97,000 Active 5 DOM
-
2026-06-15days on market $97,000 Active 4 DOM
-
2026-06-13days on market $97,000 Active 2 DOM
-
2026-06-13days on market $97,000 Active 1 DOM
-
2026-06-09days on market $97,000 Active 29 DOM
-
2026-06-08days on market $97,000 Active 28 DOM
-
2026-06-07days on market $97,000 Active 27 DOM
-
2026-06-05days on market $97,000 Active 24 DOM
-
2026-06-03pricedays on market $97,000 Active 23 DOM
Show marketing remark (413 chars)
Investment | Single Family or Duplex | High Cash Flow Potential Flexible-use property recently renting for $1,450/month with low taxes -- strong cash flow from day one. Operate as a duplex or single family. Both units feature spacious kitchens with solid cabinet space and natural woodwork throughout. Off-street parking with alley access. Needs TLC -- priced to reflect. Bring your vision and add instant equity.
-
2026-06-02days on market $100,000 Active 22 DOM
-
2026-06-01days on market $100,000 Active 21 DOM
-
2026-05-31days on market $100,000 Active 20 DOM
-
2026-05-07$100,000 Active 413-char remark
Show marketing remark (413 chars)
Investment | Single Family or Duplex | High Cash Flow Potential Flexible-use property recently renting for $1,450/month with low taxes -- strong cash flow from day one. Operate as a duplex or single family. Both units feature spacious kitchens with solid cabinet space and natural woodwork throughout. Off-street parking with alley access. Needs TLC -- priced to reflect. Bring your vision and add instant equity.
-
2023-05-31soldstatus $100,000
-
2021-07-01soldstatus $160,000
-
2021-06-03soldstatus $256,000
-
2020-04-14historical 70-char remark
Show marketing remark (70 chars)
This is a tax foreclosed property. Offers can be submitted at anytime.
-
2020-04-10soldstatus $5,000 Sold 70-char remark
Show marketing remark (70 chars)
This is a tax foreclosed property. Offers can be submitted at anytime.
-
2020-01-23$13,900 Active 70-char remark
Show marketing remark (70 chars)
This is a tax foreclosed property. Offers can be submitted at anytime.
-
2019-06-20historical
-
2019-02-15status Active
-
2019-01-14historical Contingent
-
2018-12-21$25,000 Active
-
2017-04-01historical
-
2017-02-09price $15,000
-
2017-02-09status Active
-
2017-02-01historical
-
2016-12-29price $19,900
-
2016-03-28$25,000 Active
-
2016-02-29historical
-
2015-09-01$25,000 Active
-
2012-02-17$49,900
-
2012-02-17historical
-
2012-01-21historical
-
2012-01-21$49,900
-
2012-01-21$64,900
-
2012-01-21historical
-
2012-01-21historical
-
2012-01-21$68,000
-
2008-07-15soldstatus $49,900
-
1983-08-01soldstatus $22,500
ⓘ Source: listings_history table (triggers on properties + properties_extension) + one-shot
backfill from property_details.listing_events for pre-trigger history.
Tax reassessment forecast WI · Partial reset (capped growth)
- Current annual tax
- $900 · $75/mo
- Projected year-2 tax
- $1,347 · $112/mo
- Expected delta
- +$447/yr (+$37/mo · 49.7%)
ⓘ Screening estimate from a state-policy table — verify with the county assessor before closing.
Climate risk First Street
- Flood 3/10 Moderate FEMA zone X (unshaded) · 10% chance over 30 yrs
- Wildfire 1/10 Low
- Heat 2/10 Low 7 d/yr ≥98°F today · 13 d/yr by 30 yrs out
- Wind 2/10 Low
- Air quality 3/10 Moderate 3 unhealthy d/yr today · 4 by 30 yrs out
Nearby sold comps map
Loading sold comps map…
Walkable amenities ~0.75 mi
Loading nearby amenities…
Taxation est. · year 1
- Rental income
- $15,513
- − Mortgage interest
- −$5,434
- − Property taxes
- −$900
- − Insurance
- −$485
- − Repairs & maintenance
- −$1,241
- − Management
- −$1,241
- − Depreciation
- −$2,822
- Taxable income
- $3,390
- Est. tax owed @ 24.0%
- −$814
- After-tax cash flow
- $3,952/yr
For passive investors: Depreciation is non-cash, so a rental often shows a tax loss while cash-flowing — sheltering income. Rental losses are passive: they offset passive income freely, and up to $25,000/yr can offset ordinary (W-2) income if you actively participate and your MAGI is under $100k (phasing out to $0 by $150k); unused losses carry forward. On sale, claimed depreciation is recaptured at up to 25%, and gains may owe capital-gains tax (a 1031 exchange can defer both). Figures are a year-1 estimate at your 24.0% rate — not tax advice; consult a CPA.
Schools (NCES district)
- District
- Milwaukee School District
- NCES district ID
- 5509600
- Math proficiency
- 10% ▼ -5.00%
- Reading proficiency
- 18% ▬ 0.00%
- Median HH income
- $36,339
- Composite
- 11.61/100
- National rank
- #9696
- State rank
- #337 of 342 in WI
Livability — Milwaukee
- Score
- 81/100
- State rank
- #55
- US rank
- #1534
Category grades
Schools grade is shown separately in the Schools card above.
Census & demographics
- Census place
- Milwaukee, WI
- County
- Milwaukee County · 926,379 people
- City population
- 573,768
- Metro
- Milwaukee-Waukesha, WI
- Population (ZIP)
- 19,887
- Household income
- $29,336
- Rent vs Own
- Severe rent burden
- 2061.0
Population outlook (Milwaukee County) Hauer SSP2
- Today (2025)
- 995,758 people
- By 2030
- 1,009,124 · +1.3%
- By 2040
- 1,028,128 · +3.3%
- By 2050
- 1,040,066 · +4.4%
- By 2075
- 1,057,849 · +6.2%
- By 2100
- 1,039,774 · +4.4%
Race, ethnicity, and origin ACS 2023
- Neighborhood character
- Predominantly Black (91%)
- Race & ethnicity
- Black 91% Two or more races 3% White 3% Hispanic / Latino 3%
- Common ancestry
- Norwegian 1%
- Foreign-born
- 1% · Canada
- Languages at home
- 97% English-only · Spanish 2%
Political lean MEDSL · Milwaukee
- 2024 margin
- Solid D (+38.5) · D 68.3% · R 29.8% · Other 1.8%
- 2008→2024 swing
- +2.7pp toward D · 2008: 35.9pp · 2024: 38.5pp
- All cycles
- 2024: D+38.5 2020: D+39.9 2016: D+37.5 2012: D+34.6 2008: D+35.9
Not yet ingested
- Civics
- —
Market trends
- HPI YoY
- ▲ 133.03%
- Current HPI
- 397.7151
- Rent YoY
- ▲ 8.28%
- Metro
- Milwaukee-Waukesha, WI
- State GDP YoY
- ▲ 2.10%
- F500 in state
- 20
Industry mix (Fortune 500 HQ in WI)
| Industry | F500 HQs | Revenue |
|---|---|---|
| Industrial Machinery | 4 | $23B |
|
||
| Industrial Technology | 2 | $36B |
|
||
| Insurance | 1 | $36B |
|
||
| Professional Services | 1 | $19B |
|
||
| Utilities | 1 | $9B |
|
||
| Consumer Goods | 1 | $3B |
|
||
Price history
+331.1% since first listed32 events — show timeline
- 2026-06-11 Listing Removed — METROMLS
- 2026-06-11 Listed $97,000 METROMLS
- 2026-06-03 Price Changed $97,000 METROMLS
- 2026-05-07 Listed $100,000 METROMLS
- 2023-05-31 Sold (Public Records) $100,000 Public Records
- 2021-07-01 Sold (Public Records) $160,000 Public Records
- 2021-06-03 Sold (Public Records) $256,000 Public Records
- 2020-04-14 Listing Removed — METROMLS
- 2020-04-10 Sold (MLS) $5,000 METROMLS
- 2020-01-23 Listed $13,900 METROMLS
- 2019-06-20 Listing Removed — METROMLS
- 2019-02-15 Relisted — METROMLS
- 2019-01-14 Contingent — METROMLS
- 2018-12-21 Listed $25,000 METROMLS
- 2017-04-01 Listing Removed — METROMLS
- 2017-02-09 Price Changed $15,000 METROMLS
- 2017-02-09 Relisted — METROMLS
- 2017-02-01 Listing Removed — METROMLS
- 2016-12-29 Price Changed $19,900 METROMLS
- 2016-03-28 Listed $25,000 METROMLS
- 2016-02-29 Listing Removed — METROMLS
- 2015-09-01 Listed $25,000 METROMLS
- 2012-02-17 Listed $49,900 METROMLS
- 2012-02-17 Listing Removed — METROMLS
- 2012-01-21 Listing Removed — METROMLS
- 2012-01-21 Listed $49,900 METROMLS
- 2012-01-21 Listed $64,900 METROMLS
- 2012-01-21 Listing Removed — METROMLS
- 2012-01-21 Listed $68,000 METROMLS
- 2012-01-21 Listing Removed — METROMLS
- 2008-07-15 Sold (MLS) $49,900 METROMLS
- 1983-08-01 Sold (Public Records) $22,500 Public Records
Property tax history
-4.9%/yrLatest (2024): $900 · +36.4% YoY. Source: county tax records.
Cash-flow waterfall
monthlySold comps — $/sqft
last 12 mo · ≤1 miLoading sold comps…