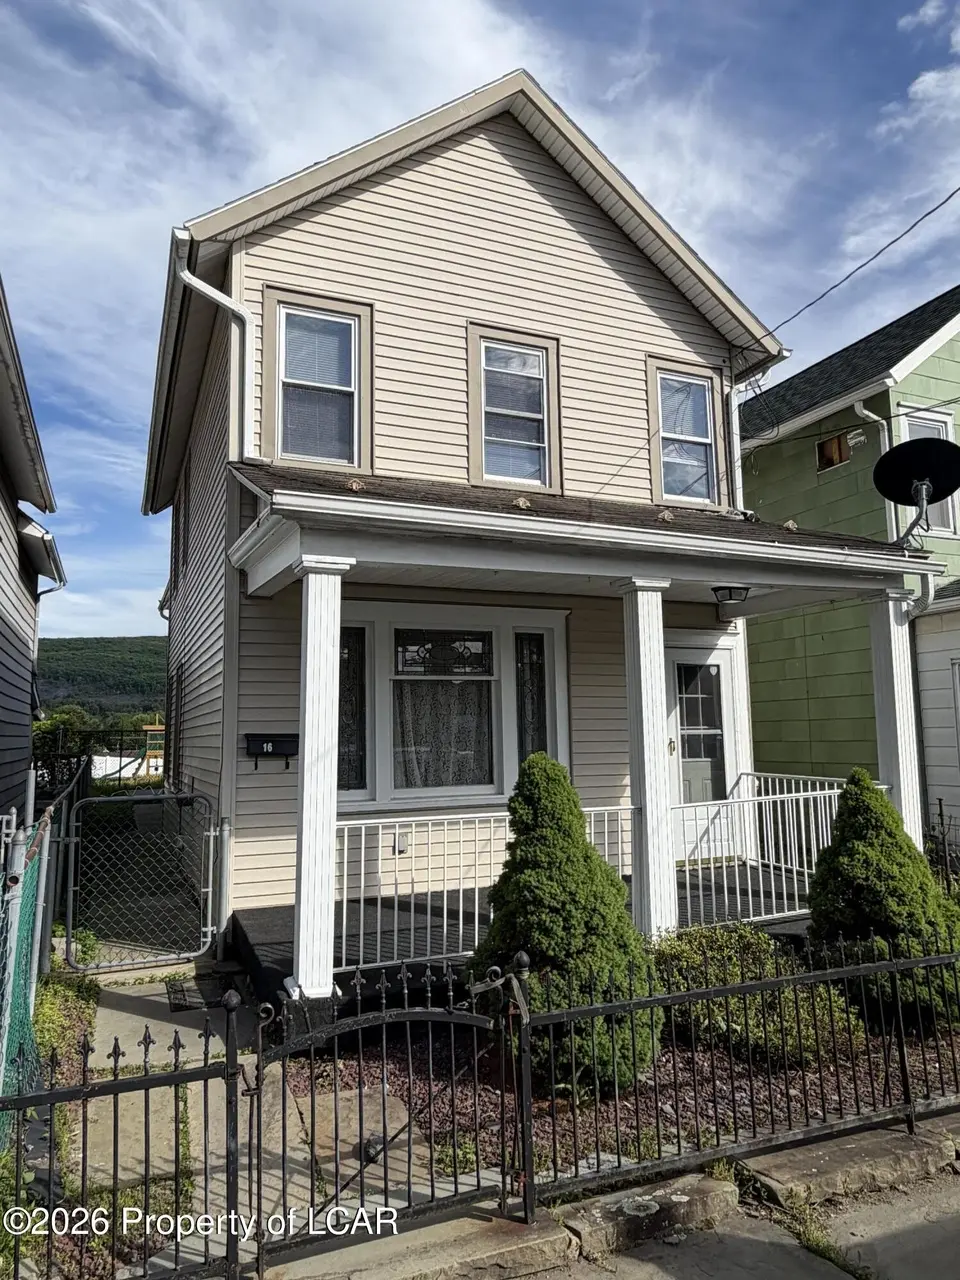
16 Green St · Ashley, PA
Flood risk 1/10 · Minimal
- FEMA flood zone
- X (unshaded)
- Chance of flooding over 30 yrs
- 0.0%
- Est. flood insurance / yr
- $507 – $1,088
Fire risk 3/10 · Minor
- Est. fire insurance / yr
- $511 – $949
Heat risk 4/10 · Minor
- Hot days now (above 94°F)
- 7 days/yr
- Hot days in 30 yrs
- 16 days/yr
Wind risk 3/10 · Minor
- Chance of severe wind over 30 yrs
- 6.0%
Air-quality risk 2/10 · Minimal
- Unhealthy air days now
- 1 days/yr
- Unhealthy air days in 30 yrs
- 2 days/yr
Risk factors via First Street. Map © Google.
Why this score? — see what drove the D+ grade
The composite is a weighted blend of 9 inputs, each scored 0–100. Each bar is that input's sub-score; the figure is the points it added to the 100-point composite (weight × sub-score).
- Cash flow +20.9/30.0
- DSCR +6.6/10.0
- ARV discount +6.2/15.0
- 1% rule +5.1/10.0
- Livability +3.8/5.0
- Rent growth +2.5/5.0
- Condition / age +2.5/5.0
- Schools +1.9/10.0
- Appreciation +0.0/10.0
$159,900
🖨 Deal sheet 📄 Offer letter ✓ Due diligence
Listing remarks
REQUESTING ALL OFFERS IN BY 6.6.26 at 12 NOON. Freshly updated and move in ready! This 4Bed 1-1/2 bath offers easy living in Ashley! New Carpets, Fresh Paint and tons of charm. First floor laundry, rear patio with fenced in area for security. Built in's in laundry room for extra storage! Gas heat & hot water. Low maintenance home!
Key facts
- Fenced in area
- First floor laundry
- Gas heat
Tags
Property features AI
Exterior
- Utilities: Public water; Public sewer
- Home design: Single-family residence; Two levels
- Construction: Vinyl siding
- Exterior features: Patio; Fenced yard
Interior
- Kitchen: Pantry; Eat-in kitchen
- Bathrooms: 1 full bathroom; 1 half bathroom
- Heating & cooling: Natural gas heating; Hot water heating; Radiant heating
- Interior features: Pantry; Eat-in kitchen; Has basement; 8 total rooms
- Laundry & utility: Electric water heater; Gas water heater
Neighborhood map
What this means for you Summary
Snapshot
- This is a 4-bed/1.5-bath single-family listed at $160k.
Deal economics
- At list price, monthly cash flow is $221 ($3k/yr) — positive.
- The deal already cash-flows at list — no discount required.
- Meets the 1% rule at list price ($2k rent vs $160k).
Location & tenants
- Location reads 75/100 on livability (#466 in PA, #4,297 nationally) — a middle-class / working-renter tenant base. Strengths: cost of living A+, health & safety A+, housing B; Watch: crime C-, schools F, commute F.
- Hanover Area SD (suburban): math 19% / reading 25% proficiency, ranked #484 of 539 in PA (top 90%) — low school quality limits family demand, transient renter base, plan for 1-2y turnover.
- Market conditions: 81 active listings in the ZIP; 18 comparable units currently listed for rent nearby; rentals at typical pace (median 21d on market — plan ~3-4 weeks tenant-placement turnaround); 349 units permitted in Luzerne County in 2024 (16 in 5+ unit buildings).
- This rent runs 33% of the median local income ($59k/yr) — at the standard rent-burdened threshold; future hikes will face affordability resistance.
Forward outlook
- Local home prices are declining (-3.0%/yr); year-one equity from $1k of loan paydown is wiped out by about $5k of value loss. Plan a longer hold.
- Luzerne County population projected at +4% by 2050 — modest demand growth; plan on rents tracking national, not racing it.
Negotiation context
- Only 9 days on market — expect competitive offers; lowballing is unlikely to land.
- Current owner paid $55k; list at $160k implies a 191% gain — meaningful room to come down on a strong offer.
Risks & watch-outs
- Watch-outs: built in 1910 — expect roof / HVAC / electrical / plumbing capex.
Questions for the listing agent
- Built in 1910 — when were the roof, HVAC, electrical panel, plumbing, and water heater last replaced?
- Is there a deadline driving the sale (1031 exchange, divorce, estate, relocation)? That informs how much negotiation room exists.
- Schools are F-rated, which usually means shorter tenancies and higher turnover. Who's the typical renter profile here, and what's been the actual vacancy rate?
- The area grade is low — what's the realistic commute time and amenity access for the typical tenant pool here? Any planned neighborhood developments (good or bad) we should know about?
- What's the average days-on-market for RENTAL listings here right now (not sales)? A rising rental-DOM trend means longer vacancies and softer asking-rent achievability than the comps imply.
- What's the recent tenant-quality profile in this submarket — average credit score on applications, eviction rate, late-payment / NSF rate, and stable-employment percentage? A property-management company in the area should have these aggregated.
- How much new for-sale + rental construction is in the pipeline within 1–3 miles? Heavy new supply typically softens prices + rents 12–24 months out; constrained supply supports both.
Investment metrics
- 1% rule
- 1.01% ✓
- Cap rate
- 7.95%
- Cash-on-cash
- 5.92%
- DSCR
- 1.26
- GRM
- 8.2
CMA / ARV
- ARV (on-the-fly)
- $155,520
- Comps found
- 12
Show comp detail 12 sales within ~0.75 mi
| Address | Dist | Beds/Ba | Sqft | Sold | Price | $/sf | Match |
|---|---|---|---|---|---|---|---|
| 85 Brown St | 0.05mi | 3/1.0 (-1) | 1,422 (-1%) | 4mo | $140,000 | $98 | 85 |
| 28 Manhattan St | 0.17mi | 4/1.5 | 1,408 (-2%) | 4mo | $150,000 | $107 | 85 |
| 84 Hartford St | 0.11mi | 3/2.0 (-1) | 1,360 (-6%) | 4mo | $109,000 | $80 | 75 |
| 323 Andover St | 0.45mi | 4/1.0 | 1,472 (+2%) | 3mo | $152,000 | $103 | 70 |
| 2 Charles St | 0.43mi | 3/1.5 (-1) | 1,466 (+2%) | 4mo | $221,000 | $151 | 69 |
| 17 Manhattan St | 0.22mi | 3/1.5 (-1) | 1,256 (-13%) | 1mo | $154,000 | $123 | 63 |
| 223 Poplar St | 0.55mi | 3/1.0 (-1) | 1,476 (+2%) | 1mo | $220,000 | $149 | 62 |
| 21 W Hartford St | 0.24mi | 3/1.0 (-1) | 1,258 (-13%) | 3mo | $123,600 | $98 | 58 |
| 41 Ross St | 0.29mi | 4/1.0 | 1,648 (+14%) | 5mo | $184,000 | $112 | 57 |
| 82 Newport St | 0.39mi | 3/2.0 (-1) | 1,600 (+11%) | 1mo | $265,000 | $166 | 56 |
| 287 Andover St | 0.48mi | 3/2.0 (-1) | 1,312 (-9%) | 2mo | $120,000 | $91 | 55 |
| 421 Andover St | 0.43mi | 3/1.0 (-1) | 1,616 (+12%) | 1mo | $175,000 | $108 | 52 |
Match score weights: distance 35% · size 25% · config 20% · recency 20%. Top-matched comps best support the ARV.
Projected returns pro-forma
-3.0% appreciation · 3.0% rent growth · sell at horizon
- IRR
- -7.2%
- Equity multiple
- 0.74×
- Total profit
- $-11,840
- Equity at exit
- $23,842
- IRR
- 2.4%
- Equity multiple
- 1.17×
- Total profit
- $7,794
- Equity at exit
- $13,825
Cash invested: $44,772 (down + closing). Projections, not guarantees.
Landlord ↔ Tenant lean methodology
- Overall (STATE)
- 62 Landlord-Friendly
- State Pennsylvania
- 62 Landlord-Friendly · EVEN
- County
- — inherits STATE
- City
- — inherits STATE
ZIP-level market 18706
- Active inventory
- 81
- Price-to-rent
- 8.2×
Monthly cashflow live
- Estimated rent
- $1,617 high interval (Pro) →
- Mortgage (P&I)
- −$839
- Tax from tax record
- −$152 /mo · $1,819/yr
- Insurance
- −$67
- HOA
- −$0
- Vacancy / Maint / Mgmt
- −$340
- Net cashflow
- $221
Break-even live
UW: 25.0% down · 7.5% · 30yr · 1.5% tax · 5.0% vac · 8.0% maint · 8.0% mgmt
Financing live
Cash to close
- Down payment
- $39,975
- Closing costs
- $4,797
- Reserves months
- —
- Total cash needed
- —
Loan-product check · same deal, 3 products live
Conventional
25% down · 7.5% · 30yr
- Down + closing
- —
- Monthly P&I
- —
- Monthly cashflow
- —
- DSCR
- —
- Eligible?
- —
Personal DTI + credit; lowest rate.
DSCR
20% down · 8.5% · 30yr
- Down + closing
- —
- Monthly P&I
- —
- Monthly cashflow
- —
- DSCR
- —
- Eligible?
- —
No personal income docs; deal must DSCR.
Hard money
10% down · 12.0% · 12mo
- Down + closing
- —
- Monthly P&I
- —
- Monthly cashflow
- —
- DSCR
- —
- Eligible?
- —
Short-term bridge; refi at stabilization.
Rent comps 18 comps
| Address | Beds | Baths | Sqft | Rent | $/sqft | DOM | Units | Dist |
|---|---|---|---|---|---|---|---|---|
| 233 Gilligan St Wilkes Barre, PA | 3.0 | 1.0 | 1440 | $1,600 | $1.11 | 21d | 1 | 0.35mi |
| 239 Poplar St Wilkes Barre, PA | 3.0 | 1.5 | 1100 | $1,350 | $1.23 | 43d | 1 | 0.51mi |
| 407 McLean St Wilkes Barre, PA | 3.0 | 1.0 | 1482 | $1,400 | $0.94 | 13d | 1 | 0.53mi |
| 44 Eagle Ct Wilkes Barre, PA | 1.0–3.0 | 1.0–1.5 | 910 | $1,999 | $2.20 | 13d | 5 | 0.61mi |
| 134 Nicholson St Unit 3 Wilkes-Barre Township, PA | 4.0 | 1.0 | 1200 | $1,500 | $1.25 | 13d | 1 | 0.63mi |
| 134 Nicholson St Wilkes Barre, PA | 4.0 | 1.0 | 1200 | $1,600 | $1.33 | 21d | 1 | 0.63mi |
| 96 McLean St Wilkes-Barre Township, PA | 3.0 | 1.0 | 1535 | $1,550 | $1.01 | 43d | 1 | 0.71mi |
| 68 Circle Dr Hanover Township, PA | 3.0 | 1.5 | 950 | $1,800 | $1.89 | 13d | 1 | 0.75mi |
| 26 Bradford St Wilkes Barre, PA | 3.0 | 1.5 | 1056 | $1,400 | $1.33 | 13d | 1 | 0.78mi |
| 32 Murray St Unit 34 Wilkes-Barre, PA | 3.0 | 1.0 | 930 | $1,100 | $1.18 | 21d | 1 | 0.85mi |
| 284 Barney St Wilkes Barre, PA | 3.0 | 1.0 | 1070 | $1,600 | $1.50 | 44d | 1 | 1.04mi |
| 279 Hazle St Wilkes Barre, PA | 5.0 | 1.0 | 1400 | $1,400 | $1.00 | 13d | 1 | 1.06mi |
| 100 Westminster St Wilkes Barre, PA | 4.0 | 1.0 | 1150 | $1,400 | $1.22 | 13d | 1 | 1.11mi |
| 56 Kent Ln Wilkes Barre, PA | 3.0 | 2.0 | 1542 | $1,800 | $1.17 | 43d | 1 | 1.25mi |
| 216 Horton St Wilkes Barre, PA | 3.0 | 1.5 | 1475 | $1,575 | $1.07 | 43d | 1 | 1.26mi |
| 1259 Sively St Wilkes-Barre, PA | 3.0 | 1.0 | 1232 | $1,550 | $1.26 | 43d | 1 | 1.30mi |
| 27 Oak St Wilkes Barre, PA | 3.0 | 1.5 | 1500 | $1,700 | $1.13 | 43d | 1 | 1.43mi |
| 342 Horton St Wilkes Barre, PA | 3.0 | 1.5 | 1472 | $1,650 | $1.12 | 13d | 1 | 1.48mi |
Listing history 8 events
-
2026-06-08status $159,900 Pending 9 DOM
-
2026-06-07remarks 334-char remark
-
2026-06-07days on market $159,900 Active 9 DOM
-
2026-06-02days on market $159,900 Active 4 DOM
-
2026-06-01days on market $159,900 Active 3 DOM
-
2026-05-31days on market $159,900 Active 2 DOM
-
2026-05-30remarks 287-char remark
-
2026-05-30$159,900 Active 1 DOM
ⓘ Source: listings_history table (triggers on properties + properties_extension) + one-shot
backfill from property_details.listing_events for pre-trigger history.
Tax reassessment forecast PA · Partial reset (capped growth)
- Current annual tax
- $1,819 · $152/mo
- Projected year-2 tax
- $2,173 · $181/mo
- Expected delta
- +$354/yr (+$29/mo · 19.4%)
ⓘ Screening estimate from a state-policy table — verify with the county assessor before closing.
Climate risk First Street
- Flood 1/10 Low FEMA zone X (unshaded) · 0% chance over 30 yrs
- Wildfire 3/10 Moderate
- Heat 4/10 Moderate 7 d/yr ≥94°F today · 16 d/yr by 30 yrs out
- Wind 3/10 Moderate 6% chance of damaging wind over 30 yrs
- Air quality 2/10 Low 1 unhealthy d/yr today · 2 by 30 yrs out
Nearby sold comps map
Loading sold comps map…
Walkable amenities ~0.75 mi
Loading nearby amenities…
Taxation est. · year 1
- Rental income
- $19,409
- − Mortgage interest
- −$8,957
- − Property taxes
- −$1,819
- − Insurance
- −$800
- − Repairs & maintenance
- −$1,553
- − Management
- −$1,553
- − Depreciation
- −$4,652
- Taxable income
- $76
- Est. tax owed @ 24.0%
- −$18
- After-tax cash flow
- $2,634/yr
For passive investors: Depreciation is non-cash, so a rental often shows a tax loss while cash-flowing — sheltering income. Rental losses are passive: they offset passive income freely, and up to $25,000/yr can offset ordinary (W-2) income if you actively participate and your MAGI is under $100k (phasing out to $0 by $150k); unused losses carry forward. On sale, claimed depreciation is recaptured at up to 25%, and gains may owe capital-gains tax (a 1031 exchange can defer both). Figures are a year-1 estimate at your 24.0% rate — not tax advice; consult a CPA.
Schools (NCES district)
- District
- Hanover Area SD
- NCES district ID
- 4211420
- Math proficiency
- 19% ▼ -3.00%
- Reading proficiency
- 25% ▼ -21.00%
- Median HH income
- $40,015
- Composite
- 18.6/100
- National rank
- #8903
- State rank
- #484 of 539 in PA
Livability — Ashley
- Score
- 75/100
- State rank
- #466
- US rank
- #4297
Category grades
Schools grade is shown separately in the Schools card above.
Census & demographics
- Census place
- Ashley, PA
- County
- Luzerne County · 118,885 people
- Metro
- Scranton--Wilkes-Barre, PA
- Population (ZIP)
- 16,387
- Household income
- $58,558
- Rent vs Own
- Severe rent burden
- 568.0
Population outlook (Luzerne County) Hauer SSP2
- Today (2025)
- 319,505 people
- By 2030
- 319,943 · +0.1%
- By 2040
- 322,643 · +1.0%
- By 2050
- 330,817 · +3.5%
- By 2075
- 379,145 · +18.7%
- By 2100
- 431,908 · +35.2%
Race, ethnicity, and origin ACS 2023
- Neighborhood character
- Predominantly White (76%)
- Race & ethnicity
- White 76% Hispanic / Latino 17% Two or more races 11% Black 3%
- Hispanic origin (detail)
- Puerto Rican 9% Dominican 4%
- Common ancestry
- Romanian 18% Scotch-Irish 3% Subsaharan African 1%
- Foreign-born
- 6% · Canada
- Languages at home
- 88% English-only · Spanish 10% Other Asian/Pacific 1%
Political lean MEDSL · Luzerne
- 2024 margin
- R (+19.2) · D 40.0% · R 59.2%
- 2008→2024 swing
- -27.6pp toward R · 2008: 8.4pp · 2024: -19.2pp
- All cycles
- 2024: R+19.2 2020: R+14.4 2016: R+19.6 2012: D+4.8 2008: D+8.4
Not yet ingested
- Civics
- —
Market trends
- HPI YoY
- ▼ -150.02%
- Current HPI
- 196.19
- Rent YoY
- —
- Metro
- Scranton--Wilkes-Barre, PA
- State GDP YoY
- ▲ 1.68%
- F500 in state
- 34
Industry mix (Fortune 500 HQ in PA)
| Industry | F500 HQs | Revenue |
|---|---|---|
| Healthcare | 2 | $309B |
|
||
| Insurance | 2 | $27B |
|
||
| Telecommunications / Media | 1 | $124B |
|
||
| Industrial Distribution | 1 | $22B |
|
||
| Financial Services | 1 | $20B |
|
||
| Chemicals / Materials | 1 | $18B |
|
||
Price history
+190.7% since first listed2 events — show timeline
- 2026-05-29 Listed $159,900 LCAR
- 2026-02-27 Sold (Public Records) $55,000 Public Records
Property tax history
+1.7%/yrLatest (2026): $1,819 · +10.3% YoY. Source: county tax records.
Cash-flow waterfall
monthlySold comps — $/sqft
last 12 mo · ≤1 miLoading sold comps…