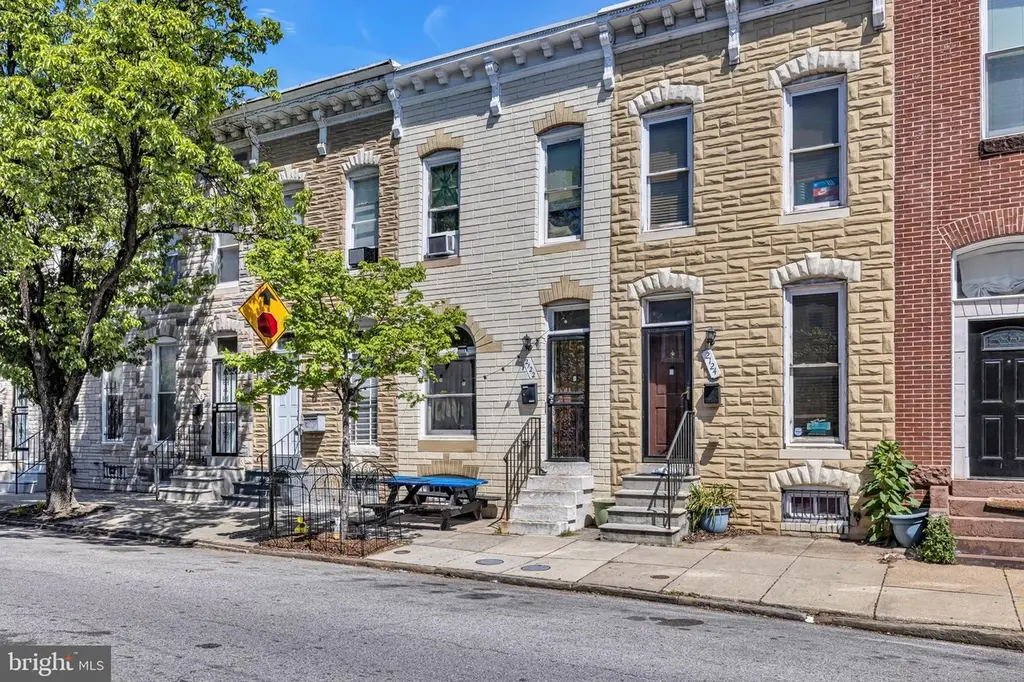
2122 Jefferson St · Baltimore, MD
Flood risk 1/10 · Minimal
- FEMA flood zone
- X (unshaded)
- Chance of flooding over 30 yrs
- 0.0%
- Est. flood insurance / yr
- $473 – $860
Fire risk 1/10 · Minimal
- Est. fire insurance / yr
- $755 – $1,403
Heat risk 8/10 · Major
- Hot days now (above 103°F)
- 7 days/yr
- Hot days in 30 yrs
- 15 days/yr
Wind risk 6/10 · Moderate
- Chance of severe wind over 30 yrs
- 27.0%
Air-quality risk 4/10 · Minor
- Unhealthy air days now
- 6 days/yr
- Unhealthy air days in 30 yrs
- 7 days/yr
Risk factors via First Street. Map © Google.
Why this score? — see what drove the B+ grade
The composite is a weighted blend of 9 inputs, each scored 0–100. Each bar is that input's sub-score; the figure is the points it added to the 100-point composite (weight × sub-score).
- Cash flow +30.0/30.0
- ARV discount +15.0/15.0
- 1% rule +10.0/10.0
- DSCR +10.0/10.0
- Rent growth +5.0/5.0
- Livability +3.8/5.0
- Condition / age +2.5/5.0
- Schools +1.0/10.0
- Appreciation +0.0/10.0
$117,900
🖨 Deal sheet 📄 Offer letter ✓ Due diligence
Key facts
- Built 1920
- Listed 41 days
Property features AI
Exterior
- Parking: On-street parking
- Utilities: Public water; Public sewer
- Home design: Interior townhouse/rowhouse; Fee simple ownership
- Construction: Brick construction; Block foundation; Above-grade and below-grade structures
- Exterior features: No tidal water
Interior
- Bedrooms: 3 bedrooms on the main level
- Bathrooms: 1 full bathroom on the main level; 1 full bathroom total
- Heating & cooling: Other heating; Other cooling; 60+ gallon hot water tank
- Interior features: Partially finished basement; Improved basement
Neighborhood map
What this means for you Summary
Snapshot
- This is a 3-bed/1.0-bath townhouse listed at $118k.
Deal economics
- At list price, monthly cash flow is $733 ($9k/yr) — positive.
- The deal already cash-flows at list — no discount required.
- Meets the 1% rule at list price ($2k rent vs $118k).
- Recommended offer: $114k (3.0% below list) — sets the bar for market timing.
- Cap rate 13.8% vs local median 6.0% in Baltimore — top-decile yield for the area; either an underpriced asset or a hidden risk that comps aren't pricing in. Stress-test before assuming the spread holds.
Location & tenants
- Location reads 76/100 on livability (#90 in MD, #3,396 nationally) — a middle-class / working-renter tenant base. Strengths: amenities A+, commute A+, housing A+; Watch: schools D, crime F.
- Baltimore City Public Schools (urban): math 7% / reading 16% proficiency, ranked #24 of 24 in MD (top 100%) — low school quality limits family demand, transient renter base, plan for 1-2y turnover; 79% free/reduced lunch — lower-income household profile, screen leases tightly.
- Market conditions: Rents rising fast (+9.9%/yr); 143 active listings in the ZIP; 40 comparable units currently listed for rent nearby; rentals lingering (median 44d on market — plan ~5-8 weeks vacancy on turnover, expect pricing pressure); 58% of comp listings sitting > 30 days — soft ceiling on asking rent; lower-income renter base — watch delinquency; 1,273 units permitted in Baltimore city in 2024 (1,104 in 5+ unit buildings).
- At $1,995/mo this rent would consume 55% of the median local household income ($43k/yr) (locally 966% of renters already pay >50% of income on rent) — very limited rent-growth headroom before tenants either downsize or default.
Forward outlook
- Local home prices are declining (-3.0%/yr); year-one equity from $815 of loan paydown is wiped out by about $4k of value loss. Plan a longer hold.
- Baltimore County population projected to shrink 4% by 2050 — rents likely to lag national; underwrite the cash flow, not the appreciation.
- At projected returns (-3.0% appreciation + 8.0% rent growth), your $33k cash investment doubles in ~4 years — after that, you're playing with house money.
Negotiation context
- It's been on market 41 days — a 3% lower offer ($114k) is reasonable based on typical stale-listing flexibility.
- Current owner paid $85k; 39% above their basis — modest negotiation headroom, anchor on the comps not their cost.
Risks & watch-outs
- Watch-outs: built in 1920 — expect roof / HVAC / electrical / plumbing capex.
- Climate carrying-cost: major wind risk, 27% chance of damaging wind over 30y; extreme-heat days projected 7→15/yr by 2055 (HVAC capex compounding) — expect insurance premiums to compound above CPI over the hold.
Questions for the listing agent
- It's been on market 41 days. Have you received any prior offers? Is the seller open to a 3% concession, seller financing, or rate buy-down credit?
- Built in 1920 — when were the roof, HVAC, electrical panel, plumbing, and water heater last replaced?
- Is there a deadline driving the sale (1031 exchange, divorce, estate, relocation)? That informs how much negotiation room exists.
- Schools are D-rated, which usually means shorter tenancies and higher turnover. Who's the typical renter profile here, and what's been the actual vacancy rate?
- Crime grade is F in this area — have there been break-ins, vandalism, or insurance claims at this property in the last 3 years? What carrier currently insures it and at what premium?
- What's the average days-on-market for RENTAL listings here right now (not sales)? A rising rental-DOM trend means longer vacancies and softer asking-rent achievability than the comps imply.
- What's the recent tenant-quality profile in this submarket — average credit score on applications, eviction rate, late-payment / NSF rate, and stable-employment percentage? A property-management company in the area should have these aggregated.
- How much new for-sale + rental construction is in the pipeline within 1–3 miles? Heavy new supply typically softens prices + rents 12–24 months out; constrained supply supports both.
Investment metrics
- 1% rule
- 1.69% ✓
- Cap rate
- 13.76%
- Cash-on-cash
- 26.66%
- DSCR
- 2.19
- GRM
- 4.9
CMA / ARV
- ARV (median comp)
- $175,420
- List price
- $117,900
- Delta
- -32.79%
- Verdict
- UNDERPRICED
- Comps
- 20 within 1.0 mi
Show comp detail 12 sales within ~0.75 mi
| Address | Dist | Beds/Ba | Sqft | Sold | Price | $/sf | Match |
|---|---|---|---|---|---|---|---|
| 220 N Luzerne Ave | 0.34mi | 3/1.0 | 1,372 (-6%) | 1mo | $120,000 | $87 | 73 |
| 14 N Wolfe St N | 0.37mi | 2/2.0 (-1) | 1,424 (-3%) | 1mo | $292,000 | $205 | 69 |
| 18 S Washington St | 0.41mi | 3/3.0 | 1,410 (-4%) | 0mo | $318,000 | $226 | 66 |
| 2220 Henneman Ave | 0.52mi | 3/2.5 | 1,440 (-2%) | 1mo | $190,000 | $132 | 66 |
| 219 S Washington St | 0.57mi | 3/2.0 | 1,434 (-2%) | 0mo | $350,000 | $244 | 66 |
| 410 N Chester St | 0.08mi | 2/1.5 (-1) | 1,260 (-14%) | 0mo | $180,000 | $143 | 66 |
| 2435 Jefferson St | 0.23mi | 3/1.0 | 1,260 (-14%) | 1mo | $140,000 | $111 | 66 |
| 145 N Milton Ave | 0.32mi | 2/2.0 (-1) | 1,353 (-8%) | 1mo | $260,000 | $192 | 63 |
| 317 S Collington | 0.65mi | 3/2.5 | 1,440 (-2%) | 1mo | $365,000 | $253 | 60 |
| 1009 N Washington St N | 0.43mi | 2/2.5 (-1) | 1,386 (-5%) | 0mo | $235,000 | $170 | 60 |
| 36 N Decker Ave | 0.71mi | 3/2.0 | 1,430 (-2%) | 0mo | $325,000 | $227 | 58 |
| 411 S Chester St | 0.70mi | 2/2.0 (-1) | 1,491 (+2%) | 1mo | $360,000 | $241 | 55 |
Match score weights: distance 35% · size 25% · config 20% · recency 20%. Top-matched comps best support the ARV.
Projected returns pro-forma
-3.0% appreciation · 8.0% rent growth · sell at horizon
- IRR
- 26.2%
- Equity multiple
- 2.16×
- Total profit
- $38,197
- Equity at exit
- $17,579
- IRR
- 36.8%
- Equity multiple
- 5.29×
- Total profit
- $141,595
- Equity at exit
- $10,194
Cash invested: $33,012 (down + closing). Projections, not guarantees.
Landlord ↔ Tenant lean methodology
- Overall (CITY)
- 12 Strongly Tenant-Friendly
- State Maryland
- 27 Tenant-Leaning · D+14
- County
- — inherits STATE
- City Baltimore
- 12 Strongly Tenant-Friendly · D+58
ZIP-level market 21205
- Home prices YoY
- -5.8%
- Rents YoY
- 9.9%
- Active inventory
- 143
- Price-to-rent
- 4.9×
Monthly cashflow live
- Estimated rent
- $1,995 high interval (Pro) →
- Mortgage (P&I)
- −$618
- Tax from tax record
- −$176 /mo · $2,107/yr
- Insurance
- −$49
- HOA
- −$0
- Vacancy / Maint / Mgmt
- −$419
- Net cashflow
- $733
Break-even live
UW: 25.0% down · 7.5% · 30yr · 1.5% tax · 5.0% vac · 8.0% maint · 8.0% mgmt
Financing live
Cash to close
- Down payment
- $29,475
- Closing costs
- $3,537
- Reserves months
- —
- Total cash needed
- —
Loan-product check · same deal, 3 products live
Conventional
25% down · 7.5% · 30yr
- Down + closing
- —
- Monthly P&I
- —
- Monthly cashflow
- —
- DSCR
- —
- Eligible?
- —
Personal DTI + credit; lowest rate.
DSCR
20% down · 8.5% · 30yr
- Down + closing
- —
- Monthly P&I
- —
- Monthly cashflow
- —
- DSCR
- —
- Eligible?
- —
No personal income docs; deal must DSCR.
Hard money
10% down · 12.0% · 12mo
- Down + closing
- —
- Monthly P&I
- —
- Monthly cashflow
- —
- DSCR
- —
- Eligible?
- —
Short-term bridge; refi at stabilization.
Rent comps 40 comps
| Address | Beds | Baths | Sqft | Rent | $/sqft | DOM | Units | Dist |
|---|---|---|---|---|---|---|---|---|
| 406 N Collington Ave Baltimore, MD | 2.0 | 2.5 | 1216 | $1,875 | $1.54 | 43d | 1 | 0.08mi |
| 2208 Orleans St Baltimore, MD | 3.0 | 1.0 | 1310 | $1,775 | $1.35 | 43d | 1 | 0.11mi |
| 2212 E Monument St Unit 2 Baltimore, MD | 2.0 | 1.0 | 1200 | $1,550 | $1.29 | 17d | 1 | 0.14mi |
| 2308 Jefferson St Baltimore, MD | 3.0 | 1.0 | 907 | $1,450 | $1.60 | 43d | 1 | 0.14mi |
| 712 N Duncan St Baltimore, MD | 2.0 | 1.5 | 1000 | $2,000 | $2.00 | 43d | 1 | 0.16mi |
| 2209 Mullikin St Baltimore, MD | 3.0 | 2.5 | 1512 | $1,900 | $1.26 | 3d | 1 | 0.17mi |
| 420 N Montford Ave Baltimore, MD | 3.0 | 1.0 | 1350 | $1,450 | $1.07 | 43d | 1 | 0.18mi |
| 618 N Montford Ave Baltimore, MD | 3.0 | 1.0 | 1050 | $1,468 | $1.40 | 14d | 1 | 0.19mi |
| 618 N Montford Ave Baltimore, MD | 3.0 | 1.0 | 1050 | $1,468 | $1.40 | 43d | 1 | 0.19mi |
| 437 N Montford Ave Baltimore, MD | 3.0 | 1.5 | 1100 | $1,450 | $1.32 | 43d | 1 | 0.20mi |
| 821 N Collington Ave Baltimore, MD | 3.0 | 2.0 | 1150 | $1,950 | $1.70 | 43d | 1 | 0.22mi |
| 2431 McElderry St Baltimore, MD | 4.0 | 2.5 | 1600 | $2,100 | $1.31 | 43d | 1 | 0.23mi |
| 107 N Chester St Unit 2 Baltimore, MD | 3.0 | 1.0 | 1750 | $2,750 | $1.57 | 43d | 1 | 0.24mi |
| 143 N Patterson Park Ave Baltimore, MD | 4.0 | 3.5 | 1650 | $3,700 | $2.24 | 23d | 1 | 0.24mi |
| 2317 E Fayette St Baltimore, MD | 3.0 | 1.5 | 1315 | $2,000 | $1.52 | 12d | 1 | 0.24mi |
| 108 N Madeira St Baltimore, MD | 2.0 | 2.0 | 1098 | $1,900 | $1.73 | 43d | 1 | 0.26mi |
| 720 N Port St Baltimore, MD | 2.0 | 1.0 | 950 | $1,300 | $1.37 | 43d | 1 | 0.26mi |
| 402 N Milton Ave Unit 402B Baltimore, MD | 2.0 | 1.0 | 950 | $1,290 | $1.36 | 43d | 1 | 0.26mi |
| 2410 E Fayette St Baltimore, MD | 3.0 | 1.0 | 1224 | $1,800 | $1.47 | 43d | 1 | 0.27mi |
| 425 N Milton Ave Baltimore, MD | 3.0 | 1.0 | 1200 | $1,525 | $1.27 | 14d | 1 | 0.28mi |
| 2242 E Fairmount Ave Baltimore, MD | 3.0 | 2.0 | 1345 | $2,850 | $2.12 | 43d | 1 | 0.29mi |
| 1923 Ashland Ave Baltimore, MD | 2.0 | 2.0 | 862 | $1,770 | $2.05 | 19d | 2 | 0.29mi |
| 2115 E Fairmount Ave Baltimore, MD | 3.0 | 2.5 | 1736 | $2,795 | $1.61 | 23d | 1 | 0.29mi |
| 2015 E Fairmount Ave Baltimore, MD | 3.0 | 3.5 | 1402 | $2,500 | $1.78 | 43d | 1 | 0.31mi |
| 230 N Rose St Baltimore, MD | 2.0 | 1.5 | 1200 | $1,545 | $1.29 | 43d | 1 | 0.32mi |
| 224 N Rose St Baltimore, MD | 2.0 | 2.5 | 1120 | $1,875 | $1.67 | 17d | 1 | 0.32mi |
| 233 N Rose St Baltimore, MD | 2.0 | 2.5 | 934 | $1,750 | $1.87 | 17d | 1 | 0.33mi |
| 227 N Rose St Baltimore, MD | 2.0 | 4.0 | 1420 | $1,600 | $1.13 | 23d | 1 | 0.33mi |
| 16 N Bradford St Baltimore, MD | 2.0 | 3.5 | 930 | $2,400 | $2.58 | 4d | 1 | 0.34mi |
| 539 N Luzerne Ave Baltimore, MD | 3.0 | 2.5 | 1702 | $2,300 | $1.35 | 43d | 1 | 0.35mi |
| 2608 McElderry St Baltimore, MD | 3.0 | 1.0 | 1144 | $1,550 | $1.35 | 23d | 1 | 0.36mi |
| 233 N Luzerne Ave Baltimore, MD | 3.0 | 2.5 | 1700 | $2,250 | $1.32 | 21d | 1 | 0.37mi |
| 225 N Luzerne Ave Baltimore, MD | 3.0 | 1.0 | 1198 | $1,350 | $1.13 | 19d | 1 | 0.38mi |
| 104 N Rose St Baltimore, MD | 3.0 | 2.0 | 936 | $2,500 | $2.67 | 43d | 1 | 0.38mi |
| 415 N Glover St Baltimore, MD | 2.0 | 2.5 | 1092 | $1,600 | $1.47 | 23d | 1 | 0.39mi |
| 218 N Glover St Baltimore, MD | 2.0 | 2.0 | 1360 | $1,750 | $1.29 | 43d | 1 | 0.39mi |
| 2608 E Fayette St Unit 1 Baltimore, MD | 2.0 | 1.0 | 900 | $1,700 | $1.89 | 14d | 1 | 0.41mi |
| 2202 Prentiss Pl Baltimore, MD | 3.0 | 2.0 | 1400 | $2,400 | $1.71 | 43d | 1 | 0.42mi |
| 537 N Lakewood Ave Baltimore, MD | 3.0 | 3.5 | 1755 | $2,050 | $1.17 | 43d | 1 | 0.42mi |
| 533 N Lakewood Ave Baltimore, MD | 4.0 | 3.5 | 1758 | $4,500 | $2.56 | 43d | 1 | 0.42mi |
Listing history 17 events
-
2026-06-17status $117,900 Pending 41 DOM
-
2026-06-16days on market $117,900 Active 41 DOM
-
2026-06-15days on market $117,900 Active 40 DOM
-
2026-06-13days on market $117,900 Active 38 DOM
-
2026-06-10price $117,900 Active 34 DOM
-
2026-06-09days on market $124,900 Active 34 DOM
-
2026-06-08days on market $124,900 Active 33 DOM
-
2026-06-07days on market $124,900 Active 32 DOM
-
2026-06-04days on market $124,900 Active 29 DOM
-
2026-06-03pricedays on market $124,900 Active 28 DOM
-
2026-06-02days on market $134,900 Active 27 DOM
-
2026-06-01days on market $134,900 Active 26 DOM
-
2026-05-31days on market $134,900 Active 25 DOM
-
2026-05-15price $139,900 1408-char remark
-
2026-05-06$150,000 Active 1408-char remark
-
2005-08-10soldstatus $84,973
-
1982-04-06soldstatus $241,294
ⓘ Source: listings_history table (triggers on properties + properties_extension) + one-shot
backfill from property_details.listing_events for pre-trigger history.
Tax reassessment forecast MD · Partial reset (capped growth)
- Current annual tax
- $2,107 · $176/mo
- Projected year-2 tax
- $2,107 · $176/mo
- Expected delta
- $0/yr ($0/mo · 0.0%)
ⓘ Screening estimate from a state-policy table — verify with the county assessor before closing.
Climate risk First Street
- Flood 1/10 Low FEMA zone X (unshaded) · 0% chance over 30 yrs
- Wildfire 1/10 Low
- Heat 8/10 Severe 7 d/yr ≥103°F today · 15 d/yr by 30 yrs out
- Wind 6/10 Major 27% chance of damaging wind over 30 yrs
- Air quality 4/10 Moderate 6 unhealthy d/yr today · 7 by 30 yrs out
Nearby sold comps map
Loading sold comps map…
Walkable amenities ~0.75 mi
Loading nearby amenities…
Taxation est. · year 1
- Rental income
- $23,945
- − Mortgage interest
- −$6,604
- − Property taxes
- −$2,107
- − Insurance
- −$590
- − Repairs & maintenance
- −$1,916
- − Management
- −$1,916
- − Depreciation
- −$3,430
- Taxable income
- $7,383
- Est. tax owed @ 24.0%
- −$1,772
- After-tax cash flow
- $7,029/yr
For passive investors: Depreciation is non-cash, so a rental often shows a tax loss while cash-flowing — sheltering income. Rental losses are passive: they offset passive income freely, and up to $25,000/yr can offset ordinary (W-2) income if you actively participate and your MAGI is under $100k (phasing out to $0 by $150k); unused losses carry forward. On sale, claimed depreciation is recaptured at up to 25%, and gains may owe capital-gains tax (a 1031 exchange can defer both). Figures are a year-1 estimate at your 24.0% rate — not tax advice; consult a CPA.
Schools (NCES district)
- District
- Baltimore City Public Schools
- NCES district ID
- 2400090
- Math proficiency
- 7% ▼ -9.00%
- Reading proficiency
- 16% ▼ -5.00%
- Median HH income
- $42,108
- Composite
- 10.08/100
- National rank
- #9805
- State rank
- #24 of 24 in MD
Livability — Baltimore
- Score
- 76/100
- State rank
- #90
- US rank
- #3396
Category grades
Schools grade is shown separately in the Schools card above.
Census & demographics
- Census place
- Baltimore, MD
- County
- Baltimore City · 558,601 people
- City population
- 588,727
- Metro
- Baltimore-Columbia-Towson, MD
- Population (ZIP)
- 13,013
- Household income
- $43,176
- Rent vs Own
- Severe rent burden
- 966.0
Population outlook (Baltimore County) Hauer SSP2
- Today (2025)
- 624,249 people
- By 2030
- 621,541 · -0.4%
- By 2040
- 609,756 · -2.3%
- By 2050
- 597,249 · -4.3%
- By 2075
- 552,236 · -11.5%
- By 2100
- 513,934 · -17.7%
Race, ethnicity, and origin ACS 2023
- Neighborhood character
- Diverse neighborhood (Simpson 0.60)
- Race & ethnicity
- Black 60% Hispanic / Latino 16% White 14% Two or more races 11% Asian 3%
- Hispanic origin (detail)
- Mexican 1% Cuban 1% Dominican 4%
- Common ancestry
- Slovak 3% Romanian 1%
- Foreign-born
- 16% · Canada, China
- Languages at home
- 79% English-only · Spanish 11% Arabic 4% Chinese 1%
Political lean MEDSL · Baltimore
- 2024 margin
- Solid D (+73.0) · D 85.2% · R 12.2% · Other 2.6%
- 2008→2024 swing
- -2.5pp toward R · 2008: 75.5pp · 2024: 73.0pp
- All cycles
- 2024: D+73.0 2020: D+76.6 2016: D+74.6 2012: D+76.4 2008: D+75.5
Not yet ingested
- Civics
- —
Market trends
- HPI YoY
- ▼ -15.03%
- Current HPI
- 244.1345
- Rent YoY
- ▲ 9.88%
- Metro
- Baltimore-Columbia-Towson, MD
- State GDP YoY
- ▲ 2.97%
- F500 in state
- 12
Industry mix (Fortune 500 HQ in MD)
| Industry | F500 HQs | Revenue |
|---|---|---|
| Aerospace / Defense | 1 | $71B |
|
||
| Utilities | 1 | $25B |
|
||
| Hotels | 1 | $24B |
|
||
| Consumer Goods | 1 | $7B |
|
||
| Real Estate | 1 | $6B |
|
||
| Chemicals | 1 | $2B |
|
||
Price history
-51.1% since first listed8 events — show timeline
- 2026-06-16 Pending — BRIGHT MLS
- 2026-06-09 Price Changed $117,900 BRIGHT MLS
- 2026-06-03 Price Changed $124,900 BRIGHT MLS
- 2026-05-28 Price Changed $134,900 BRIGHT MLS
- 2026-05-15 Price Changed $139,900 BRIGHT MLS
- 2026-05-06 Listed $150,000 BRIGHT MLS
- 2005-08-10 Sold (Public Records) $84,973 Public Records
- 1982-04-06 Sold (Public Records) $241,294 Public Records
Property tax history
+6.5%/yrLatest (2025): $2,107 · +0.3% YoY. Source: county tax records.
Cash-flow waterfall
monthlySold comps — $/sqft
last 12 mo · ≤1 miLoading sold comps…