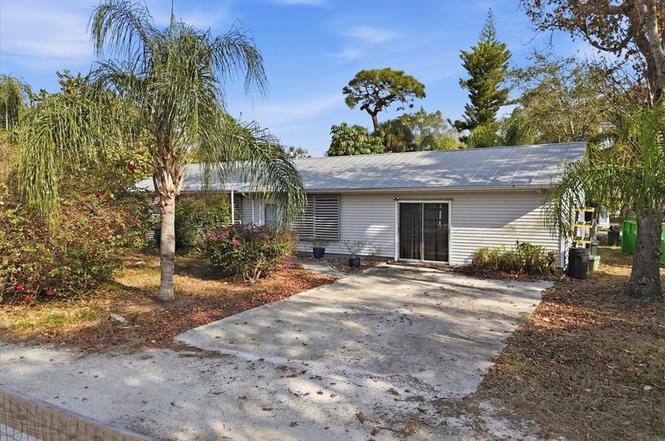
1180 Old Bridge Rd · North Fort Myers, FL
Flood risk 5/10 · Moderate
- FEMA flood zone
- X (shaded)
- Chance of flooding over 30 yrs
- 0.23%
- Est. flood insurance / yr
- $507 – $1,088
Fire risk 1/10 · Minimal
- Est. fire insurance / yr
- $947 – $1,759
Heat risk 10/10 · Severe
- Hot days now (above 107°F)
- 7 days/yr
- Hot days in 30 yrs
- 29 days/yr
Wind risk 10/10 · Severe
- Chance of severe wind over 30 yrs
- 99.0%
Air-quality risk 2/10 · Minimal
- Unhealthy air days now
- 1 days/yr
- Unhealthy air days in 30 yrs
- 1 days/yr
Risk factors via First Street. Map © Google.
Why this score? — see what drove the B- grade
The composite is a weighted blend of 9 inputs, each scored 0–100. Each bar is that input's sub-score; the figure is the points it added to the 100-point composite (weight × sub-score).
- Cash flow +25.9/30.0
- ARV discount +15.0/15.0
- DSCR +8.7/10.0
- 1% rule +5.7/10.0
- Schools +4.1/10.0
- Livability +3.7/5.0
- Rent growth +3.2/5.0
- Condition / age +2.5/5.0
- Appreciation +0.0/10.0
$180,000
🖨 Deal sheet (PDF) 📄 Offer letter ✓ Due diligence
Listing remarks
Opportunity awaits with this 3-bedroom, 2-bath home located on a corner lot. Featuring a metal roof and a spacious footprint, this property is ready for renovation and improvements. A great option for buyers seeking a project or looking to update a home to their personal style. Sold as-is. Schedule your showing and explore the possibilities.
Key facts
- Metal roof
- Spacious footprint
- Corner lot
Tags
Property features AI
Finance
- Other: Private in-ground fiberglass pool
- Financial info: Pets allowed
- HOA & community: Non-gated community; No association fee
Exterior
- Parking: Attached garage (1 covered space)
- Utilities: Public water; Septic tank sewer; High-speed internet available; Cable not available
- Home design: Single-story; North-facing; Resale property
- Construction: Vinyl siding and wood frame construction; Metal roof; Built on standard foundation
- Exterior features: Lanai; Porch; Screened porch; Storage; Corner lot; South exposure
Interior
- Kitchen: Range; Refrigerator
- Flooring: Carpet; Tile
- Bathrooms: 2 full bathrooms
- Heating & cooling: Central heating (electric); Central air conditioning (electric)
- Interior features: Jalousie windows; Dual sinks; Combined living and dining room; Tub with shower; Unfurnished
Neighborhood map
What this means for you Summary
Snapshot
- This is a 3-bed/2.0-bath single-family listed at $180k.
Deal economics
- At list price, monthly cash flow is $444 ($5k/yr) — positive.
- The deal already cash-flows at list — no discount required.
- Meets the 1% rule at list price ($2k rent vs $180k).
- Recommended offer: $175k (3.0% below list) — sets the bar for market timing.
- Cap rate 9.3% vs local median 3.6% in North Fort Myers — top-decile yield for the area; either an underpriced asset or a hidden risk that comps aren't pricing in. Stress-test before assuming the spread holds.
Location & tenants
- Location reads 74/100 on livability (#269 in FL, #4,409 nationally) — a middle-class / working-renter tenant base. Strengths: cost of living A+, housing A+, health & safety A+; Watch: employment C-, amenities F, commute F.
- Lee (suburban): math 47% / reading 50% proficiency, ranked #42 of 73 in FL (top 58%) — families likely to look elsewhere, expect single-tenant / working-renter base with shorter leases.
- Market conditions: Rents rising (+2.6%/yr); 841 active listings in the ZIP; 14 comparable units currently listed for rent nearby; rentals at typical pace (median 16d on market — plan ~3-4 weeks tenant-placement turnaround); 15,411 units permitted in Lee County in 2024 (4,686 in 5+ unit buildings).
- This rent runs 42% of the median local income ($55k/yr) — at the standard rent-burdened threshold; future hikes will face affordability resistance.
Forward outlook
- Local home prices are declining (-3.0%/yr); year-one equity from $1k of loan paydown is wiped out by about $5k of value loss. Plan a longer hold.
- Lee County population projected at +44% by 2050 — long-run rental-demand tailwind backs the buy-and-hold thesis.
Negotiation context
- It's been on market 45 days — a 3% lower offer ($175k) is reasonable based on typical stale-listing flexibility.
- 2 sale attempts; this cycle's ask has dropped $40k (18%) from the opening price — seller is motivated, your offer sets the floor, not the list.
Risks & watch-outs
- Climate carrying-cost: moderate flood risk; severe wind risk, 99% chance of damaging wind over 30y; extreme-heat days projected 7→29/yr by 2055 (HVAC capex compounding) — expect insurance premiums to compound above CPI over the hold.
Questions for the listing agent
- It's been on market 45 days. Have you received any prior offers? Is the seller open to a 3% concession, seller financing, or rate buy-down credit?
- Is there a deadline driving the sale (1031 exchange, divorce, estate, relocation)? That informs how much negotiation room exists.
- What's the average days-on-market for RENTAL listings here right now (not sales)? A rising rental-DOM trend means longer vacancies and softer asking-rent achievability than the comps imply.
- What's the recent tenant-quality profile in this submarket — average credit score on applications, eviction rate, late-payment / NSF rate, and stable-employment percentage? A property-management company in the area should have these aggregated.
- How much new for-sale + rental construction is in the pipeline within 1–3 miles? Heavy new supply typically softens prices + rents 12–24 months out; constrained supply supports both.
Investment metrics
- 1% rule
- 1.07% ✓
- Cap rate
- 9.25%
- Cash-on-cash
- 10.57%
- DSCR
- 1.47
- GRM
- 7.8
CMA / ARV
- ARV (on-the-fly)
- $254,696
- Comps found
- 3
Show comp detail 3 sales within ~0.75 mi
| Address | Dist | Beds/Ba | Sqft | Sold | Price | $/sf | Match |
|---|---|---|---|---|---|---|---|
| 1383 Harbor View Dr | 0.35mi | 3/2.0 | 1,578 (-2%) | 4mo | $390,000 | $247 | 77 |
| 1320 Harbor View Dr | 0.43mi | 3/2.0 | 1,420 (-12%) | 18mo | $225,000 | $158 | 45 |
| 67 E Mariana Ave | 0.66mi | 4/2.0 (+1) | 1,792 (+11%) | 4mo | $250,000 | $140 | 42 |
Match score weights: distance 35% · size 25% · config 20% · recency 20%. Top-matched comps best support the ARV.
Projected returns pro-forma
-3.0% appreciation · 2.63% rent growth · sell at horizon
- IRR
- -0.9%
- Equity multiple
- 0.97×
- Total profit
- $-1,674
- Equity at exit
- $26,839
- IRR
- 8.4%
- Equity multiple
- 1.63×
- Total profit
- $31,752
- Equity at exit
- $15,563
Cash invested: $50,400 (down + closing). Projections, not guarantees.
Landlord ↔ Tenant lean methodology
- Overall (STATE)
- 87 Strongly Landlord-Friendly
- State Florida
- 87 Strongly Landlord-Friendly · R+3
- County
- — inherits STATE
- City
- — inherits STATE
ZIP-level market 33917
- Home prices YoY
- -30.2%
- Rents YoY
- 2.6%
- Active inventory
- 841
- Price-to-rent
- 7.8×
Monthly cashflow live
- Estimated rent
- $1,925 high interval (Pro) →
- Mortgage (P&I)
- −$944
- Tax from tax record
- −$58 /mo · $695/yr
- Insurance
- −$75
- HOA
- −$0
- Vacancy / Maint / Mgmt
- −$404
- Net cashflow
- $444
Break-even live
Sensitivity live
| Price | -10% $546 | -5% $495 | +0% $444 | +5% $393 | +10% $342 |
|---|---|---|---|---|---|
| Rent | -10% $292 | -5% $368 | +0% $444 | +5% $520 | +10% $596 |
| Rate | -1.0pp $535 | -0.5pp $490 | base $444 | +0.5pp $397 | +1.0pp $350 |
UW: 25.0% down · 7.5% · 30yr · 1.5% tax · 5.0% vac · 8.0% maint · 8.0% mgmt
Financing live
Cash to close
- Down payment
- $45,000
- Closing costs
- $5,400
- Reserves months
- —
- Total cash needed
- —
Loan-product check · same deal, 3 products live
Conventional
25% down · 7.5% · 30yr
- Down + closing
- —
- Monthly P&I
- —
- Monthly cashflow
- —
- DSCR
- —
- Eligible?
- —
Personal DTI + credit; lowest rate.
DSCR
20% down · 8.5% · 30yr
- Down + closing
- —
- Monthly P&I
- —
- Monthly cashflow
- —
- DSCR
- —
- Eligible?
- —
No personal income docs; deal must DSCR.
Hard money
10% down · 12.0% · 12mo
- Down + closing
- —
- Monthly P&I
- —
- Monthly cashflow
- —
- DSCR
- —
- Eligible?
- —
Short-term bridge; refi at stabilization.
Rent comps 14 comps
| Address | Beds | Baths | Sqft | Rent | $/sqft | DOM | Units | Dist |
|---|---|---|---|---|---|---|---|---|
| 1299 Old Bridge Rd North Fort Myers, FL | 4.0 | 3.0 | 1582 | $2,200 | $1.39 | 24d | 1 | 0.23mi |
| 1398 Evalena Ln North Fort Myers, FL | 3.0 | 2.0 | 1479 | $1,849 | $1.25 | 3d | 1 | 0.38mi |
| 1056 Old Bridge Rd North Fort Myers, FL | 2.0 | 1.0 | 1100 | $1,350 | $1.23 | 24d | 1 | 0.41mi |
| 1439 Glick Dr North Fort Myers, FL | 3.0 | 1.0 | 1134 | $1,500 | $1.32 | 3d | 1 | 0.52mi |
| 5558 Sir Walter Way North Fort Myers, FL | 2.0 | 2.0 | 1372 | $1,095 | $0.80 | 15d | 1 | 0.52mi |
| 5510 Sir Walter Way North Fort Myers, FL | 2.0 | 2.0 | 1152 | $1,800 | $1.56 | 4d | 1 | 0.53mi |
| 5707 Foxlake Dr #2 North Fort Myers, FL | 2.0 | 2.0 | 1114 | $1,500 | $1.35 | 24d | 1 | 0.78mi |
| 5701 Longleaf Dr North Fort Myers, FL | 2.0 | 2.0 | 1233 | $1,570 | $1.27 | 13d | 1 | 0.82mi |
| 20 Estate Dr North Fort Myers, FL | 2.0 | 2.0 | 1644 | $2,500 | $1.52 | 4d | 1 | 0.94mi |
| 15080 Riverbend Blvd #802 North Fort Myers, FL | 2.0 | 2.0 | 1344 | $1,850 | $1.38 | 22d | 1 | 1.00mi |
| 15250 Riverbend Blvd #204 North Fort Myers, FL | 2.0 | 2.0 | 1429 | $1,600 | $1.12 | 22d | 1 | 1.05mi |
| 137 Lantern Pl Unit A North Fort Myers, FL | 2.0 | 1.0 | 1080 | $1,200 | $1.11 | 4d | 1 | 1.17mi |
| 106 Gaslight Ave North Fort Myers, FL | 2.0 | 2.0 | 1056 | $1,400 | $1.33 | 4d | 1 | 1.31mi |
| 15493 Admiralty Cir #5 North Fort Myers, FL | 2.0 | 2.0 | 1146 | $2,400 | $2.09 | 24d | 1 | 1.41mi |
Listing history 16 events
-
2026-06-17days on market $180,000 Active 45 DOM
-
2026-06-16days on market $180,000 Active 44 DOM
-
2026-06-15days on market $180,000 Active 43 DOM
-
2026-06-13days on market $180,000 Active 41 DOM
-
2026-06-10days on market $180,000 Active 38 DOM
-
2026-06-09days on market $180,000 Active 37 DOM
-
2026-06-08days on market $180,000 Active 36 DOM
-
2026-06-07pricedays on market $180,000 Active 35 DOM
-
2026-06-03days on market $200,000 Active 31 DOM
-
2026-06-02days on market $200,000 Active 30 DOM
-
2026-06-01days on market $200,000 Active 29 DOM
-
2026-05-31days on market $200,000 Active 28 DOM
-
2026-05-12price $200,000
-
2026-05-08status Active
-
2026-02-24status Pending
-
2026-02-13$220,000 Active
ⓘ Source: listings_history table (triggers on properties + properties_extension) + one-shot
backfill from property_details.listing_events for pre-trigger history.
Tax reassessment forecast FL · Resets to sale price
- Current annual tax
- $695 · $58/mo
- Projected year-2 tax
- $1,494 · $124/mo
- Expected delta
- +$799/yr (+$67/mo · 114.9%)
ⓘ Screening estimate from a state-policy table — verify with the county assessor before closing.
Climate risk First Street
- Flood 5/10 Major FEMA zone X (shaded) · 23% chance over 30 yrs
- Wildfire 1/10 Low
- Heat 10/10 Extreme 7 d/yr ≥107°F today · 29 d/yr by 30 yrs out
- Wind 10/10 Extreme 99% chance of damaging wind over 30 yrs
- Air quality 2/10 Low 1 unhealthy d/yr today · 1 by 30 yrs out
Nearby sold comps map
Loading sold comps map…
Walkable amenities ~0.75 mi
Loading nearby amenities…
Taxation est. · year 1
- Rental income
- $23,102
- − Mortgage interest
- −$10,083
- − Property taxes
- −$695
- − Insurance
- −$900
- − Repairs & maintenance
- −$1,848
- − Management
- −$1,848
- − Depreciation
- −$5,236
- Taxable income
- $2,492
- Est. tax owed @ 24.0%
- −$598
- After-tax cash flow
- $4,731/yr
For passive investors: Depreciation is non-cash, so a rental often shows a tax loss while cash-flowing — sheltering income. Rental losses are passive: they offset passive income freely, and up to $25,000/yr can offset ordinary (W-2) income if you actively participate and your MAGI is under $100k (phasing out to $0 by $150k); unused losses carry forward. On sale, claimed depreciation is recaptured at up to 25%, and gains may owe capital-gains tax (a 1031 exchange can defer both). Figures are a year-1 estimate at your 24.0% rate — not tax advice; consult a CPA.
Schools (NCES district)
- District
- Lee
- NCES district ID
- 1201080
- Math proficiency
- 47% ▼ -11.00%
- Reading proficiency
- 50% ▼ -4.00%
- Median HH income
- $49,518
- Composite
- 41.49/100
- National rank
- #3458
- State rank
- #42 of 73 in FL
Livability — North Fort Myers
- Score
- 74/100
- State rank
- #269
- US rank
- #4409
Category grades
Schools grade is shown separately in the Schools card above.
Census & demographics
- Census place
- North Fort Myers, FL
- County
- Lee County · 788,662 people
- City population
- 57,035
- Metro
- Cape Coral-Fort Myers, FL
- Population (ZIP)
- 33,380
- Household income
- $55,000
- Rent vs Own
- Severe rent burden
- 775.0
Population outlook (Lee County) Hauer SSP2
- Today (2025)
- 871,946 people
- By 2030
- 955,468 · +9.6%
- By 2040
- 1,113,587 · +27.7%
- By 2050
- 1,256,891 · +44.1%
- By 2075
- 1,560,270 · +78.9%
- By 2100
- 1,726,848 · +98.0%
Race, ethnicity, and origin ACS 2023
- Neighborhood character
- Predominantly White (85%)
- Race & ethnicity
- White 85% Hispanic / Latino 10% Two or more races 7% Asian 1% Black 1%
- Hispanic origin (detail)
- Mexican 2% Puerto Rican 1% Cuban 3%
- Common ancestry
- Lithuanian 3% Romanian 3% Slovak 2%
- Foreign-born
- 10% · Canada
- Languages at home
- 88% English-only · Spanish 9% Other Indo-European 1% Russian/Polish/Slavic 1%
Political lean MEDSL · Lee
- 2024 margin
- Strong R (+28.4) · D 35.5% · R 63.9%
- 2008→2024 swing
- -18.0pp toward R · 2008: -10.4pp · 2024: -28.4pp
- All cycles
- 2024: R+28.4 2020: R+19.2 2016: R+20.4 2012: R+16.6 2008: R+10.4
Not yet ingested
- Civics
- —
Market trends
- HPI YoY
- ▼ -122.28%
- Current HPI
- 282.2895
- Rent YoY
- ▲ 2.63%
- Metro
- Cape Coral-Fort Myers, FL
- State GDP YoY
- ▲ 3.28%
- F500 in state
- 36
Industry mix (Fortune 500 HQ in FL)
| Industry | F500 HQs | Revenue |
|---|---|---|
| Industrial Technology | 2 | $29B |
|
||
| Insurance | 2 | $17B |
|
||
| Retail | 1 | $60B |
|
||
| Technology Distribution | 1 | $58B |
|
||
| Homebuilding | 1 | $35B |
|
||
| Technology Manufacturing | 1 | $35B |
|
||
Price history
-9.1% since first listed4 events — show timeline
- 2026-05-12 Price Changed $200,000 FORTMLS
- 2026-05-08 Relisted — FORTMLS
- 2026-02-24 Pending — FORTMLS
- 2026-02-13 Listed $220,000 FORTMLS
Property tax history
+1.8%/yrLatest (2025): $695 · +7.7% YoY. Source: county tax records.
Cash-flow waterfall
monthlySold comps — $/sqft
last 12 mo · ≤1 miLoading sold comps…