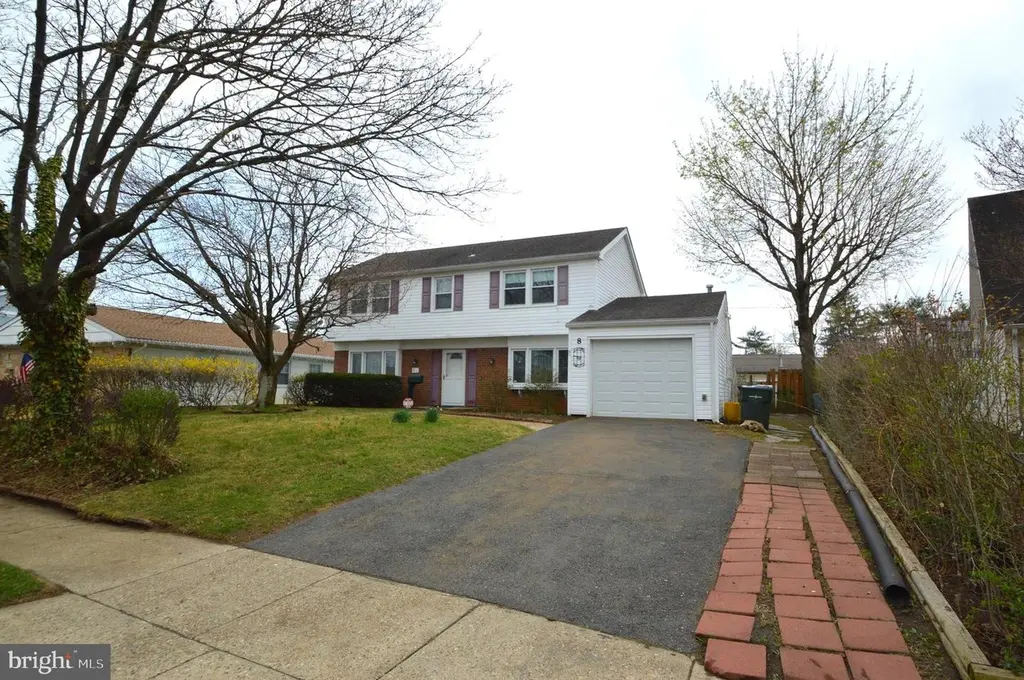
8 Holton Ln · Burlington, NJ
Flood risk 1/10 · Minimal
- FEMA flood zone
- X (unshaded)
- Chance of flooding over 30 yrs
- 0.0%
- Est. flood insurance / yr
- $507 – $1,088
Fire risk 1/10 · Minimal
- Est. fire insurance / yr
- $526 – $976
Heat risk 7/10 · Major
- Hot days now (above 103°F)
- 7 days/yr
- Hot days in 30 yrs
- 15 days/yr
Wind risk 6/10 · Moderate
- Chance of severe wind over 30 yrs
- 27.0%
Air-quality risk 4/10 · Minor
- Unhealthy air days now
- 5 days/yr
- Unhealthy air days in 30 yrs
- 7 days/yr
Risk factors via First Street. Map © Google.
Why this score? — see what drove the D grade
The composite is a weighted blend of 9 inputs, each scored 0–100. Each bar is that input's sub-score; the figure is the points it added to the 100-point composite (weight × sub-score).
- Cash flow +14.3/30.0
- ARV discount +9.3/15.0
- 1% rule +4.7/10.0
- DSCR +4.3/10.0
- Livability +3.9/5.0
- Rent growth +2.5/5.0
- Condition / age +2.5/5.0
- Schools +1.7/10.0
- Appreciation +0.0/10.0
$364,900
🖨 Deal sheet (PDF) 📄 Offer letter ✓ Due diligence
Listing remarks
Welcome to 8 Holton Lane in the desirable Hawthorne Park section of Willingboro—a spacious 4-bedroom, 2.5-bath Colonial offering comfort, functionality, and great potential to make it your own. Step inside to a bright and inviting main level featuring a formal living room and dining room, perfect for entertaining. The kitchen opens to a cozy breakfast nook, creating a seamless space for casual meals and gatherings. Just off the breakfast nook, you’ll find access to a charming 3-season room at the rear of the home—complete with a mini-split system, making it an ideal spot to relax and enjoy the outdoors with extended seasonal comfort. The main floor also includes a convenie
Key facts
- 6,500 sq ft lot
- Built 1963
- Listed 24 days
Property features AI
Exterior
- Parking: Asphalt driveway; Driveway parking
- Utilities: Public water; Public sewer; Natural gas available (heating and hot water); Phone available; Cable internet available
- Home design: Detached property; Frame construction
- Construction: Frame construction; Architectural shingle roof; Slab foundation; Built year source: Assessor
- Exterior features: Not in a federal flood zone; Lot dimensions approximately 65 x 100; Other structures above and below grade; Pets allowed with number limits
Interior
- Kitchen: Eat-in kitchen; Breakfast area
- Bedrooms: Four bedrooms on the upper level; Rooms include Living Room, Dining Room, Bedroom 1, Bedroom 2, Bedroom 3, Bedroom 4, Sun/Florida Room, Kitchen, Breakfast Room, Utility Room
- Flooring: Carpet
- Bathrooms: Two full bathrooms (total on upper levels: 2); One half bathroom on main level
- Heating & cooling: Forced air heating (natural gas); Central air conditioning (electric)
- Interior features: Tub/shower; Walk-in shower; Breakfast area; Ceiling fans; Combination kitchen and dining; Dining area; Traditional floor plan; Eat-in kitchen; Master bath
- Laundry & utility: Laundry on main floor; Utility room
Neighborhood map
What this means for you Summary
Snapshot
- This is a 4-bed/2.5-bath single-family listed at $365k.
Deal economics
- At list price, monthly cash flow is $66 ($798/yr) — positive.
- The deal already cash-flows at list — no discount required.
- To meet the 1% rule (rent ≥ 1% of price), the offer needs to be $354k (3.0% below list).
- Recommended offer: $354k (3.0% below list) — sets the bar for 1% rule.
- Cap rate 6.5% vs local median 4.9% in Burlington — top-decile yield for the area; either an underpriced asset or a hidden risk that comps aren't pricing in. Stress-test before assuming the spread holds.
Location & tenants
- Location reads 78/100 on livability (#89 in NJ, #2,359 nationally) — a middle-class / working-renter tenant base. Strengths: housing A+, health & safety A+, cost of living A-; Watch: schools C-, amenities F.
- Willingboro Public School District (suburban): math 5% / reading 30% proficiency, ranked #433 of 472 in NJ (top 92%) — low school quality limits family demand, transient renter base, plan for 1-2y turnover.
- Market conditions: 155 active listings in the ZIP; 16 comparable units currently listed for rent nearby; rentals leasing fast (median 4d on market — plan ~1-2 weeks tenant-placement turnaround); solid renter incomes; 2,161 units permitted in Burlington County in 2024 (988 in 5+ unit buildings).
- This rent runs 43% of the median local income ($98k/yr) — at the standard rent-burdened threshold; future hikes will face affordability resistance.
Forward outlook
- Local home prices are declining (-3.0%/yr); year-one equity from $3k of loan paydown is wiped out by about $11k of value loss. Plan a longer hold.
- Burlington County population projected to shrink 5% by 2050 — rents likely to lag national; underwrite the cash flow, not the appreciation.
Negotiation context
- It's been on market 24 days — a 2% lower offer ($359k) is reasonable based on typical stale-listing flexibility.
Risks & watch-outs
- Climate carrying-cost: major wind risk, 27% chance of damaging wind over 30y; extreme-heat days projected 7→15/yr by 2055 (HVAC capex compounding) — expect insurance premiums to compound above CPI over the hold.
Questions for the listing agent
- Built in 1963 — when were the roof, HVAC, electrical panel, plumbing, and water heater last replaced?
- Is there a deadline driving the sale (1031 exchange, divorce, estate, relocation)? That informs how much negotiation room exists.
- The area grade is low — what's the realistic commute time and amenity access for the typical tenant pool here? Any planned neighborhood developments (good or bad) we should know about?
- What's the average days-on-market for RENTAL listings here right now (not sales)? A rising rental-DOM trend means longer vacancies and softer asking-rent achievability than the comps imply.
- What's the recent tenant-quality profile in this submarket — average credit score on applications, eviction rate, late-payment / NSF rate, and stable-employment percentage? A property-management company in the area should have these aggregated.
- How much new for-sale + rental construction is in the pipeline within 1–3 miles? Heavy new supply typically softens prices + rents 12–24 months out; constrained supply supports both.
Investment metrics
- 1% rule
- 0.97% ✗
- Cap rate
- 6.51%
- Cash-on-cash
- 0.78%
- DSCR
- 1.03
- GRM
- 8.6
CMA / ARV
- ARV (on-the-fly)
- $379,813
- Comps found
- 12
Show comp detail 12 sales within ~0.75 mi
| Address | Dist | Beds/Ba | Sqft | Sold | Price | $/sf | Match |
|---|---|---|---|---|---|---|---|
| 71 Harrington Cir | 0.16mi | 3/2.0 (-1) | 1,843 (-2%) | 2mo | $375,000 | $203 | 81 |
| 1 Hawley Pl | 0.16mi | 4/2.0 | 1,999 (+7%) | 0mo | $466,000 | $233 | 79 |
| 15 Hampton Ln | 0.25mi | 3/2.0 (-1) | 1,843 (-2%) | 1mo | $350,000 | $190 | 78 |
| 47 Holstone Ln | 0.38mi | 3/2.0 (-1) | 1,843 (-2%) | 1mo | $350,000 | $190 | 72 |
| 10 Hancock Ln | 0.51mi | 3/2.5 (-1) | 1,799 (-4%) | 1mo | $415,000 | $231 | 64 |
| 64 Gamewell Ln | 0.49mi | 4/2.0 | 1,999 (+7%) | 2mo | $446,000 | $223 | 62 |
| 78 Gainscott Ln | 0.41mi | 4/2.0 | 1,705 (-9%) | 2mo | $379,999 | $223 | 62 |
| 44 Myrtlewood Ln | 0.62mi | 4/2.5 | 2,082 (+11%) | 2mo | $395,000 | $190 | 51 |
| 69 Edgely Ln | 0.75mi | 5/— (+1) | 1,959 (+5%) | 2mo | $305,000 | $156 | 50 |
| 31 Henderson Ln | 0.67mi | 3/2.0 (-1) | 1,696 (-9%) | 1mo | $280,000 | $165 | 45 |
| 14 Mayapple Ln | 0.69mi | 4/2.0 | 1,624 (-13%) | 0mo | $332,999 | $205 | 44 |
| 35 Eagen Ln | 0.68mi | 4/2.0 | 2,113 (+13%) | 2mo | $285,000 | $135 | 43 |
Match score weights: distance 35% · size 25% · config 20% · recency 20%. Top-matched comps best support the ARV.
Projected returns pro-forma
-3.0% appreciation · 3.0% rent growth · sell at horizon
- IRR
- -15.0%
- Equity multiple
- 0.46×
- Total profit
- $-54,715
- Equity at exit
- $54,408
- IRR
- -6.3%
- Equity multiple
- 0.59×
- Total profit
- $-41,458
- Equity at exit
- $31,550
Cash invested: $102,172 (down + closing). Projections, not guarantees.
Landlord ↔ Tenant lean methodology
- Overall (STATE)
- 21 Tenant-Leaning
- State New Jersey
- 21 Tenant-Leaning · D+6
- County
- — inherits STATE
- City
- — inherits STATE
ZIP-level market 08046
- Active inventory
- 155
- Price-to-rent
- 8.6×
Monthly cashflow live
- Estimated rent
- $3,538 high interval (Pro) →
- Mortgage (P&I)
- −$1,914
- Tax from tax record
- −$663 /mo · $7,960/yr
- Insurance
- −$152
- HOA
- −$0
- Vacancy / Maint / Mgmt
- −$743
- Net cashflow
- $66
Break-even live
Sensitivity live
| Price | -10% $273 | -5% $170 | +0% $66 | +5% $-37 | +10% $-140 |
|---|---|---|---|---|---|
| Rent | -10% $-213 | -5% $-73 | +0% $66 | +5% $206 | +10% $346 |
| Rate | -1.0pp $250 | -0.5pp $159 | base $66 | +0.5pp $-28 | +1.0pp $-124 |
UW: 25.0% down · 7.5% · 30yr · 1.5% tax · 5.0% vac · 8.0% maint · 8.0% mgmt
Financing live
Cash to close
- Down payment
- $91,225
- Closing costs
- $10,947
- Reserves months
- —
- Total cash needed
- —
Loan-product check · same deal, 3 products live
Conventional
25% down · 7.5% · 30yr
- Down + closing
- —
- Monthly P&I
- —
- Monthly cashflow
- —
- DSCR
- —
- Eligible?
- —
Personal DTI + credit; lowest rate.
DSCR
20% down · 8.5% · 30yr
- Down + closing
- —
- Monthly P&I
- —
- Monthly cashflow
- —
- DSCR
- —
- Eligible?
- —
No personal income docs; deal must DSCR.
Hard money
10% down · 12.0% · 12mo
- Down + closing
- —
- Monthly P&I
- —
- Monthly cashflow
- —
- DSCR
- —
- Eligible?
- —
Short-term bridge; refi at stabilization.
Rent comps 16 comps
| Address | Beds | Baths | Sqft | Rent | $/sqft | DOM | Units | Dist |
|---|---|---|---|---|---|---|---|---|
| 12 Holbrook Ln Willingboro, NJ | 5.0 | 2.0 | 2100 | $3,750 | $1.79 | 16d | 1 | 0.24mi |
| 16 Elridge Ln Willingboro, NJ | 3.0 | 2.0 | 1350 | $2,650 | $1.96 | 2d | 1 | 0.42mi |
| 89 Hampshire Ln Willingboro, NJ | 4.0 | 2.0 | 1562 | $3,400 | $2.18 | 11d | 1 | 0.48mi |
| 5 Burgess Ln Willingboro, NJ | 5.0 | 2.0 | 1864 | $4,500 | $2.41 | 2d | 1 | 0.72mi |
| 34 Hopkins Ln Willingboro, NJ | 3.0 | 2.0 | 1696 | $3,200 | $1.89 | 2d | 1 | 0.75mi |
| 41 Messenger Ln Willingboro, NJ | 5.0 | 2.0 | 1497 | $3,500 | $2.34 | 6d | 1 | 0.82mi |
| 10 Melville Ln Willingboro, NJ | 4.0 | 2.5 | 1797 | $3,000 | $1.67 | 16d | 1 | 0.84mi |
| 29 Hinsdale Ln Willingboro, NJ | 4.0 | 2.0 | 1570 | $3,750 | $2.39 | 2d | 1 | 0.89mi |
| 17 Bonnie Ln Willingboro, NJ | 4.0 | 2.5 | 1797 | $2,890 | $1.61 | 25d | 1 | 1.07mi |
| 1 Mystic Way Willingboro, NJ | 4.0 | 2.5 | 1952 | $3,000 | $1.54 | 6d | 1 | 1.09mi |
| 4 Elliot Ln Westampton, NJ | 3.0 | 2.5 | 1500 | $2,900 | $1.93 | 2d | 1 | 1.11mi |
| 48 Marboro Ln Willingboro, NJ | 4.0 | 2.0 | 1497 | $3,995 | $2.67 | 4d | 1 | 1.12mi |
| 62 Sharpless Blvd Westampton, NJ | 3.0 | 1.5 | 1490 | $2,275 | $1.53 | 2d | 1 | 1.14mi |
| 46 Beaverdale Ln Willingboro, NJ | 5.0 | 2.0 | 1650 | $3,450 | $2.09 | 16d | 1 | 1.16mi |
| 48 Sandstone Ln Willingboro, NJ | 4.0 | 2.0 | 1372 | $2,700 | $1.97 | 2d | 1 | 1.45mi |
| 61 Pennant Ln Willingboro, NJ | 3.0 | 2.0 | 1384 | $2,800 | $2.02 | 2d | 1 | 1.46mi |
Listing history 3 events
-
2026-05-01status Pending
-
2026-04-08$364,900 Active
-
2026-04-03historical $364,900
ⓘ Source: listings_history table (triggers on properties + properties_extension) + one-shot
backfill from property_details.listing_events for pre-trigger history.
Tax reassessment forecast NJ · Partial reset (capped growth)
- Current annual tax
- $7,960 · $663/mo
- Projected year-2 tax
- $8,523 · $710/mo
- Expected delta
- +$563/yr (+$47/mo · 7.1%)
ⓘ Screening estimate from a state-policy table — verify with the county assessor before closing.
Climate risk First Street
- Flood 1/10 Low FEMA zone X (unshaded) · 0% chance over 30 yrs
- Wildfire 1/10 Low
- Heat 7/10 Severe 7 d/yr ≥103°F today · 15 d/yr by 30 yrs out
- Wind 6/10 Major 27% chance of damaging wind over 30 yrs
- Air quality 4/10 Moderate 5 unhealthy d/yr today · 7 by 30 yrs out
Nearby sold comps map
Loading sold comps map…
Walkable amenities ~0.75 mi
Loading nearby amenities…
Taxation est. · year 1
- Rental income
- $42,462
- − Mortgage interest
- −$20,440
- − Property taxes
- −$7,960
- − Insurance
- −$1,824
- − Repairs & maintenance
- −$3,397
- − Management
- −$3,397
- − Depreciation
- −$10,615
- Taxable loss
- −$5,172
- Est. tax savings @ 24.0%
- +$1,241
- After-tax cash flow
- $2,039/yr
For passive investors: Depreciation is non-cash, so a rental often shows a tax loss while cash-flowing — sheltering income. Rental losses are passive: they offset passive income freely, and up to $25,000/yr can offset ordinary (W-2) income if you actively participate and your MAGI is under $100k (phasing out to $0 by $150k); unused losses carry forward. On sale, claimed depreciation is recaptured at up to 25%, and gains may owe capital-gains tax (a 1031 exchange can defer both). Figures are a year-1 estimate at your 24.0% rate — not tax advice; consult a CPA.
Schools (NCES district)
- District
- Willingboro Public School District
- NCES district ID
- 3418000
- Math proficiency
- 5% ▼ -11.00%
- Reading proficiency
- 30% ▼ -1.00%
- Median HH income
- $67,064
- Composite
- 17.37/100
- National rank
- #9074
- State rank
- #433 of 472 in NJ
Livability — Burlington
- Score
- 78/100
- State rank
- #89
- US rank
- #2359
Category grades
Schools grade is shown separately in the Schools card above.
Census & demographics
- County
- Burlington County · 323,710 people
- Metro
- Philadelphia-Camden-Wilmington, PA-NJ-DE-MD
- Population (ZIP)
- 31,981
- Household income
- $98,178
- Rent vs Own
- Severe rent burden
- 342.0
Population outlook (Burlington County) Hauer SSP2
- Today (2025)
- 453,425 people
- By 2030
- 452,359 · -0.2%
- By 2040
- 445,033 · -1.9%
- By 2050
- 431,760 · -4.8%
- By 2075
- 406,277 · -10.4%
- By 2100
- 364,732 · -19.6%
Race, ethnicity, and origin ACS 2023
- Neighborhood character
- Predominantly Black (66%)
- Race & ethnicity
- Black 66% Hispanic / Latino 15% Two or more races 14% White 10%
- Hispanic origin (detail)
- Puerto Rican 9% Dominican 2%
- Common ancestry
- Swiss 4% Romanian 2% Hispanic 1%
- Foreign-born
- 15% · Canada, Jamaica
- Languages at home
- 82% English-only · Spanish 10% French/Haitian/Cajun 2% Other Indo-European 1%
Political lean MEDSL · Burlington
- 2024 margin
- D (+16.6) · D 57.6% · R 41.0% · Other 1.3%
- 2008→2024 swing
- -2.0pp toward R · 2008: 18.6pp · 2024: 16.6pp
- All cycles
- 2024: D+16.6 2020: D+19.5 2016: D+14.8 2012: D+18.7 2008: D+18.6
Not yet ingested
- Civics
- —
Market trends
- HPI YoY
- ▼ -273.52%
- Current HPI
- 348.3441
- Rent YoY
- —
- Metro
- Philadelphia-Camden-Wilmington, PA-NJ-DE-MD
- State GDP YoY
- ▲ 2.05%
- F500 in state
- 34
Industry mix (Fortune 500 HQ in NJ)
| Industry | F500 HQs | Revenue |
|---|---|---|
| Consumer Goods | 3 | $31B |
|
||
| Pharmaceuticals | 2 | $153B |
|
||
| Technology | 2 | $21B |
|
||
| Insurance | 2 | $20B |
|
||
| Healthcare | 2 | $19B |
|
||
| Financial Services | 1 | $70B |
|
||
Price history
+0.0% since first listed3 events — show timeline
- 2026-05-01 Pending — BRIGHT MLS
- 2026-04-08 Listed $364,900 BRIGHT MLS
- 2026-04-03 Coming Soon $364,900 BRIGHT MLS
Property tax history
+3.5%/yrLatest (2025): $7,960 · +2.0% YoY. Source: county tax records.
Cash-flow waterfall
monthlySold comps — $/sqft
last 12 mo · ≤1 miLoading sold comps…