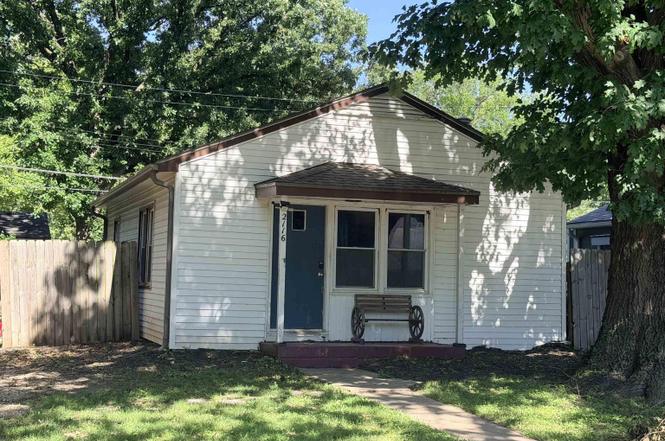
2116 Blaker Dr · Manhattan, KS
Flood risk 6/10 · Moderate
- FEMA flood zone
- X (shaded)
- Chance of flooding over 30 yrs
- 0.7%
- Est. flood insurance / yr
- $507 – $1,088
Fire risk 1/10 · Minimal
- Est. fire insurance / yr
- $1,154 – $2,142
Heat risk 4/10 · Minor
- Hot days now (above 109°F)
- 7 days/yr
- Hot days in 30 yrs
- 16 days/yr
Wind risk 2/10 · Minimal
- Chance of severe wind over 30 yrs
- —
Air-quality risk 2/10 · Minimal
- Unhealthy air days now
- 2 days/yr
- Unhealthy air days in 30 yrs
- 2 days/yr
Risk factors via First Street. Map © Google.
Why this score? — see what drove the D grade
The composite is a weighted blend of 9 inputs, each scored 0–100. Each bar is that input's sub-score; the figure is the points it added to the 100-point composite (weight × sub-score).
- Cash flow +13.5/30.0
- ARV discount +7.5/15.0
- Livability +4.2/5.0
- DSCR +4.1/10.0
- Rent growth +4.0/5.0
- 1% rule +3.7/10.0
- Schools +3.6/10.0
- Condition / age +2.5/5.0
- Appreciation +0.0/10.0
$119,000
🖨 Deal sheet (PDF) 📄 Offer letter ✓ Due diligence
Listing remarks MLS
New Furnace and A/C! UNDERGROUND STORM SHELTER. .. Rare at this price point, but super handy for homeowners! Remodeled, Cute and Affordable! Comfy bungalow has new floors, new interior paint, and ample storage space. Would make an excellent starter home! Call Marlene Irvine to view today at 785-341-8576
Key facts
- Updated windows
- Storm shelter
- New roof
Tags
Property features AI
Finance
- Other: Estimated lot approximately 0.12 acres
Exterior
- Utilities: Public water; Public sewer
- Home design: Single-family residence; Residential property
- Construction: Asphalt roof; Other construction materials; Built on crawl space
- Exterior features: Privacy fencing; Other exterior features
Interior
- Other: Crawl space basement
- Kitchen: Oven; Range; Refrigerator
- Bedrooms: 2 bedrooms on the main level
- Bathrooms: 1 full bathroom
- Heating & cooling: Electric heating; Central air; Ceiling fan(s) (also listed under interior features)
- Interior features: Ceiling fans
Neighborhood map
What this means for you Summary
Snapshot
- This is a 2-bed/1.0-bath single-family listed at $119k.
Deal economics
- At list price, monthly cash flow is $4 ($53/yr) — positive.
- The deal already cash-flows at list — no discount required.
- To meet the 1% rule (rent ≥ 1% of price), the offer needs to be $103k (13.5% below list).
- Recommended offer: $103k (13.5% below list) — sets the bar for 1% rule.
Location & tenants
- Location reads 83/100 on livability (#6 in KS, #979 nationally) — a professional / high-income tenant draw. Strengths: amenities A+, commute A+, cost of living A+; Watch: crime C-, employment C-.
- Manhattan-Ogden (urban): math 39% / reading 46% proficiency, ranked #26 of 169 in KS (top 15%) — families likely to look elsewhere, expect single-tenant / working-renter base with shorter leases.
- Zoned schools: Northview Elem (math 29% / reading 32%, grade F, #453 of 684 statewide, top 66%, 376 students, 67% FRL); Dwight D Eisenhower Middle School (math 27% / reading 33%, grade F, #64 of 219 statewide, top 32%, 740 students, 46% FRL); Manhattan High School West/East Campus (math 30% / reading 38%, grade F, #45 of 327 statewide, top 14%, 1,954 students, 35% FRL) — zoned schools average 49% FRL vs 29% district-wide (20 pts higher); higher-poverty schools than district average — tighter screening recommended.
- Market conditions: Rents rising fast (+6.0%/yr); 341 active listings in the ZIP; 132 units permitted in Riley County in 2024 (35 in 5+ unit buildings).
Forward outlook
- Local home prices are declining (-3.0%/yr); year-one equity from $823 of loan paydown is wiped out by about $4k of value loss. Plan a longer hold.
- Riley County population projected at +30% by 2050 — long-run rental-demand tailwind backs the buy-and-hold thesis.
Negotiation context
- Only 4 days on market — expect competitive offers; lowballing is unlikely to land.
- 2 sale attempts since 8y ago with the ask held roughly flat each time — persistent listings suggest the price (not the market) is what's stuck; bring a comps-based counter.
- Current owner paid $79k; list at $119k implies a 51% gain — meaningful room to come down on a strong offer.
Risks & watch-outs
- Watch-outs: built in 1952 — expect roof / HVAC / electrical / plumbing capex.
- Climate carrying-cost: major flood risk — expect insurance premiums to compound above CPI over the hold.
Questions for the listing agent
- Built in 1952 — when were the roof, HVAC, electrical panel, plumbing, and water heater last replaced?
- Is there a deadline driving the sale (1031 exchange, divorce, estate, relocation)? That informs how much negotiation room exists.
- The area grade is low — what's the realistic commute time and amenity access for the typical tenant pool here? Any planned neighborhood developments (good or bad) we should know about?
- What's the average days-on-market for RENTAL listings here right now (not sales)? A rising rental-DOM trend means longer vacancies and softer asking-rent achievability than the comps imply.
- What's the recent tenant-quality profile in this submarket — average credit score on applications, eviction rate, late-payment / NSF rate, and stable-employment percentage? A property-management company in the area should have these aggregated.
- How much new for-sale + rental construction is in the pipeline within 1–3 miles? Heavy new supply typically softens prices + rents 12–24 months out; constrained supply supports both.
Investment metrics
- 1% rule
- 0.87% ✗
- Cap rate
- 6.34%
- Cash-on-cash
- 0.16%
- DSCR
- 1.01
- GRM
- 9.6
CMA / ARV
No comps found within radius.
Projected returns pro-forma
-3.0% appreciation · 6.02% rent growth · sell at horizon
- IRR
- -12.8%
- Equity multiple
- 0.53×
- Total profit
- $-15,771
- Equity at exit
- $17,743
- IRR
- 0.3%
- Equity multiple
- 1.02×
- Total profit
- $734
- Equity at exit
- $10,289
Cash invested: $33,320 (down + closing). Projections, not guarantees.
Landlord ↔ Tenant lean methodology
- Overall (STATE)
- 83 Strongly Landlord-Friendly
- State Kansas
- 83 Strongly Landlord-Friendly · R+10
- County
- — inherits STATE
- City
- — inherits STATE
ZIP-level market 66502
- Rents YoY
- 6.0%
- Active inventory
- 341
- Price-to-rent
- 9.6×
Monthly cashflow live
- Estimated rent
- $1,030 medium interval (Pro) →
- Mortgage (P&I)
- −$624
- Tax from tax record
- −$135 /mo · $1,625/yr
- Insurance
- −$50
- HOA
- −$0
- Vacancy / Maint / Mgmt
- −$216
- Net cashflow
- $4
Break-even live
Sensitivity live
| Price | -10% $72 | -5% $38 | +0% $4 | +5% $-29 | +10% $-63 |
|---|---|---|---|---|---|
| Rent | -10% $-77 | -5% $-36 | +0% $4 | +5% $45 | +10% $86 |
| Rate | -1.0pp $64 | -0.5pp $35 | base $4 | +0.5pp $-26 | +1.0pp $-58 |
UW: 25.0% down · 7.5% · 30yr · 1.5% tax · 5.0% vac · 8.0% maint · 8.0% mgmt
Financing live
Cash to close
- Down payment
- $29,750
- Closing costs
- $3,570
- Reserves months
- —
- Total cash needed
- —
Loan-product check · same deal, 3 products live
Conventional
25% down · 7.5% · 30yr
- Down + closing
- —
- Monthly P&I
- —
- Monthly cashflow
- —
- DSCR
- —
- Eligible?
- —
Personal DTI + credit; lowest rate.
DSCR
20% down · 8.5% · 30yr
- Down + closing
- —
- Monthly P&I
- —
- Monthly cashflow
- —
- DSCR
- —
- Eligible?
- —
No personal income docs; deal must DSCR.
Hard money
10% down · 12.0% · 12mo
- Down + closing
- —
- Monthly P&I
- —
- Monthly cashflow
- —
- DSCR
- —
- Eligible?
- —
Short-term bridge; refi at stabilization.
Listing history 3 events
-
2026-06-21days on market $119,000 Active 4 DOM
-
2026-06-19days on market $119,000 Active 2 DOM
-
2026-06-18$119,000 Active 1 DOM
ⓘ Source: listings_history table (triggers on properties + properties_extension) + one-shot
backfill from property_details.listing_events for pre-trigger history.
Tax reassessment forecast KS · Resets to sale price
- Current annual tax
- $1,625 · $135/mo
- Projected year-2 tax
- $1,678 · $140/mo
- Expected delta
- +$53/yr (+$4/mo · 3.2%)
ⓘ Screening estimate from a state-policy table — verify with the county assessor before closing.
Climate risk First Street
- Flood 6/10 Major FEMA zone X (shaded) · 70% chance over 30 yrs
- Wildfire 1/10 Low
- Heat 4/10 Moderate 7 d/yr ≥109°F today · 16 d/yr by 30 yrs out
- Wind 2/10 Low
- Air quality 2/10 Low 2 unhealthy d/yr today · 2 by 30 yrs out
Nearby sold comps map
Loading sold comps map…
Walkable amenities ~0.75 mi
Loading nearby amenities…
Taxation est. · year 1
- Rental income
- $12,357
- − Mortgage interest
- −$6,666
- − Property taxes
- −$1,625
- − Insurance
- −$595
- − Repairs & maintenance
- −$989
- − Management
- −$989
- − Depreciation
- −$3,462
- Taxable loss
- −$1,968
- Est. tax savings @ 24.0%
- +$472
- After-tax cash flow
- $525/yr
For passive investors: Depreciation is non-cash, so a rental often shows a tax loss while cash-flowing — sheltering income. Rental losses are passive: they offset passive income freely, and up to $25,000/yr can offset ordinary (W-2) income if you actively participate and your MAGI is under $100k (phasing out to $0 by $150k); unused losses carry forward. On sale, claimed depreciation is recaptured at up to 25%, and gains may owe capital-gains tax (a 1031 exchange can defer both). Figures are a year-1 estimate at your 24.0% rate — not tax advice; consult a CPA.
Schools (NCES district)
- District
- Manhattan-Ogden
- NCES district ID
- 2009180
- Math proficiency
- 39% ▼ -1.00%
- Reading proficiency
- 46% ▲ 1.00%
- Median HH income
- $44,001
- Composite
- 35.97/100
- National rank
- #4795
- State rank
- #26 of 169 in KS
Livability — Manhattan
- Score
- 83/100
- State rank
- #6
- US rank
- #979
Category grades
Schools grade is shown separately in the Schools card above.
Census & demographics
- Census place
- Manhattan, KS
- County
- Riley County · 62,662 people
- City population
- 60,966
- Metro
- Manhattan, KS
- Population (ZIP)
- 43,693
- Household income
- $54,833
- Rent vs Own
- Severe rent burden
- 3089.0
Population outlook (Riley County) Hauer SSP2
- Today (2025)
- 83,656 people
- By 2030
- 89,075 · +6.5%
- By 2040
- 99,100 · +18.5%
- By 2050
- 109,146 · +30.5%
- By 2075
- 134,178 · +60.4%
- By 2100
- 153,653 · +83.7%
Race, ethnicity, and origin ACS 2023
- Neighborhood character
- Predominantly White (78%)
- Race & ethnicity
- White 78% Hispanic / Latino 9% Two or more races 8% Black 4% Asian 3% Native American 1%
- Hispanic origin (detail)
- Mexican 6%
- Common ancestry
- Slovak 3% Italian 3% Lithuanian 2%
- Foreign-born
- 8% · Canada, China
- Languages at home
- 91% English-only · Spanish 5% Other Indo-European 2% Chinese 1%
Political lean MEDSL · Riley
- 2024 margin
- Toss-up / Even · D 49.6% · R 47.8% · Other 2.5%
- 2008→2024 swing
- +8.8pp toward D · 2008: -7.0pp · 2024: 1.8pp
- All cycles
- 2024: D+1.8 2020: D+3.2 2016: R+4.5 2012: R+12.7 2008: R+7.0
Not yet ingested
- Civics
- —
Market trends
- HPI YoY
- ▼ -283.54%
- Current HPI
- 172.7795
- Rent YoY
- ▲ 6.02%
- Metro
- Manhattan, KS
- State GDP YoY
- —
- F500 in state
- 0
Price history
+58.7% since first listed7 events — show timeline
- 2026-06-15 Listed $119,000 FHAOR as distributed by MLS GRID
- 2018-10-22 Sold (Public Records) — Public Records
- 2018-10-22 Sold (MLS) — FHAOR as distributed by MLS GRID
- 2018-06-18 Listed $79,000 FHAOR as distributed by MLS GRID
- 2007-05-01 Sold (Public Records) $79,000 Public Records
- 2005-12-01 Sold (Public Records) $61,000 Public Records
- 1999-08-01 Sold (Public Records) $75,000 Public Records
Property tax history
+3.0%/yrLatest (2025): $1,625 · +0.7% YoY. Source: county tax records.
Cash-flow waterfall
monthlySold comps — $/sqft
last 12 mo · ≤1 miLoading sold comps…