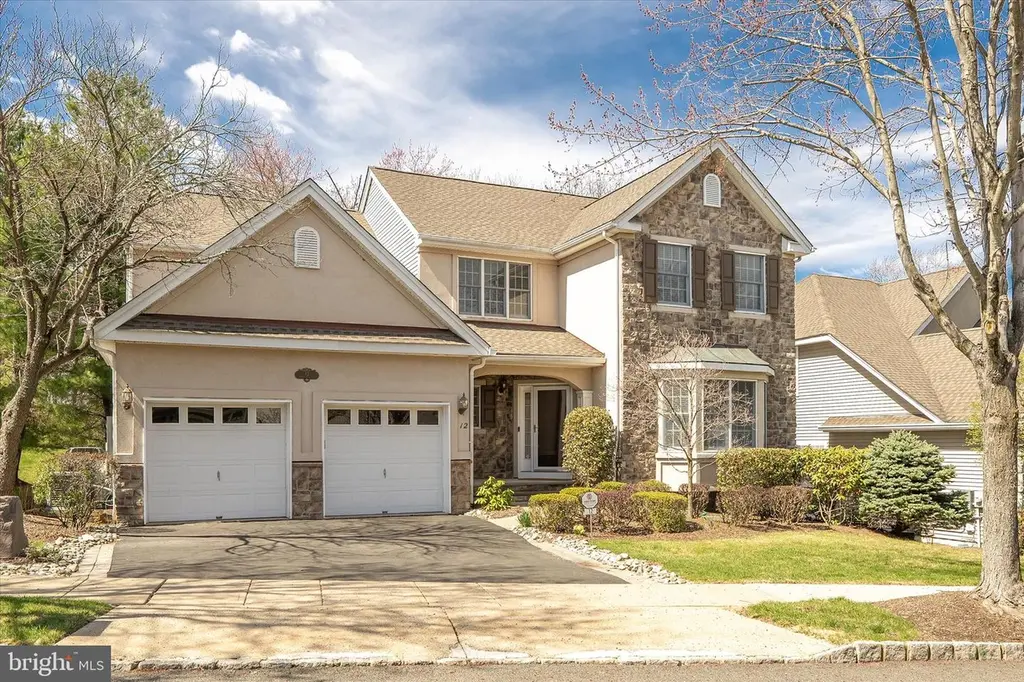
12 Ironwood Rd · Princeton, NJ
Flood risk 1/10 · Minimal
- FEMA flood zone
- X (unshaded)
- Chance of flooding over 30 yrs
- 0.0%
- Est. flood insurance / yr
- $507 – $1,088
Fire risk 4/10 · Minor
- Est. fire insurance / yr
- $526 – $976
Heat risk 5/10 · Moderate
- Hot days now (above 100°F)
- 7 days/yr
- Hot days in 30 yrs
- 15 days/yr
Wind risk 6/10 · Moderate
- Chance of severe wind over 30 yrs
- 27.0%
Air-quality risk 4/10 · Minor
- Unhealthy air days now
- 3 days/yr
- Unhealthy air days in 30 yrs
- 5 days/yr
Risk factors via First Street. Map © Google.
Why this score? — see what drove the D+ grade
The composite is a weighted blend of 9 inputs, each scored 0–100. Each bar is that input's sub-score; the figure is the points it added to the 100-point composite (weight × sub-score).
- ARV discount +15.0/15.0
- Cash flow +11.1/30.0
- Schools +6.5/10.0
- 1% rule +4.5/10.0
- Livability +4.4/5.0
- DSCR +3.2/10.0
- Rent growth +2.5/5.0
- Condition / age +2.5/5.0
- Appreciation +0.0/10.0
$925,000
🖨 Deal sheet (PDF) 📄 Offer letter ✓ Due diligence
Listing remarks
Enter this beautiful 3150 sf stucco and stone facade home in the much sought after Clubside at Cherry Valley (55+) active community. This is the largest model in the community and it is situated on a prime lot, backing to woods on a cul de sac. The grand entry opens into a flex room, currently used as an office, with glass French doors. The room has a bay window which lets in so much light, double closets, crown molding and custom blinds. As you continue into this gracious home, there is a large Dining Room with crown molding and chair rail, oversized windows and solid wood floors. The large Great Room with an impressive two-story vaulted ceiling, gas fireplace, wood floors, two ceiling fan
Key facts
- 7,645 sq ft lot
- 2 garage spots
- Built 2000
Property features AI
Finance
- Other: Property manager present
- HOA & community: HOA fee of $1,360 quarterly; Senior community with age requirement of 55
Exterior
- Parking: Attached 2-car garage with front entry, inside access, garage door opener and additional storage area; Driveway with 2 parking spaces; Total of 4 garage/parking spaces
- Utilities: Public water; Public sewer; Electric available; Natural gas available; Cable TV available; Phone available
- Home design: Detached property; Located in a 55+ senior community; Fee simple ownership
- Construction: Frame construction; Foundation: block and poured concrete perimeter; Active radon mitigation; Window features include double-hung and sliding windows with double-pane glass and screens
- Exterior features: Not in a federal flood zone; Above- and below-grade additional structures; Sump pump; Outside entrance to basement
Interior
- Kitchen: Built-in microwave
- Bedrooms: One bedroom on the main level; Two bedrooms on the upper level
- Flooring: Wood floors; Carpet
- Bathrooms: Two full bathrooms; One half bathroom; Full bath on main level; Full bath on upper level
- Heating & cooling: 90% forced air heating (natural gas); Central heating; Central air conditioning; Ceiling fans; Programmable thermostat; 60+ gallon natural gas hot water tank
- Interior features: Stall shower, tub shower and soaking tub; Breakfast area; Chair railings; Formal separate dining room; Ceiling fan(s); Carpet and wood floors; Walk-in closet(s); Entry-level bedroom
- Laundry & utility: Laundry on the main floor
Neighborhood map
What this means for you Summary
Snapshot
- This is a 3-bed/2.5-bath single-family listed at $925k.
Deal economics
- At list price, monthly cash flow is $-369 ($-4k/yr) — negative.
- To cash-flow at today's rent, offer at most $860k (7.0% below list).
- To meet the 1% rule (rent ≥ 1% of price), the offer needs to be $875k (5.4% below list).
- Recommended offer: $860k (7.0% below list) — sets the bar for cash-flow.
- Cap rate 5.8% vs local median 0.7% in Princeton — top-decile yield for the area; either an underpriced asset or a hidden risk that comps aren't pricing in. Stress-test before assuming the spread holds.
Location & tenants
- Location reads 87/100 on livability (#7 in NJ, #252 nationally) — a professional / high-income tenant draw. Strengths: crime A+, amenities A+, commute A+; Watch: cost of living F.
- Montgomery Township School District (rural): math 59% / reading 71% proficiency, ranked #15 of 472 in NJ (top 3%) — acceptable for families but not a draw, mixed tenant base, ~2y average lease; only 3% free/reduced lunch — higher-income household profile.
- Zoned schools: Orchard Hill Elementary School (813 students, 6% FRL); Montgomery Upper Middle School (math 55% / reading 77%, grade A-, #19 of 431 statewide, top 5%, 790 students, 5% FRL); Montgomery High School (math 52% / reading 75%, grade B-, #47 of 399 statewide, top 12%, 1,603 students, 4% FRL) — zoned schools at 5% FRL track the district average.
- Market conditions: 46 active listings in the ZIP; 1 comparable units currently listed for rent nearby; 678 units permitted in Somerset County in 2024 (296 in 5+ unit buildings).
Forward outlook
- Local home prices are declining (-3.0%/yr); year-one equity from $6k of loan paydown is wiped out by about $28k of value loss. Plan a longer hold.
- Somerset County population projected at +13% by 2050 — modest demand growth; plan on rents tracking national, not racing it.
Negotiation context
- Only 10 days on market — expect competitive offers; lowballing is unlikely to land.
- 4 sale attempts since 21y ago with the ask held roughly flat each time — persistent listings suggest the price (not the market) is what's stuck; bring a comps-based counter.
- Current owner paid $745k; 24% above their basis — modest negotiation headroom, anchor on the comps not their cost.
Risks & watch-outs
- Climate carrying-cost: major wind risk, 27% chance of damaging wind over 30y; extreme-heat days projected 7→15/yr by 2055 (HVAC capex compounding) — expect insurance premiums to compound above CPI over the hold.
Questions for the listing agent
- What do current leases actually rent for vs. the listed asking? Can we see a recent rent roll and the last 12 months of T-12 income?
- What does the HOA fee cover, when was the last increase, and are there any pending special assessments or reserve-fund shortfalls?
- Is there a deadline driving the sale (1031 exchange, divorce, estate, relocation)? That informs how much negotiation room exists.
- Schools are A-rated — typically a magnet for longer-tenancy family renters. What's the average tenant stay here, and is there a school-zone premium baked into asking?
- The area grade is low — what's the realistic commute time and amenity access for the typical tenant pool here? Any planned neighborhood developments (good or bad) we should know about?
- What's the average days-on-market for RENTAL listings here right now (not sales)? A rising rental-DOM trend means longer vacancies and softer asking-rent achievability than the comps imply.
- What's the recent tenant-quality profile in this submarket — average credit score on applications, eviction rate, late-payment / NSF rate, and stable-employment percentage? A property-management company in the area should have these aggregated.
- How much new for-sale + rental construction is in the pipeline within 1–3 miles? Heavy new supply typically softens prices + rents 12–24 months out; constrained supply supports both.
Investment metrics
- 1% rule
- 0.95% ✗
- Cap rate
- 5.81%
- Cash-on-cash
- -1.71%
- DSCR
- 0.92
- GRM
- 8.8
CMA / ARV
- ARV (on-the-fly)
- $1,237,948
- Comps found
- 10
Show comp detail 10 sales within ~0.75 mi
| Address | Dist | Beds/Ba | Sqft | Sold | Price | $/sf | Match |
|---|---|---|---|---|---|---|---|
| 12 Ironwood Rd | 0.00mi | 3/2.5 | 3,142 (0%) | 1mo | $925,000 | $294 | 99 |
| 165 Heather Ln | 0.21mi | 4/3.0 (+1) | 3,218 (+2%) | 2mo | $1,260,000 | $392 | 78 |
| 11 Valencia Ct | 0.27mi | 3/2.5 | 3,028 (-4%) | 22mo | $787,000 | $260 | 63 |
| 513 Cherry Valley Rd | 0.34mi | 4/3.0 (+1) | 2,862 (-9%) | 4mo | $800,000 | $280 | 59 |
| 9 Winged Foot Ct | 0.63mi | 4/3.5 (+1) | 3,104 (-1%) | 2mo | $1,245,000 | $401 | 58 |
| 1 Interlacken Ct | 0.30mi | 4/2.5 (+1) | 2,688 (-14%) | 1mo | $1,250,000 | $465 | 56 |
| 8 Wild Dunes Ct | 0.37mi | 4/2.5 (+1) | 3,384 (+8%) | 22mo | $1,180,000 | $349 | 47 |
| 3 Pauma Valley Ct | 0.70mi | 4/3.5 (+1) | 2,789 (-11%) | 11mo | $1,100,000 | $394 | 30 |
| 19 Heritage Hills Ct | 0.69mi | 4/2.5 (+1) | 2,688 (-14%) | 14mo | $1,200,000 | $446 | 27 |
| 14 Avalon Lakes Ct | 0.59mi | 4/2.5 (+1) | 2,688 (-14%) | 23mo | $1,145,000 | $426 | 24 |
Match score weights: distance 35% · size 25% · config 20% · recency 20%. Top-matched comps best support the ARV.
Projected returns pro-forma
-3.0% appreciation · 3.0% rent growth · sell at horizon
- IRR
- -19.0%
- Equity multiple
- 0.33×
- Total profit
- $-172,707
- Equity at exit
- $137,921
- IRR
- -11.4%
- Equity multiple
- 0.31×
- Total profit
- $-177,889
- Equity at exit
- $79,977
Cash invested: $259,000 (down + closing). Projections, not guarantees.
Landlord ↔ Tenant lean methodology
- Overall (STATE)
- 21 Tenant-Leaning
- State New Jersey
- 21 Tenant-Leaning · D+6
- County
- — inherits STATE
- City
- — inherits STATE
ZIP-level market 08558
- Home prices YoY
- -29.2%
- Active inventory
- 46
- Price-to-rent
- 8.8×
Monthly cashflow live
- Estimated rent
- $8,750 medium interval (Pro) →
- Mortgage (P&I)
- −$4,851
- Tax from tax record
- −$1,592 /mo · $19,106/yr
- Insurance
- −$385
- HOA
- −$453
- Vacancy / Maint / Mgmt
- −$1,838
- Net cashflow
- $-369
Break-even live
Sensitivity live
| Price | -10% $155 | -5% $-107 | +0% $-369 | +5% $-631 | +10% $-893 |
|---|---|---|---|---|---|
| Rent | -10% $-1,060 | -5% $-715 | +0% $-369 | +5% $-23 | +10% $322 |
| Rate | -1.0pp $97 | -0.5pp $-134 | base $-369 | +0.5pp $-609 | +1.0pp $-852 |
UW: 25.0% down · 7.5% · 30yr · 1.5% tax · 5.0% vac · 8.0% maint · 8.0% mgmt
Financing live
Cash to close
- Down payment
- $231,250
- Closing costs
- $27,750
- Reserves months
- —
- Total cash needed
- —
Loan-product check · same deal, 3 products live
Conventional
25% down · 7.5% · 30yr
- Down + closing
- —
- Monthly P&I
- —
- Monthly cashflow
- —
- DSCR
- —
- Eligible?
- —
Personal DTI + credit; lowest rate.
DSCR
20% down · 8.5% · 30yr
- Down + closing
- —
- Monthly P&I
- —
- Monthly cashflow
- —
- DSCR
- —
- Eligible?
- —
No personal income docs; deal must DSCR.
Hard money
10% down · 12.0% · 12mo
- Down + closing
- —
- Monthly P&I
- —
- Monthly cashflow
- —
- DSCR
- —
- Eligible?
- —
Short-term bridge; refi at stabilization.
Rent comps 1 comps
| Address | Beds | Baths | Sqft | Rent | $/sqft | DOM | Units | Dist |
|---|---|---|---|---|---|---|---|---|
| 12 Windermere Way Princeton, NJ | 4.0 | 3.5 | 4359 | $8,750 | $2.01 | 15d | 1 | 1.33mi |
HOA detail
- Monthly dues
- $453 · $5,436/yr
- Likely covers
- gas
Listing history 12 events
-
2026-05-06status Pending
-
2026-04-15status Under Contract
-
2026-04-13historical Active Under Contract
-
2026-04-03$925,000 Active
-
2026-04-03$925,000 Active
-
2025-12-09historical
-
2025-10-20price $945,000
-
2025-09-25$995,000 Active
-
2005-08-25soldstatus $745,000
-
2005-08-22soldstatus $745,000
-
2005-06-25historical
-
2005-06-21$745,000
ⓘ Source: listings_history table (triggers on properties + properties_extension) + one-shot
backfill from property_details.listing_events for pre-trigger history.
Tax reassessment forecast NJ · Partial reset (capped growth)
- Current annual tax
- $19,106 · $1,592/mo
- Projected year-2 tax
- $21,069 · $1,756/mo
- Expected delta
- +$1,963/yr (+$164/mo · 10.3%)
ⓘ Screening estimate from a state-policy table — verify with the county assessor before closing.
Climate risk First Street
- Flood 1/10 Low FEMA zone X (unshaded) · 0% chance over 30 yrs
- Wildfire 4/10 Moderate
- Heat 5/10 Major 7 d/yr ≥100°F today · 15 d/yr by 30 yrs out
- Wind 6/10 Major 27% chance of damaging wind over 30 yrs
- Air quality 4/10 Moderate 3 unhealthy d/yr today · 5 by 30 yrs out
Nearby sold comps map
Loading sold comps map…
Walkable amenities ~0.75 mi
Loading nearby amenities…
Taxation est. · year 1
- Rental income
- $105,000
- − Mortgage interest
- −$51,814
- − Property taxes
- −$19,106
- − Insurance
- −$4,625
- − Repairs & maintenance
- −$8,400
- − Management
- −$8,400
- − HOA
- −$5,436
- − Depreciation
- −$26,909
- Taxable loss
- −$19,691
- Est. tax savings @ 24.0%
- +$4,726
- After-tax cash flow
- $299/yr
For passive investors: Depreciation is non-cash, so a rental often shows a tax loss while cash-flowing — sheltering income. Rental losses are passive: they offset passive income freely, and up to $25,000/yr can offset ordinary (W-2) income if you actively participate and your MAGI is under $100k (phasing out to $0 by $150k); unused losses carry forward. On sale, claimed depreciation is recaptured at up to 25%, and gains may owe capital-gains tax (a 1031 exchange can defer both). Figures are a year-1 estimate at your 24.0% rate — not tax advice; consult a CPA.
Schools (NCES district)
- District
- Montgomery Township School District
- NCES district ID
- 3410590
- Math proficiency
- 59% ▼ -17.00%
- Reading proficiency
- 71% ▼ -7.00%
- Median HH income
- $152,313
- Composite
- 64.96/100
- National rank
- #506
- State rank
- #15 of 472 in NJ
Livability — Princeton
- Score
- 87/100
- State rank
- #7
- US rank
- #252
Category grades
Schools grade is shown separately in the Schools card above.
Census & demographics
- City population
- 52,921
- Population (ZIP)
- 7,236
Population outlook (Somerset County) Hauer SSP2
- Today (2025)
- 356,675 people
- By 2030
- 367,194 · +2.9%
- By 2040
- 386,571 · +8.4%
- By 2050
- 401,708 · +12.6%
- By 2075
- 438,898 · +23.1%
- By 2100
- 448,170 · +25.7%
Race, ethnicity, and origin ACS 2023
- Neighborhood character
- Diverse neighborhood (Simpson 0.60)
- Race & ethnicity
- White 57% Asian 26% Black 7% Two or more races 6% Hispanic / Latino 6%
- Hispanic origin (detail)
- Cuban 2% Dominican 2%
- Common ancestry
- Romanian 6% Scotch-Irish 3% Lithuanian 2%
- Foreign-born
- 26% · China, Canada, South Korea
- Languages at home
- 71% English-only · Chinese 10% Other Indo-European 8% Other Asian/Pacific 5%
Political lean MEDSL · Somerset
- 2024 margin
- D (+13.9) · D 55.7% · R 41.8% · Other 2.5%
- 2008→2024 swing
- +7.8pp toward D · 2008: 6.1pp · 2024: 13.9pp
- All cycles
- 2024: D+13.9 2020: D+21.0 2016: D+12.4 2012: D+5.2 2008: D+6.1
Not yet ingested
- Civics
- —
Market trends
- HPI YoY
- ▼ -98.27%
- Current HPI
- 237.858
- Rent YoY
- —
- Metro
- —
- State GDP YoY
- ▲ 2.05%
- F500 in state
- 34
Industry mix (Fortune 500 HQ in NJ)
| Industry | F500 HQs | Revenue |
|---|---|---|
| Consumer Goods | 3 | $31B |
|
||
| Pharmaceuticals | 2 | $153B |
|
||
| Technology | 2 | $21B |
|
||
| Insurance | 2 | $20B |
|
||
| Healthcare | 2 | $19B |
|
||
| Financial Services | 1 | $70B |
|
||
Price history
+24.2% since first listed12 events — show timeline
- 2026-05-06 Pending — BRIGHT MLS
- 2026-04-15 Pending — GSMLS
- 2026-04-13 Contingent — BRIGHT MLS
- 2026-04-03 Listed $925,000 GSMLS
- 2026-04-03 Listed $925,000 BRIGHT MLS
- 2025-12-09 Listing Removed — BRIGHT MLS
- 2025-10-20 Price Changed $945,000 BRIGHT MLS
- 2025-09-25 Listed $995,000 BRIGHT MLS
- 2005-08-25 Sold (Public Records) $745,000 Public Records
- 2005-08-22 Sold (MLS) $745,000 BRIGHT MLS
- 2005-06-25 Listing Removed — BRIGHT MLS
- 2005-06-21 Listed $745,000 BRIGHT MLS
Property tax history
+1.4%/yrLatest (2025): $19,106 · +1.8% YoY. Source: county tax records.
Cash-flow waterfall
monthlySold comps — $/sqft
last 12 mo · ≤1 miLoading sold comps…