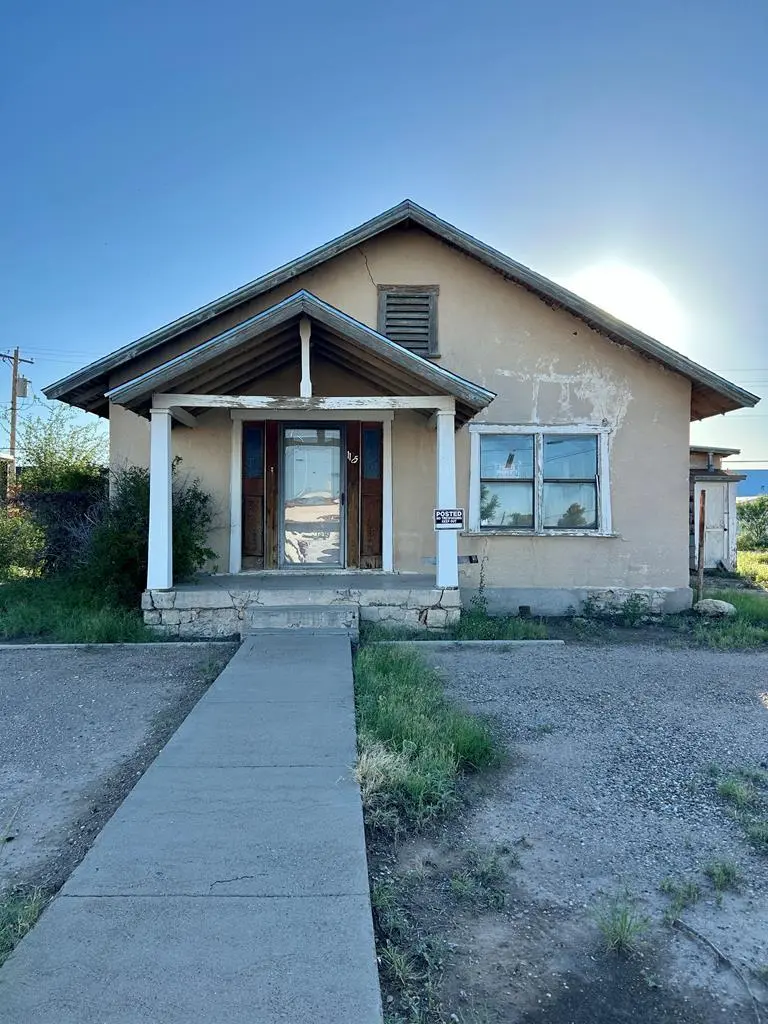
1105 N Front · Fort Stockton, TX
Flood risk 1/10 · Minimal
- FEMA flood zone
- —
- Chance of flooding over 30 yrs
- 0.0%
- Est. flood insurance / yr
- —
Fire risk 6/10 · Moderate
- Est. fire insurance / yr
- $1,222 – $2,270
Heat risk 6/10 · Moderate
- Hot days now (above 101°F)
- 7 days/yr
- Hot days in 30 yrs
- 20 days/yr
Wind risk 1/10 · Minimal
- Chance of severe wind over 30 yrs
- —
Air-quality risk 1/10 · Minimal
- Unhealthy air days now
- 0 days/yr
- Unhealthy air days in 30 yrs
- 0 days/yr
Risk factors via First Street. Map © Google.
Why this score? — see what drove the C+ grade
The composite is a weighted blend of 9 inputs, each scored 0–100. Each bar is that input's sub-score; the figure is the points it added to the 100-point composite (weight × sub-score).
- Cash flow +27.1/30.0
- DSCR +9.4/10.0
- 1% rule +9.3/10.0
- ARV discount +7.5/15.0
- Livability +3.4/5.0
- Rent growth +2.5/5.0
- Condition / age +2.5/5.0
- Schools +2.2/10.0
- Appreciation +0.0/10.0
$99,900
🖨 Deal sheet 📄 Offer letter ✓ Due diligence
Listing remarks
Prime Location & Incredible Opportunity! This unique property is a must see for investors and first time homebuyers. As you step inside, you will discover beautiful hardwood floors & a cozy wood burning fireplace. One of the home's standout features is its 2 full kitchens, offering exceptional flexibility for multi-generation living, rental income potential, or a future tenant setup. Whether you are looking to expand your investment portfolio or purchase your first home, this property offers endless possibilities!
Key facts
- 2 full kitchens
- 0.29 acre lot
- Built 1970
Tags
Property features AI
Exterior
- Utilities: Public water; Public sewer
- Home design: Single family residence; One-story
- Construction: Slab foundation
- Exterior features: Composition roof
Interior
- Flooring: Hardwood; Tile; Vinyl
- Bathrooms: 2 full bathrooms
- Heating & cooling: Ceiling fan(s)
- Interior features: In-law floorplan; Living room wood-burning fireplace
- Laundry & utility: Gas water heater
Neighborhood map
What this means for you Summary
Snapshot
- This is a 3-bed/1.0-bath single-family listed at $100k.
Deal economics
- At list price, monthly cash flow is $282 ($3k/yr) — positive.
- The deal already cash-flows at list — no discount required.
- Meets the 1% rule at list price ($1k rent vs $100k).
Location & tenants
- Location reads 67/100 on livability (#532 in TX) — a middle-class / working-renter tenant base. Strengths: crime A+, cost of living A+, housing A+; Watch: health & safety C-, amenities F, commute F.
- Fort Stockton ISD (town): math 23% / reading 28% proficiency, ranked #709 of 826 in TX (top 86%) — low school quality limits family demand, transient renter base, plan for 1-2y turnover.
- Zoned schools: Fort Stockton Apache El (math 32% / reading 32%, grade F, #2,268 of 4,322 statewide, top 55%, 333 students, 81% FRL); Fort Stockton Middle (math 15% / reading 23%, grade F, #1,466 of 1,662 statewide, top 89%, 515 students, 59% FRL); Fort Stockton High (math 27% / reading 29%, grade F, #1,170 of 1,632 statewide, top 72%, 698 students, 71% FRL).
- Market conditions: 109 active listings in the ZIP; 10 units permitted in Pecos County in 2024 (5 in 5+ unit buildings).
Forward outlook
- Local home prices are declining (-3.0%/yr); year-one equity from $691 of loan paydown is wiped out by about $3k of value loss. Plan a longer hold.
- Pecos County population projected at +25% by 2050 — long-run rental-demand tailwind backs the buy-and-hold thesis.
- At projected returns (-3.0% appreciation + 3.0% rent growth), your $28k cash investment doubles in ~10 years — after that, you're playing with house money.
Negotiation context
- Only 9 days on market — expect competitive offers; lowballing is unlikely to land.
Risks & watch-outs
- Watch-outs: property tax is 3.4% of price.
- Climate carrying-cost: major wildfire risk; extreme-heat days projected 7→20/yr by 2055 (HVAC capex compounding) — expect insurance premiums to compound above CPI over the hold.
Questions for the listing agent
- Built in 1970 — when were the roof, HVAC, electrical panel, plumbing, and water heater last replaced?
- Property tax is high relative to price — has the assessment been appealed recently, and will the sale trigger a re-assessment?
- Is there a deadline driving the sale (1031 exchange, divorce, estate, relocation)? That informs how much negotiation room exists.
- Schools are F-rated, which usually means shorter tenancies and higher turnover. Who's the typical renter profile here, and what's been the actual vacancy rate?
- What's the average days-on-market for RENTAL listings here right now (not sales)? A rising rental-DOM trend means longer vacancies and softer asking-rent achievability than the comps imply.
- What's the recent tenant-quality profile in this submarket — average credit score on applications, eviction rate, late-payment / NSF rate, and stable-employment percentage? A property-management company in the area should have these aggregated.
- How much new for-sale + rental construction is in the pipeline within 1–3 miles? Heavy new supply typically softens prices + rents 12–24 months out; constrained supply supports both.
Investment metrics
- 1% rule
- 1.43% ✓
- Cap rate
- 9.68%
- Cash-on-cash
- 12.10%
- DSCR
- 1.54
- GRM
- 5.8
CMA / ARV
No comps found within radius.
Projected returns pro-forma
-3.0% appreciation · 3.0% rent growth · sell at horizon
- IRR
- 1.8%
- Equity multiple
- 1.07×
- Total profit
- $1,892
- Equity at exit
- $14,895
- IRR
- 11.5%
- Equity multiple
- 1.90×
- Total profit
- $25,260
- Equity at exit
- $8,638
Cash invested: $27,972 (down + closing). Projections, not guarantees.
Landlord ↔ Tenant lean methodology
- Overall (STATE)
- 87 Strongly Landlord-Friendly
- State Texas
- 87 Strongly Landlord-Friendly · R+5
- County
- — inherits STATE
- City
- — inherits STATE
ZIP-level market 79735
- Active inventory
- 109
- Price-to-rent
- 5.8×
Monthly cashflow live
- Estimated rent
- $1,432 medium interval (Pro) →
- Mortgage (P&I)
- −$524
- Tax from tax record
- −$284 /mo · $3,403/yr
- Insurance
- −$42
- HOA
- −$0
- Vacancy / Maint / Mgmt
- −$301
- Net cashflow
- $282
Break-even live
UW: 25.0% down · 7.5% · 30yr · 1.5% tax · 5.0% vac · 8.0% maint · 8.0% mgmt
Financing live
Cash to close
- Down payment
- $24,975
- Closing costs
- $2,997
- Reserves months
- —
- Total cash needed
- —
Loan-product check · same deal, 3 products live
Conventional
25% down · 7.5% · 30yr
- Down + closing
- —
- Monthly P&I
- —
- Monthly cashflow
- —
- DSCR
- —
- Eligible?
- —
Personal DTI + credit; lowest rate.
DSCR
20% down · 8.5% · 30yr
- Down + closing
- —
- Monthly P&I
- —
- Monthly cashflow
- —
- DSCR
- —
- Eligible?
- —
No personal income docs; deal must DSCR.
Hard money
10% down · 12.0% · 12mo
- Down + closing
- —
- Monthly P&I
- —
- Monthly cashflow
- —
- DSCR
- —
- Eligible?
- —
Short-term bridge; refi at stabilization.
Listing history 8 events
-
2026-06-18days on market $99,900 Active 9 DOM
-
2026-06-17days on market $99,900 Active 8 DOM
-
2026-06-16days on market $99,900 Active 7 DOM
-
2026-06-15days on market $99,900 Active 6 DOM
-
2026-06-13days on market $99,900 Active 4 DOM
-
2026-06-12days on market $99,900 Active 3 DOM
-
2026-06-09remarks 523-char remark
-
2026-06-09$99,900 Active 1 DOM
ⓘ Source: listings_history table (triggers on properties + properties_extension) + one-shot
backfill from property_details.listing_events for pre-trigger history.
Tax reassessment forecast TX · Resets to sale price
- Current annual tax
- $3,403 · $284/mo
- Projected year-2 tax
- $3,403 · $284/mo
- Expected delta
- $0/yr ($0/mo · 0.0%)
ⓘ Screening estimate from a state-policy table — verify with the county assessor before closing.
Climate risk First Street
- Flood 1/10 Low 0% chance over 30 yrs
- Wildfire 6/10 Major
- Heat 6/10 Major 7 d/yr ≥101°F today · 20 d/yr by 30 yrs out
- Wind 1/10 Low
- Air quality 1/10 Low 0 unhealthy d/yr today · 0 by 30 yrs out
Nearby sold comps map
Loading sold comps map…
Walkable amenities ~0.75 mi
Loading nearby amenities…
Taxation est. · year 1
- Rental income
- $17,182
- − Mortgage interest
- −$5,596
- − Property taxes
- −$3,403
- − Insurance
- −$500
- − Repairs & maintenance
- −$1,375
- − Management
- −$1,375
- − Depreciation
- −$2,906
- Taxable income
- $2,028
- Est. tax owed @ 24.0%
- −$487
- After-tax cash flow
- $2,897/yr
For passive investors: Depreciation is non-cash, so a rental often shows a tax loss while cash-flowing — sheltering income. Rental losses are passive: they offset passive income freely, and up to $25,000/yr can offset ordinary (W-2) income if you actively participate and your MAGI is under $100k (phasing out to $0 by $150k); unused losses carry forward. On sale, claimed depreciation is recaptured at up to 25%, and gains may owe capital-gains tax (a 1031 exchange can defer both). Figures are a year-1 estimate at your 24.0% rate — not tax advice; consult a CPA.
Schools (NCES district)
- District
- Fort Stockton ISD
- NCES district ID
- 4820190
- Math proficiency
- 23% ▼ -10.00%
- Reading proficiency
- 28% ▼ -5.00%
- Median HH income
- $43,194
- Composite
- 21.81/100
- National rank
- #8247
- State rank
- #709 of 826 in TX
Livability — Fort Stockton
- Score
- 67/100
- State rank
- #532
- US rank
- #10399
Category grades
Schools grade is shown separately in the Schools card above.
Census & demographics
- Census place
- Fort Stockton, TX
- Population (ZIP)
- 12,962
Population outlook (Pecos County) Hauer SSP2
- Today (2025)
- 17,291 people
- By 2030
- 17,999 · +4.1%
- By 2040
- 19,729 · +14.1%
- By 2050
- 21,655 · +25.2%
- By 2075
- 26,049 · +50.7%
- By 2100
- 27,196 · +57.3%
Race, ethnicity, and origin ACS 2023
- Neighborhood character
- Predominantly Hispanic (76%)
- Race & ethnicity
- Hispanic / Latino 76% Two or more races 23% White 17% Black 4% Asian 3%
- Hispanic origin (detail)
- Mexican 70%
- Common ancestry
- Italian 1% Slovak 1% Lithuanian 1%
- Foreign-born
- 13% · Canada
- Languages at home
- 47% English-only · Spanish 51% Other Indo-European 2%
Political lean MEDSL · Pecos
- 2024 margin
- Solid R (+44.8) · D 27.0% · R 71.9% · Other 1.1%
- 2008→2024 swing
- -19.8pp toward R · 2008: -25.0pp · 2024: -44.8pp
- All cycles
- 2024: R+44.8 2020: R+39.3 2016: R+21.9 2012: R+22.2 2008: R+25.0
Not yet ingested
- Civics
- —
Market trends
- HPI YoY
- ▼ -77.34%
- Current HPI
- 138.1106
- Rent YoY
- —
- Metro
- —
- State GDP YoY
- ▲ 3.95%
- F500 in state
- 110
Industry mix (Fortune 500 HQ in TX)
| Industry | F500 HQs | Revenue |
|---|---|---|
| Energy | 16 | $1,198B |
|
||
| Technology | 5 | $198B |
|
||
| Engineering / Construction | 4 | $72B |
|
||
| Energy Services | 3 | $60B |
|
||
| Utilities | 3 | $41B |
|
||
| Healthcare | 2 | $330B |
|
||
Price history
3 events — show timeline
- 2026-06-09 Listed $99,900 PBBOR
- 2005-09-22 Sold (Public Records) — Public Records
- 1992-11-06 Sold (Public Records) — Public Records
Property tax history
+10.2%/yrLatest (2025): $3,403 · +3.6% YoY. Source: county tax records.
Cash-flow waterfall
monthlySold comps — $/sqft
last 12 mo · ≤1 miLoading sold comps…