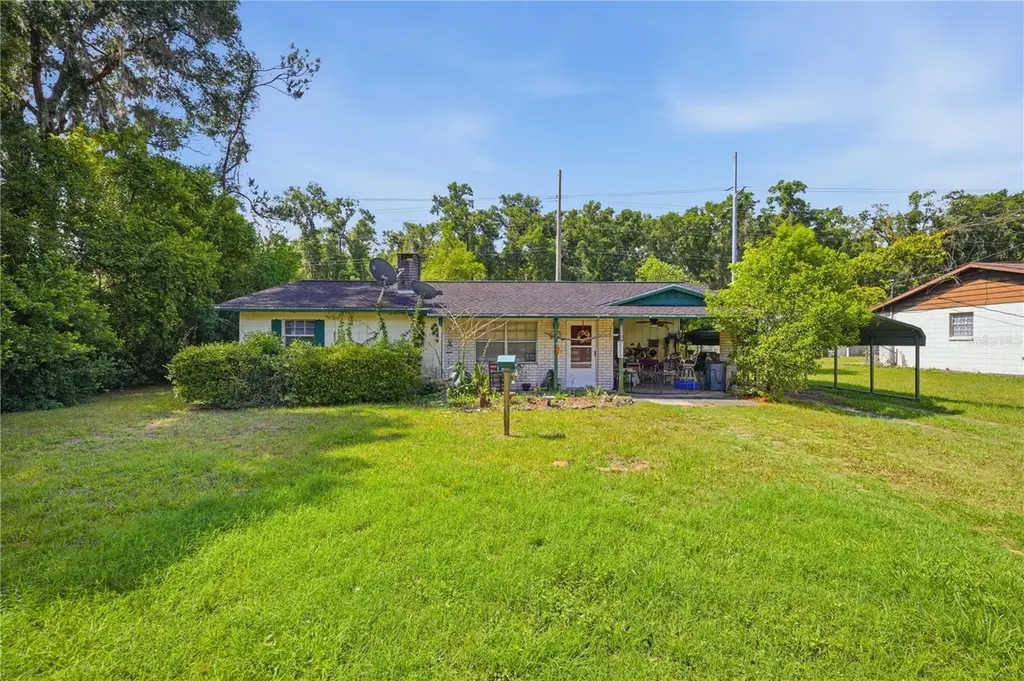
1504 NE 31st Pl · Ocala, FL
Flood risk 9/10 · Severe
- FEMA flood zone
- X (unshaded)
- Chance of flooding over 30 yrs
- 0.99%
- Est. flood insurance / yr
- $507 – $1,088
Fire risk 4/10 · Minor
- Est. fire insurance / yr
- $947 – $1,759
Heat risk 8/10 · Major
- Hot days now (above 108°F)
- 7 days/yr
- Hot days in 30 yrs
- 21 days/yr
Wind risk 9/10 · Severe
- Chance of severe wind over 30 yrs
- 99.0%
Air-quality risk 4/10 · Minor
- Unhealthy air days now
- 5 days/yr
- Unhealthy air days in 30 yrs
- 5 days/yr
Risk factors via First Street. Map © Google.
Why this score? — see what drove the C- grade
The composite is a weighted blend of 9 inputs, each scored 0–100. Each bar is that input's sub-score; the figure is the points it added to the 100-point composite (weight × sub-score).
- Cash flow +18.2/30.0
- ARV discount +15.0/15.0
- DSCR +5.7/10.0
- 1% rule +4.0/10.0
- Schools +3.6/10.0
- Livability +3.5/5.0
- Rent growth +2.5/5.0
- Condition / age +2.5/5.0
- Appreciation +0.0/10.0
$148,000
🖨 Deal sheet 📄 Offer letter ✓ Due diligence
Listing remarks
Cute concrete block 2 bedroom, 1 bath home situated on an oversized 0.31-acre lot with no HOA. Features include a cozy wood-burning fireplace, no carpet throughout, and a 2018 roof. Enjoy the privacy of no neighbors on the left side, mature trees, a fully fenced backyard with a separate dog run area, storage shed, well and septic, plus both an attached carport and additional detached carport for extra parking or storage. Conveniently located with room to spread out and enjoy.
Key facts
- 2018 roof
- No carpet
- Oversized lot
Tags
Property features AI
Finance
- Other: Lot is level and paved; Approximately 0.31 acre (0.25 to less than 0.5 acre); Road surface is paved; One well and one septic on property; Public-record living area 966 square feet; building area 1452 square feet; Zoned R1
Exterior
- Parking: Carport with 2 spaces
- Utilities: Well water; Septic tank; Electricity connected; Water connected; Cable available; Fiber optics available; Broadband/high-speed internet available
- Home design: Single family residence; Residential property; Fixer condition; Faces north; One story; Concrete perimeter foundation
- Construction: Block and concrete construction; Shingle roof; Built on a concrete perimeter foundation
- Exterior features: Storage shed; Kennel/dog run; Chain link fencing; Mature landscaping with trees
Interior
- Kitchen: Microwave; Range; Refrigerator
- Bedrooms: 2 bedrooms
- Flooring: Ceramic tile
- Bathrooms: 1 full bathroom
- Heating & cooling: Central heating; Central air
- Interior features: Ceiling fans; Eat-in kitchen; Living room/dining room combo; Thermostat; Blinds; Wood-burning fireplace
- Laundry & utility: Indoor laundry; Electric water heater
Neighborhood map
What this means for you Summary
Snapshot
- This is a 2-bed/1.0-bath single-family listed at $148k.
Deal economics
- At list price, monthly cash flow is $66 ($787/yr) — positive.
- The deal already cash-flows at list — no discount required.
- To meet the 1% rule (rent ≥ 1% of price), the offer needs to be $133k (10.0% below list).
- Recommended offer: $133k (10.0% below list) — sets the bar for 1% rule.
- Cap rate 7.4% vs local median 4.2% in Ocala — top-decile yield for the area; either an underpriced asset or a hidden risk that comps aren't pricing in. Stress-test before assuming the spread holds.
Location & tenants
- Location reads 69/100 on livability (#476 in FL) — a middle-class / working-renter tenant base. Strengths: cost of living A+, housing A+, health & safety A+; Watch: crime F, amenities F, commute F.
- Marion (rural): math 42% / reading 43% proficiency, ranked #61 of 73 in FL (top 84%) — families likely to look elsewhere, expect single-tenant / working-renter base with shorter leases; 61% free/reduced lunch — lower-income household profile, screen leases tightly.
- Market conditions: 173 active listings in the ZIP; 9 comparable units currently listed for rent nearby; rentals at typical pace (median 21d on market — plan ~3-4 weeks tenant-placement turnaround); 7,071 units permitted in Marion County in 2024 (534 in 5+ unit buildings).
Forward outlook
- Local home prices are declining (-3.0%/yr); year-one equity from $1k of loan paydown is wiped out by about $4k of value loss. Plan a longer hold.
- Marion County population projected at +13% by 2050 — modest demand growth; plan on rents tracking national, not racing it.
Negotiation context
- It's been on market 34 days — a 3% lower offer ($144k) is reasonable based on typical stale-listing flexibility.
- 3 sale attempts; this cycle's ask has dropped $12k (8%) from the opening price — seller is motivated, your offer sets the floor, not the list.
- Current owner paid $83k; list at $148k implies a 78% gain — meaningful room to come down on a strong offer.
Risks & watch-outs
- Watch-outs: flood insurance adds $66/mo.
- Climate carrying-cost: severe flood risk; severe wind risk, 99% chance of damaging wind over 30y; extreme-heat days projected 7→21/yr by 2055 (HVAC capex compounding) — expect insurance premiums to compound above CPI over the hold.
Questions for the listing agent
- It's been on market 34 days. Have you received any prior offers? Is the seller open to a 10% concession, seller financing, or rate buy-down credit?
- Built in 1976 — when were the roof, HVAC, electrical panel, plumbing, and water heater last replaced?
- What's the actual annual flood-insurance premium (NFIP or private), and is the property in a SFHA with mandatory coverage?
- Is there a deadline driving the sale (1031 exchange, divorce, estate, relocation)? That informs how much negotiation room exists.
- Crime grade is F in this area — have there been break-ins, vandalism, or insurance claims at this property in the last 3 years? What carrier currently insures it and at what premium?
- What's the average days-on-market for RENTAL listings here right now (not sales)? A rising rental-DOM trend means longer vacancies and softer asking-rent achievability than the comps imply.
- What's the recent tenant-quality profile in this submarket — average credit score on applications, eviction rate, late-payment / NSF rate, and stable-employment percentage? A property-management company in the area should have these aggregated.
- How much new for-sale + rental construction is in the pipeline within 1–3 miles? Heavy new supply typically softens prices + rents 12–24 months out; constrained supply supports both.
Investment metrics
- 1% rule
- 0.90% ✗
- Cap rate
- 7.36%
- Cash-on-cash
- 3.82%
- DSCR
- 1.17
- GRM
- 9.3
CMA / ARV
- ARV (median comp)
- $187,467
- List price
- $148,000
- Delta
- -21.05%
- Verdict
- UNDERPRICED
- Comps
- 20 within 1.0 mi
Show comp detail 5 sales within ~0.75 mi
| Address | Dist | Beds/Ba | Sqft | Sold | Price | $/sf | Match |
|---|---|---|---|---|---|---|---|
| 3216 NE 22nd Ct | 0.69mi | 3/2.0 (+1) | 988 (+2%) | 3mo | $182,000 | $184 | 52 |
| 1421 NE 24th St | 0.52mi | 3/1.0 (+1) | 995 (+3%) | 22mo | $225,000 | $226 | 47 |
| 2346 NE 19th Ave | 0.69mi | 3/2.0 (+1) | 966 (0%) | 22mo | $192,500 | $199 | 41 |
| 2505 NE 13th Ave | 0.48mi | 3/1.0 (+1) | 1,095 (+13%) | 13mo | $72,600 | $66 | 40 |
| 2338 NE 13th Ave | 0.63mi | 2/1.0 | 842 (-13%) | 15mo | $170,000 | $202 | 37 |
Match score weights: distance 35% · size 25% · config 20% · recency 20%. Top-matched comps best support the ARV.
Projected returns pro-forma
-3.0% appreciation · 3.0% rent growth · sell at horizon
- IRR
- -13.3%
- Equity multiple
- 0.52×
- Total profit
- $-19,810
- Equity at exit
- $22,067
- IRR
- -4.3%
- Equity multiple
- 0.71×
- Total profit
- $-11,882
- Equity at exit
- $12,796
Cash invested: $41,440 (down + closing). Projections, not guarantees.
Landlord ↔ Tenant lean methodology
- Overall (STATE)
- 87 Strongly Landlord-Friendly
- State Florida
- 87 Strongly Landlord-Friendly · R+3
- County
- — inherits STATE
- City
- — inherits STATE
ZIP-level market 34479
- Home prices YoY
- -31.0%
- Active inventory
- 173
- Price-to-rent
- 9.3×
Monthly cashflow live
- Estimated rent
- $1,332 high interval (Pro) →
- Mortgage (P&I)
- −$776
- Tax from tax record
- −$83 /mo · $993/yr
- Insurance
- −$62
- Flood insurance flood zone
- −$66 /mo · $798/yr
- HOA
- −$0
- Vacancy / Maint / Mgmt
- −$280
- Net cashflow
- $66
Break-even live
UW: 25.0% down · 7.5% · 30yr · 1.5% tax · 5.0% vac · 8.0% maint · 8.0% mgmt
Financing live
Cash to close
- Down payment
- $37,000
- Closing costs
- $4,440
- Reserves months
- —
- Total cash needed
- —
Loan-product check · same deal, 3 products live
Conventional
25% down · 7.5% · 30yr
- Down + closing
- —
- Monthly P&I
- —
- Monthly cashflow
- —
- DSCR
- —
- Eligible?
- —
Personal DTI + credit; lowest rate.
DSCR
20% down · 8.5% · 30yr
- Down + closing
- —
- Monthly P&I
- —
- Monthly cashflow
- —
- DSCR
- —
- Eligible?
- —
No personal income docs; deal must DSCR.
Hard money
10% down · 12.0% · 12mo
- Down + closing
- —
- Monthly P&I
- —
- Monthly cashflow
- —
- DSCR
- —
- Eligible?
- —
Short-term bridge; refi at stabilization.
Rent comps 9 comps
| Address | Beds | Baths | Sqft | Rent | $/sqft | DOM | Units | Dist |
|---|---|---|---|---|---|---|---|---|
| NE 8th Ter Ocala, FL | 2.0 | 2.0 | 840 | $1,150 | $1.37 | 13d | 2 | 0.54mi |
| 2836 NE 8th Ter Unit 2836 Ocala, FL | 2.0 | 2.0 | 840 | $1,150 | $1.37 | 21d | 1 | 0.56mi |
| 2818 NE 8th Ter Unit 2818 Ocala, FL | 2.0 | 2.0 | 840 | $1,150 | $1.37 | 21d | 1 | 0.56mi |
| 2205 NE 14th Ave Ocala, FL | 3.0 | 1.0 | 1020 | $1,345 | $1.32 | 21d | 1 | 0.72mi |
| 712 NE 26th St Ocala, FL | 3.0 | 2.0 | 1105 | $1,590 | $1.44 | 21d | 1 | 0.74mi |
| 708 NE 26th St Ocala, FL | 3.0 | 2.0 | 1100 | $1,600 | $1.45 | 21d | 1 | 0.76mi |
| 506 NE 28th St Unit C Ocala, FL | 1.0 | 1.0 | 525 | $1,050 | $2.00 | 21d | 1 | 0.85mi |
| 101 NW 23rd Pl Ocala, FL | 2.0 | 1.0 | 716 | $1,150 | $1.61 | 13d | 1 | 1.18mi |
| Clockwork Ocala, FL | 1.0 | 1.0 | 525 | $995 | $1.90 | 13d | 1 | 1.26mi |
Listing history 26 events
-
2026-06-18days on market $148,000 Active 34 DOM
-
2026-06-17price $148,000 Active 33 DOM
-
2026-06-17days on market $155,000 Active 33 DOM
-
2026-06-16days on market $155,000 Active 32 DOM
-
2026-06-15days on market $155,000 Active 31 DOM
-
2026-06-14days on market $155,000 Active 29 DOM
-
2026-06-13days on market $155,000 Active 28 DOM
-
2026-06-10days on market $155,000 Active 26 DOM
-
2026-06-09days on market $155,000 Active 25 DOM
-
2026-06-08days on market $155,000 Active 24 DOM
-
2026-06-07days on market $155,000 Active 23 DOM
-
2026-06-03days on market $155,000 Active 19 DOM
-
2026-06-02pricedays on market $155,000 Active 18 DOM
-
2026-06-01days on market $160,000 Active 17 DOM
-
2026-05-31days on market $160,000 Active 16 DOM
-
2026-05-30days on market $160,000 Active 15 DOM
-
2026-05-15$160,000 Active 480-char remark
-
2025-06-19historical
-
2025-06-02price $138,000
-
2025-04-18status Active
-
2025-04-09status Pending
-
2025-03-25price $150,000
-
2025-01-23$160,000 Active
-
2018-12-19soldstatus $83,000
-
1979-03-01soldstatus $28,800
-
1976-09-01soldstatus $14,000
ⓘ Source: listings_history table (triggers on properties + properties_extension) + one-shot
backfill from property_details.listing_events for pre-trigger history.
Tax reassessment forecast FL · Resets to sale price
- Current annual tax
- $993 · $83/mo
- Projected year-2 tax
- $1,228 · $102/mo
- Expected delta
- +$235/yr (+$20/mo · 23.7%)
ⓘ Screening estimate from a state-policy table — verify with the county assessor before closing.
Climate risk First Street
- Flood 9/10 Extreme FEMA zone X (unshaded) · 99% chance over 30 yrs
- Wildfire 4/10 Moderate
- Heat 8/10 Severe 7 d/yr ≥108°F today · 21 d/yr by 30 yrs out
- Wind 9/10 Extreme 99% chance of damaging wind over 30 yrs
- Air quality 4/10 Moderate 5 unhealthy d/yr today · 5 by 30 yrs out
Nearby sold comps map
Loading sold comps map…
Walkable amenities ~0.75 mi
Loading nearby amenities…
Taxation est. · year 1
- Rental income
- $15,988
- − Mortgage interest
- −$8,290
- − Property taxes
- −$993
- − Insurance
- −$1,538
- − Repairs & maintenance
- −$1,279
- − Management
- −$1,279
- − Depreciation
- −$4,305
- Taxable loss
- −$1,696
- Est. tax savings @ 24.0%
- +$407
- After-tax cash flow
- $1,194/yr
For passive investors: Depreciation is non-cash, so a rental often shows a tax loss while cash-flowing — sheltering income. Rental losses are passive: they offset passive income freely, and up to $25,000/yr can offset ordinary (W-2) income if you actively participate and your MAGI is under $100k (phasing out to $0 by $150k); unused losses carry forward. On sale, claimed depreciation is recaptured at up to 25%, and gains may owe capital-gains tax (a 1031 exchange can defer both). Figures are a year-1 estimate at your 24.0% rate — not tax advice; consult a CPA.
Schools (NCES district)
- District
- Marion
- NCES district ID
- 1201260
- Math proficiency
- 42% ▼ -7.00%
- Reading proficiency
- 43% ▼ -4.00%
- Median HH income
- $40,015
- Composite
- 35.61/100
- National rank
- #4890
- State rank
- #61 of 73 in FL
Livability — Ocala
- Score
- 69/100
- State rank
- #476
- US rank
- #8461
Category grades
Schools grade is shown separately in the Schools card above.
Census & demographics
- County
- Marion County · 315,796 people
- City population
- 263,375
- Metro
- Ocala, FL
- Population (ZIP)
- 13,264
- Household income
- $54,283
- Rent vs Own
- Severe rent burden
- 664.0
Population outlook (Marion County) Hauer SSP2
- Today (2025)
- 365,905 people
- By 2030
- 376,768 · +3.0%
- By 2040
- 396,555 · +8.4%
- By 2050
- 412,723 · +12.8%
- By 2075
- 446,090 · +21.9%
- By 2100
- 436,193 · +19.2%
Race, ethnicity, and origin ACS 2023
- Neighborhood character
- Predominantly White (66%)
- Race & ethnicity
- White 66% Hispanic / Latino 15% Black 14% Two or more races 9%
- Hispanic origin (detail)
- Mexican 5% Puerto Rican 6% Cuban 2%
- Common ancestry
- Lithuanian 2% Italian 2% Estonian 1%
- Foreign-born
- 5% · Canada, Jamaica
- Languages at home
- 87% English-only · Spanish 11% Other Indo-European 1%
Political lean MEDSL · Marion
- 2024 margin
- Solid R (+31.6) · D 33.8% · R 65.5%
- 2008→2024 swing
- -20.0pp toward R · 2008: -11.6pp · 2024: -31.6pp
- All cycles
- 2024: R+31.6 2020: R+25.9 2016: R+26.2 2012: R+16.2 2008: R+11.6
Not yet ingested
- Civics
- —
Market trends
- HPI YoY
- ▼ -111.70%
- Current HPI
- 248.7063
- Rent YoY
- —
- Metro
- Ocala, FL
- State GDP YoY
- ▲ 3.28%
- F500 in state
- 36
Industry mix (Fortune 500 HQ in FL)
| Industry | F500 HQs | Revenue |
|---|---|---|
| Industrial Technology | 2 | $29B |
|
||
| Insurance | 2 | $17B |
|
||
| Retail | 1 | $60B |
|
||
| Technology Distribution | 1 | $58B |
|
||
| Homebuilding | 1 | $35B |
|
||
| Technology Manufacturing | 1 | $35B |
|
||
Price history
+957.1% since first listed12 events — show timeline
- 2026-06-17 Price Changed $148,000 Stellar MLS as Distributed by MLS Grid
- 2026-06-02 Price Changed $155,000 Stellar MLS as Distributed by MLS Grid
- 2026-05-15 Listed $160,000 Stellar MLS as Distributed by MLS Grid
- 2025-06-19 Listing Removed — Stellar MLS as Distributed by MLS Grid
- 2025-06-02 Price Changed $138,000 Stellar MLS as Distributed by MLS Grid
- 2025-04-18 Relisted — Stellar MLS as Distributed by MLS Grid
- 2025-04-09 Pending — Stellar MLS as Distributed by MLS Grid
- 2025-03-25 Price Changed $150,000 Stellar MLS as Distributed by MLS Grid
- 2025-01-23 Listed $160,000 Stellar MLS as Distributed by MLS Grid
- 2018-12-19 Sold (Public Records) $83,000 Public Records
- 1979-03-01 Sold (Public Records) $28,800 Public Records
- 1976-09-01 Sold (Public Records) $14,000 Public Records
Property tax history
+7.6%/yrLatest (2025): $993 · +27.9% YoY. Source: county tax records.
Cash-flow waterfall
monthlySold comps — $/sqft
last 12 mo · ≤1 miLoading sold comps…