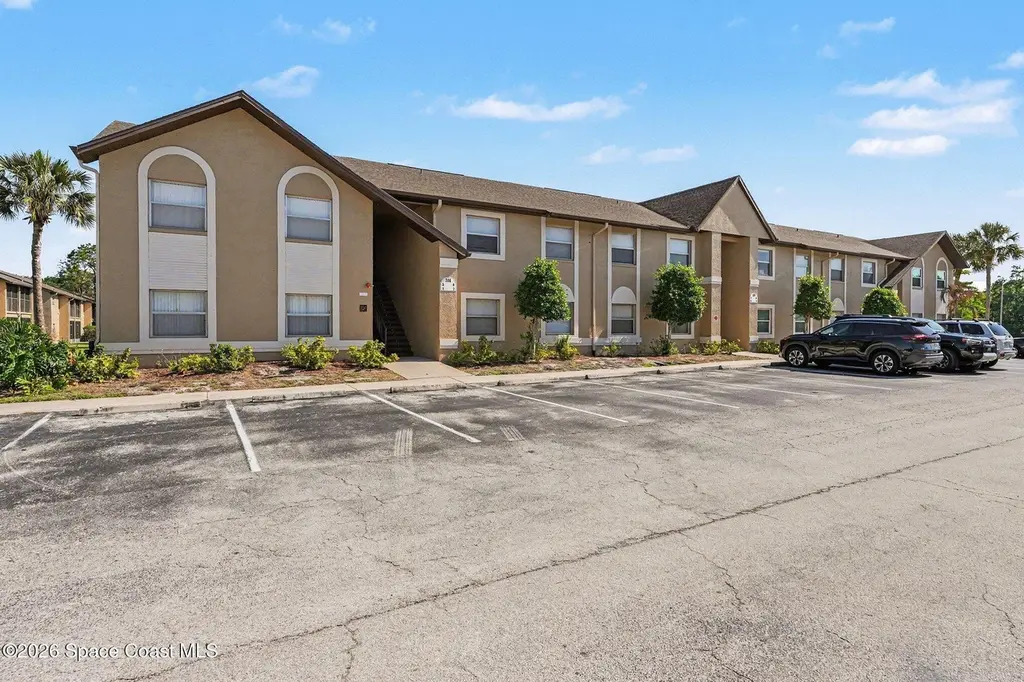
240 Spring Dr #2 · Merritt Island, FL
Flood risk 5/10 · Moderate
- FEMA flood zone
- X (unshaded)
- Chance of flooding over 30 yrs
- 0.44%
- Est. flood insurance / yr
- $507 – $1,088
Fire risk 3/10 · Minor
- Est. fire insurance / yr
- $947 – $1,759
Heat risk 10/10 · Severe
- Hot days now (above 105°F)
- 7 days/yr
- Hot days in 30 yrs
- 23 days/yr
Wind risk 10/10 · Severe
- Chance of severe wind over 30 yrs
- 99.0%
Air-quality risk 1/10 · Minimal
- Unhealthy air days now
- 0 days/yr
- Unhealthy air days in 30 yrs
- 0 days/yr
Risk factors via First Street. Map © Google.
Why this score? — see what drove the C grade
The composite is a weighted blend of 9 inputs, each scored 0–100. Each bar is that input's sub-score; the figure is the points it added to the 100-point composite (weight × sub-score).
- Cash flow +21.5/30.0
- ARV discount +7.5/15.0
- 1% rule +7.2/10.0
- DSCR +6.9/10.0
- Schools +4.7/10.0
- Livability +3.5/5.0
- Rent growth +3.0/5.0
- Condition / age +2.5/5.0
- Appreciation +0.0/10.0
$179,000
🖨 Deal sheet 📄 Offer letter ✓ Due diligence
Listing remarks
🌴 Just Listed in Merritt Island! 🌴 Welcome to 240 Spring Dr -- a beautifully updated 2-bedroom, 2 bath first-floor condo offering comfort, style, and a peaceful pond view right outside your back door. Step inside to find luxury vinyl flooring throughout and a fully renovated kitchen featuring brand-new cabinetry, sleek countertops, and all new stainless-steel appliances--perfect for both everyday living and entertaining. Enjoy the convenience of first-floor access, no stairs, and a layout that flows effortlessly from kitchen to living space. Relax with your morning coffee or unwind in the evening while taking in the tranquil water views. 📍 Prime location puts you just minutes from: •
Key facts
- $265 HOA
- Built 1988
- Listed 46 days
Neighborhood map
What this means for you Summary
Snapshot
- This is a 2-bed/2.0-bath condo listed at $179k.
Deal economics
- At list price, monthly cash flow is $270 ($3k/yr) — positive.
- The deal already cash-flows at list — no discount required.
- Meets the 1% rule at list price ($2k rent vs $179k).
- Recommended offer: $174k (3.0% below list) — sets the bar for market timing.
Location & tenants
- Location reads 70/100 on livability (#441 in FL) — a middle-class / working-renter tenant base. Strengths: crime A+, housing A+, employment A-; Watch: amenities F, commute F, health & safety D-.
- Brevard (suburban): math 53% / reading 57% proficiency, ranked #19 of 73 in FL (top 26%) — acceptable for families but not a draw, mixed tenant base, ~2y average lease.
- Market conditions: Rents rising (+2.1%/yr); 219 active listings in the ZIP; 11 comparable units currently listed for rent nearby; rentals at typical pace (median 23d on market — plan ~3-4 weeks tenant-placement turnaround); solid renter incomes; 4,602 units permitted in Brevard County in 2024 (702 in 5+ unit buildings).
- This rent runs 30% of the median local income ($87k/yr) — at the standard rent-burdened threshold; future hikes will face affordability resistance.
Forward outlook
- Local home prices are declining (-3.0%/yr); year-one equity from $1k of loan paydown is wiped out by about $5k of value loss. Plan a longer hold.
- Brevard County population projected at +15% by 2050 — modest demand growth; plan on rents tracking national, not racing it.
Negotiation context
- It's been on market 47 days — a 3% lower offer ($174k) is reasonable based on typical stale-listing flexibility.
Risks & watch-outs
- Climate carrying-cost: moderate flood risk; severe wind risk, 99% chance of damaging wind over 30y; extreme-heat days projected 7→23/yr by 2055 (HVAC capex compounding) — expect insurance premiums to compound above CPI over the hold.
Questions for the listing agent
- It's been on market 47 days. Have you received any prior offers? Is the seller open to a 3% concession, seller financing, or rate buy-down credit?
- What does the HOA fee cover, when was the last increase, and are there any pending special assessments or reserve-fund shortfalls?
- Any open or pending special assessments — roof, HVAC, plumbing, elevator, façade? What's the per-unit balance and payoff schedule, and is the seller paying it off at close or rolling it to the buyer?
- Is there a deadline driving the sale (1031 exchange, divorce, estate, relocation)? That informs how much negotiation room exists.
- Schools are B-rated — typically a magnet for longer-tenancy family renters. What's the average tenant stay here, and is there a school-zone premium baked into asking?
- What's the average days-on-market for RENTAL listings here right now (not sales)? A rising rental-DOM trend means longer vacancies and softer asking-rent achievability than the comps imply.
- What's the recent tenant-quality profile in this submarket — average credit score on applications, eviction rate, late-payment / NSF rate, and stable-employment percentage? A property-management company in the area should have these aggregated.
- How much new apartment / multifamily construction is in the pipeline within 1–3 miles? Heavy new supply (>2% of stock underway) typically softens rents 12–24 months out; light construction supports rent growth.
Investment metrics
- 1% rule
- 1.22% ✓
- Cap rate
- 8.10%
- Cash-on-cash
- 6.47%
- DSCR
- 1.29
- GRM
- 6.8
CMA / ARV
No comps found within radius.
Projected returns pro-forma
-3.0% appreciation · 2.12% rent growth · sell at horizon
- IRR
- -7.4%
- Equity multiple
- 0.73×
- Total profit
- $-13,547
- Equity at exit
- $26,689
- IRR
- 1.0%
- Equity multiple
- 1.07×
- Total profit
- $3,314
- Equity at exit
- $15,477
Cash invested: $50,120 (down + closing). Projections, not guarantees.
Landlord ↔ Tenant lean methodology
- Overall (STATE)
- 87 Strongly Landlord-Friendly
- State Florida
- 87 Strongly Landlord-Friendly · R+3
- County
- — inherits STATE
- City
- — inherits STATE
ZIP-level market 32953
- Home prices YoY
- -34.5%
- Rents YoY
- 2.1%
- Active inventory
- 219
- Price-to-rent
- 6.8×
Monthly cashflow live
- Estimated rent
- $2,182 high interval (Pro) →
- Mortgage (P&I)
- −$939
- Tax from tax record
- −$175 /mo · $2,102/yr
- Insurance
- −$75
- HOA
- −$265
- Vacancy / Maint / Mgmt
- −$458
- Net cashflow
- $270
Break-even live
UW: 25.0% down · 7.5% · 30yr · 1.5% tax · 5.0% vac · 8.0% maint · 8.0% mgmt
Financing live
Cash to close
- Down payment
- $44,750
- Closing costs
- $5,370
- Reserves months
- —
- Total cash needed
- —
Loan-product check · same deal, 3 products live
Conventional
25% down · 7.5% · 30yr
- Down + closing
- —
- Monthly P&I
- —
- Monthly cashflow
- —
- DSCR
- —
- Eligible?
- —
Personal DTI + credit; lowest rate.
DSCR
20% down · 8.5% · 30yr
- Down + closing
- —
- Monthly P&I
- —
- Monthly cashflow
- —
- DSCR
- —
- Eligible?
- —
No personal income docs; deal must DSCR.
Hard money
10% down · 12.0% · 12mo
- Down + closing
- —
- Monthly P&I
- —
- Monthly cashflow
- —
- DSCR
- —
- Eligible?
- —
Short-term bridge; refi at stabilization.
Rent comps 11 comps
| Address | Beds | Baths | Sqft | Rent | $/sqft | DOM | Units | Dist |
|---|---|---|---|---|---|---|---|---|
| 100 Summer Pl #8 Merritt Island, FL | 2.0 | 2.0 | 1037 | $2,500 | $2.41 | 23d | 1 | 0.14mi |
| 437 Via Palermo Ct Merritt Island, FL | 3.0 | 2.0 | 1375 | $2,175 | $1.58 | 23d | 1 | 0.32mi |
| 2610 Via Napoli Ct Merritt Island, FL | 3.0 | 2.0 | 1123 | $2,400 | $2.14 | 14d | 1 | 0.36mi |
| 104 Parrotfish Ln #101 Merritt Island, FL | 3.0 | 2.5 | 1487 | $2,750 | $1.85 | 23d | 1 | 0.47mi |
| 650 Parkside Ave Merritt Island, FL | 2.0 | 2.0 | 1390 | $1,950 | $1.40 | 23d | 1 | 0.52mi |
| 3077 Sea Gate Cir Merritt Island, FL | 2.0 | 2.0 | 1044 | $1,950 | $1.87 | 23d | 1 | 0.74mi |
| 10 Bogart Pl Merritt Island, FL | 3.0 | 2.5 | 1376 | $2,350 | $1.71 | 23d | 1 | 0.94mi |
| 360 Schoolhouse Ln Merritt Island, FL | 3.0 | 2.0 | 953 | $1,500 | $1.57 | 23d | 1 | 0.96mi |
| 48 Bogart Pl Merritt Island, FL | 2.0 | 1.5 | 1184 | $1,800 | $1.52 | 23d | 1 | 0.97mi |
| 43 Bogart Pl Merritt Island, FL | 2.0 | 1.5 | 1172 | $1,875 | $1.60 | 23d | 1 | 0.99mi |
| 1525 Polaris St Merritt Island, FL | 3.0 | 2.0 | 1462 | $2,400 | $1.64 | 14d | 1 | 1.29mi |
HOA detail condo
- Monthly dues
- $265 · $3,180/yr
- Likely covers
- water
- Assessments
- None detected in remarks — confirm with the listing agent.
Listing history 15 events
-
2026-06-18days on market $179,000 Active 47 DOM
-
2026-06-17days on market $179,000 Active 46 DOM
-
2026-06-16days on market $179,000 Active 45 DOM
-
2026-06-15days on market $179,000 Active 44 DOM
-
2026-06-14days on market $179,000 Active 42 DOM
-
2026-06-10days on market $179,000 Active 39 DOM
-
2026-06-08days on market $179,000 Active 37 DOM
-
2026-06-07days on market $179,000 Active 36 DOM
-
2026-06-05days on market $179,000 Active 33 DOM
-
2026-06-03days on market $179,000 Active 32 DOM
-
2026-06-02days on market $179,000 Active 31 DOM
-
2026-06-01days on market $179,000 Active 30 DOM
-
2026-05-31days on market $179,000 Active 29 DOM
-
2026-05-31days on market $179,000 Active 28 DOM
-
2026-05-03$179,000 Active
ⓘ Source: listings_history table (triggers on properties + properties_extension) + one-shot
backfill from property_details.listing_events for pre-trigger history.
Tax reassessment forecast FL · Resets to sale price
- Current annual tax
- $2,102 · $175/mo
- Projected year-2 tax
- $2,102 · $175/mo
- Expected delta
- $0/yr ($0/mo · 0.0%)
ⓘ Screening estimate from a state-policy table — verify with the county assessor before closing.
Climate risk First Street
- Flood 5/10 Major FEMA zone X (unshaded) · 44% chance over 30 yrs
- Wildfire 3/10 Moderate
- Heat 10/10 Extreme 7 d/yr ≥105°F today · 23 d/yr by 30 yrs out
- Wind 10/10 Extreme 99% chance of damaging wind over 30 yrs
- Air quality 1/10 Low 0 unhealthy d/yr today · 0 by 30 yrs out
Nearby sold comps map
Loading sold comps map…
Walkable amenities ~0.75 mi
Loading nearby amenities…
Taxation est. · year 1
- Rental income
- $26,182
- − Mortgage interest
- −$10,027
- − Property taxes
- −$2,102
- − Insurance
- −$895
- − Repairs & maintenance
- −$2,095
- − Management
- −$2,095
- − HOA
- −$3,180
- − Depreciation
- −$5,207
- Taxable income
- $581
- Est. tax owed @ 24.0%
- −$140
- After-tax cash flow
- $3,103/yr
For passive investors: Depreciation is non-cash, so a rental often shows a tax loss while cash-flowing — sheltering income. Rental losses are passive: they offset passive income freely, and up to $25,000/yr can offset ordinary (W-2) income if you actively participate and your MAGI is under $100k (phasing out to $0 by $150k); unused losses carry forward. On sale, claimed depreciation is recaptured at up to 25%, and gains may owe capital-gains tax (a 1031 exchange can defer both). Figures are a year-1 estimate at your 24.0% rate — not tax advice; consult a CPA.
Schools (NCES district)
- District
- Brevard
- NCES district ID
- 1200150
- Math proficiency
- 53% ▼ -9.00%
- Reading proficiency
- 57% ▼ -4.00%
- Median HH income
- $49,426
- Composite
- 46.86/100
- National rank
- #2370
- State rank
- #19 of 73 in FL
Livability — Merritt Island
- Score
- 70/100
- State rank
- #441
- US rank
- #7878
Category grades
Schools grade is shown separately in the Schools card above.
Census & demographics
- Census place
- Merritt Island, FL
- County
- Brevard County · 602,871 people
- City population
- 46,372
- Metro
- Palm Bay-Melbourne-Titusville, FL
- Population (ZIP)
- 24,759
- Household income
- $87,262
- Rent vs Own
- Severe rent burden
- 849.0
Population outlook (Brevard County) Hauer SSP2
- Today (2025)
- 623,254 people
- By 2030
- 648,420 · +4.0%
- By 2040
- 690,009 · +10.7%
- By 2050
- 715,669 · +14.8%
- By 2075
- 775,744 · +24.5%
- By 2100
- 776,687 · +24.6%
Race, ethnicity, and origin ACS 2023
- Neighborhood character
- Predominantly White (77%)
- Race & ethnicity
- White 77% Hispanic / Latino 13% Two or more races 7% Black 4% Asian 3%
- Hispanic origin (detail)
- Mexican 2% Puerto Rican 6%
- Common ancestry
- Slovak 3% Romanian 3% Lithuanian 3%
- Foreign-born
- 9% · Canada, China, Jamaica
- Languages at home
- 87% English-only · Spanish 8% Tagalog/Filipino 2% French/Haitian/Cajun 1%
Political lean MEDSL · Brevard
- 2024 margin
- Strong R (+20.8) · D 39.1% · R 59.9% · Other 1.0%
- 2008→2024 swing
- -10.4pp toward R · 2008: -10.4pp · 2024: -20.8pp
- All cycles
- 2024: R+20.8 2020: R+16.4 2016: R+19.8 2012: R+12.7 2008: R+10.4
Not yet ingested
- Civics
- —
Market trends
- HPI YoY
- ▼ -168.76%
- Current HPI
- 320.1966
- Rent YoY
- ▲ 2.12%
- Metro
- Palm Bay-Melbourne-Titusville, FL
- State GDP YoY
- ▲ 3.28%
- F500 in state
- 36
Industry mix (Fortune 500 HQ in FL)
| Industry | F500 HQs | Revenue |
|---|---|---|
| Industrial Technology | 2 | $29B |
|
||
| Insurance | 2 | $17B |
|
||
| Retail | 1 | $60B |
|
||
| Technology Distribution | 1 | $58B |
|
||
| Homebuilding | 1 | $35B |
|
||
| Technology Manufacturing | 1 | $35B |
|
||
Price history
1 event — show timeline
- 2026-05-03 Listed $179,000 SCMLS
Property tax history
+7.1%/yrLatest (2025): $2,102 · +5.8% YoY. Source: county tax records.
Cash-flow waterfall
monthlySold comps — $/sqft
last 12 mo · ≤1 miLoading sold comps…