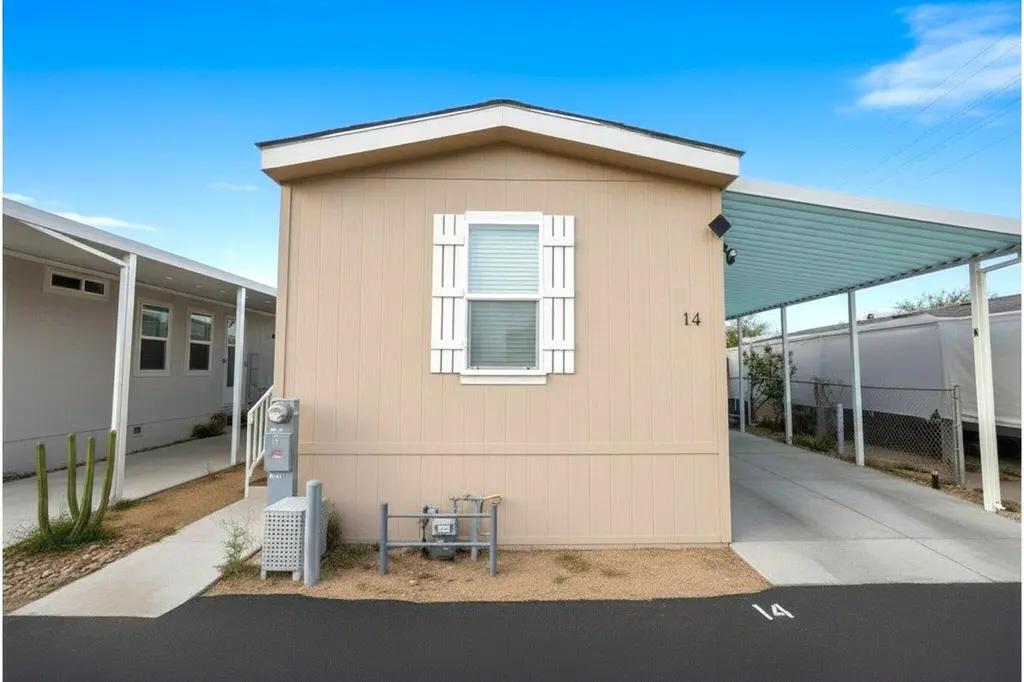
15687 Palm Dr #14 · Desert Hot Springs, CA
Flood risk 1/10 · Minimal
- FEMA flood zone
- AO
- Chance of flooding over 30 yrs
- 0.0%
- Est. flood insurance / yr
- $848 – $2,087
Fire risk 5/10 · Moderate
- Est. fire insurance / yr
- $659 – $1,223
Heat risk 9/10 · Severe
- Hot days now (above 111°F)
- 6 days/yr
- Hot days in 30 yrs
- 17 days/yr
Wind risk 1/10 · Minimal
- Chance of severe wind over 30 yrs
- —
Air-quality risk 5/10 · Moderate
- Unhealthy air days now
- 8 days/yr
- Unhealthy air days in 30 yrs
- 11 days/yr
Risk factors via First Street. Map © Google.
Why this score? — see what drove the B grade
The composite is a weighted blend of 9 inputs, each scored 0–100. Each bar is that input's sub-score; the figure is the points it added to the 100-point composite (weight × sub-score).
- Cash flow +30.0/30.0
- 1% rule +10.0/10.0
- DSCR +10.0/10.0
- ARV discount +7.5/15.0
- Condition / age +4.8/5.0
- Rent growth +3.4/5.0
- Schools +2.7/10.0
- Livability +2.5/5.0
- Appreciation +0.0/10.0
$115,000
🖨 Deal sheet 📄 Offer letter ✓ Due diligence
Listing remarks MLS
Practically brand-new manufactured home! Built in 2023 and installed in 2024, this beautiful home has only been lived in for one year and still feels like new. Move-in ready and includes washer, dryer, refrigerator, and microwave, making it perfect for buyers looking for convenience from day one. The home also features energy-efficient mini-split units to help keep electricity costs low, fresh interior paint, and a clean, low-maintenance backyard space ready to enjoy. Located in a desirable all-age community with an affordable land lease of only $850/month, which includes water, trash, septic, and park security a rare find in today's market. Residents also enjoy access to community amenities, including a dog park, playground, pool, and community center. Prime location just minutes from shopping, dining, and easy freeway access to Gene Autry. Opportunities like this don't come around often--schedule your showing before it's gone! Disclaimer: All information is deemed reliable but not guaranteed. Buyers and their agents are advised to independently verify all information, including square footage, lot details, community rules, and lease terms. Buyers must apply to park
Key facts
- Dog park
- Community center
- Pool
Tags
Neighborhood map
What this means for you Summary
Snapshot
- This is a 2-bed/1.0-bath manufactured listed at $115k. Condition is rated excellent.
Deal economics
- At list price, monthly cash flow is $548 ($7k/yr) — positive.
- The deal already cash-flows at list — no discount required.
- Meets the 1% rule at list price ($2k rent vs $115k).
- Recommended offer: $105k (9.0% below list) — sets the bar for market timing.
- Cap rate 13.3% vs local median 4.0% in Desert Hot Springs — top-decile yield for the area; either an underpriced asset or a hidden risk that comps aren't pricing in. Stress-test before assuming the spread holds.
Location & tenants
- Location reads 49/100 on livability (#1,149 in CA) — a working-class tenant base; expect higher turnover. Strengths: housing B+; Watch: crime D+, schools F, amenities F.
- Palm Springs Unified (suburban): math 21% / reading 42% proficiency, ranked #328 of 517 in CA (top 63%) — families likely to look elsewhere, expect single-tenant / working-renter base with shorter leases; 73% free/reduced lunch — lower-income household profile, screen leases tightly.
- Market conditions: Rents rising (+3.7%/yr); 515 active listings in the ZIP; 1 comparable units currently listed for rent nearby; 9,195 units permitted in Riverside County in 2024 (1,512 in 5+ unit buildings).
- This rent runs 39% of the median local income ($54k/yr) — at the standard rent-burdened threshold; future hikes will face affordability resistance.
Forward outlook
- Local home prices are declining (-3.0%/yr); year-one equity from $795 of loan paydown is wiped out by about $3k of value loss. Plan a longer hold.
- Riverside County population projected at +22% by 2050 — long-run rental-demand tailwind backs the buy-and-hold thesis.
- At projected returns (-3.0% appreciation + 3.7% rent growth), your $32k cash investment doubles in ~6 years — after that, you're playing with house money.
Negotiation context
- It's been on market 99 days — a 9% lower offer ($105k) is reasonable based on typical stale-listing flexibility.
Risks & watch-outs
- Watch-outs: flood insurance adds $122/mo.
- Climate carrying-cost: in FEMA flood zone AO (mandatory federal flood insurance); moderate wildfire risk; extreme-heat days projected 6→17/yr by 2055 (HVAC capex compounding) — expect insurance premiums to compound above CPI over the hold.
Questions for the listing agent
- It's been on market 99 days. Have you received any prior offers? Is the seller open to a 9% concession, seller financing, or rate buy-down credit?
- What's the actual annual flood-insurance premium (NFIP or private), and is the property in a SFHA with mandatory coverage?
- Why hasn't it sold? Are there any deal-killer items the seller is aware of (foundation, flood, title, zoning, code violations)?
- Is there a deadline driving the sale (1031 exchange, divorce, estate, relocation)? That informs how much negotiation room exists.
- Schools are F-rated, which usually means shorter tenancies and higher turnover. Who's the typical renter profile here, and what's been the actual vacancy rate?
- Crime grade is D in this area — have there been break-ins, vandalism, or insurance claims at this property in the last 3 years? What carrier currently insures it and at what premium?
- What's the average days-on-market for RENTAL listings here right now (not sales)? A rising rental-DOM trend means longer vacancies and softer asking-rent achievability than the comps imply.
- What's the recent tenant-quality profile in this submarket — average credit score on applications, eviction rate, late-payment / NSF rate, and stable-employment percentage? A property-management company in the area should have these aggregated.
- How much new for-sale + rental construction is in the pipeline within 1–3 miles? Heavy new supply typically softens prices + rents 12–24 months out; constrained supply supports both.
Investment metrics
- 1% rule
- 1.53% ✓
- Cap rate
- 13.29%
- Cash-on-cash
- 24.98%
- DSCR
- 2.11
- GRM
- 5.4
CMA / ARV
- ARV (median comp)
- $49,340
- List price
- $115,000
- Delta
- 133.08%
- Verdict
- OVERPRICED
- Comps
- 6 within 2.0 mi
Show comp detail 2 sales within ~0.75 mi
| Address | Dist | Beds/Ba | Sqft | Sold | Price | $/sf | Match |
|---|---|---|---|---|---|---|---|
| 15685 Palm Dr #17 | 0.08mi | 2/1.0 | 697 (-1%) | 23mo | $82,000 | $118 | 76 |
| 15685 Palm Drive #25 | 0.08mi | 2/1.0 | 720 (+3%) | 20mo | $89,000 | $124 | 75 |
Match score weights: distance 35% · size 25% · config 20% · recency 20%. Top-matched comps best support the ARV.
Projected returns pro-forma
-3.0% appreciation · 3.66% rent growth · sell at horizon
- IRR
- 13.5%
- Equity multiple
- 1.54×
- Total profit
- $17,502
- Equity at exit
- $17,147
- IRR
- 22.9%
- Equity multiple
- 3.03×
- Total profit
- $65,308
- Equity at exit
- $9,943
Cash invested: $32,200 (down + closing). Projections, not guarantees.
Landlord ↔ Tenant lean methodology
- Overall (STATE)
- 18 Strongly Tenant-Friendly
- State California
- 18 Strongly Tenant-Friendly · D+13
- County
- — inherits STATE
- City
- — inherits STATE
ZIP-level market 92240
- Home prices YoY
- -19.6%
- Rents YoY
- 3.7%
- Active inventory
- 515
- Price-to-rent
- 5.4×
Monthly cashflow live
- Estimated rent
- $1,761 medium interval (Pro) →
- Mortgage (P&I)
- −$603
- Tax from tax record
- −$70 /mo · $836/yr
- Insurance
- −$48
- Flood insurance flood zone
- −$122 /mo · $1,468/yr
- HOA
- −$0
- Vacancy / Maint / Mgmt
- −$370
- Net cashflow
- $548
Break-even live
UW: 25.0% down · 7.5% · 30yr · 1.5% tax · 5.0% vac · 8.0% maint · 8.0% mgmt
Financing live
Cash to close
- Down payment
- $28,750
- Closing costs
- $3,450
- Reserves months
- —
- Total cash needed
- —
Loan-product check · same deal, 3 products live
Conventional
25% down · 7.5% · 30yr
- Down + closing
- —
- Monthly P&I
- —
- Monthly cashflow
- —
- DSCR
- —
- Eligible?
- —
Personal DTI + credit; lowest rate.
DSCR
20% down · 8.5% · 30yr
- Down + closing
- —
- Monthly P&I
- —
- Monthly cashflow
- —
- DSCR
- —
- Eligible?
- —
No personal income docs; deal must DSCR.
Hard money
10% down · 12.0% · 12mo
- Down + closing
- —
- Monthly P&I
- —
- Monthly cashflow
- —
- DSCR
- —
- Eligible?
- —
Short-term bridge; refi at stabilization.
Rent comps 1 comps
| Address | Beds | Baths | Sqft | Rent | $/sqft | DOM | Units | Dist |
|---|---|---|---|---|---|---|---|---|
| 15160 Via Montana Unit 3 Desert Hot Springs, CA | 1.0 | 1.0 | 500 | $1,600 | $3.20 | 44d | 1 | 0.66mi |
Listing history 16 events
-
2026-06-18days on market $115,000 Active 99 DOM
-
2026-06-17days on market $115,000 Active 98 DOM
-
2026-06-16days on market $115,000 Active 97 DOM
-
2026-06-15days on market $115,000 Active 96 DOM
-
2026-06-13days on market $115,000 Active 94 DOM
-
2026-06-13days on market $115,000 Active 93 DOM
-
2026-06-09days on market $115,000 Active 90 DOM
-
2026-06-08days on market $115,000 Active 89 DOM
-
2026-06-07days on market $115,000 Active 88 DOM
-
2026-06-04days on market $115,000 Active 85 DOM
-
2026-06-03days on market $115,000 Active 84 DOM
-
2026-06-02days on market $115,000 Active 83 DOM
-
2026-06-01days on market $115,000 Active 82 DOM
-
2026-05-31days on market $115,000 Active 81 DOM
-
2026-05-05price $115,000 1185-char remark
Show marketing remark (1185 chars)
Practically brand-new manufactured home! Built in 2023 and installed in 2024, this beautiful home has only been lived in for one year and still feels like new. Move-in ready and includes washer, dryer, refrigerator, and microwave, making it perfect for buyers looking for convenience from day one. The home also features energy-efficient mini-split units to help keep electricity costs low, fresh interior paint, and a clean, low-maintenance backyard space ready to enjoy. Located in a desirable all-age community with an affordable land lease of only $850/month, which includes water, trash, septic, and park security a rare find in today's market. Residents also enjoy access to community amenities, including a dog park, playground, pool, and community center. Prime location just minutes from shopping, dining, and easy freeway access to Gene Autry. Opportunities like this don't come around often--schedule your showing before it's gone! Disclaimer: All information is deemed reliable but not guaranteed. Buyers and their agents are advised to independently verify all information, including square footage, lot details, community rules, and lease terms. Buyers must apply to park
-
2026-03-11$120,000 Active 1185-char remark
Show marketing remark (1185 chars)
Practically brand-new manufactured home! Built in 2023 and installed in 2024, this beautiful home has only been lived in for one year and still feels like new. Move-in ready and includes washer, dryer, refrigerator, and microwave, making it perfect for buyers looking for convenience from day one. The home also features energy-efficient mini-split units to help keep electricity costs low, fresh interior paint, and a clean, low-maintenance backyard space ready to enjoy. Located in a desirable all-age community with an affordable land lease of only $850/month, which includes water, trash, septic, and park security a rare find in today's market. Residents also enjoy access to community amenities, including a dog park, playground, pool, and community center. Prime location just minutes from shopping, dining, and easy freeway access to Gene Autry. Opportunities like this don't come around often--schedule your showing before it's gone! Disclaimer: All information is deemed reliable but not guaranteed. Buyers and their agents are advised to independently verify all information, including square footage, lot details, community rules, and lease terms. Buyers must apply to park
ⓘ Source: listings_history table (triggers on properties + properties_extension) + one-shot
backfill from property_details.listing_events for pre-trigger history.
Tax reassessment forecast CA · Resets to sale price
- Current annual tax
- $836 · $70/mo
- Projected year-2 tax
- $874 · $73/mo
- Expected delta
- +$38/yr (+$3/mo · 4.5%)
ⓘ Screening estimate from a state-policy table — verify with the county assessor before closing.
Climate risk First Street
- Flood 1/10 Low FEMA zone AO · 0% chance over 30 yrs
- Wildfire 5/10 Major
- Heat 9/10 Extreme 6 d/yr ≥111°F today · 17 d/yr by 30 yrs out
- Wind 1/10 Low
- Air quality 5/10 Major 8 unhealthy d/yr today · 11 by 30 yrs out
Nearby sold comps map
Loading sold comps map…
Walkable amenities ~0.75 mi
Loading nearby amenities…
Taxation est. · year 1
- Rental income
- $21,129
- − Mortgage interest
- −$6,442
- − Property taxes
- −$836
- − Insurance
- −$2,042
- − Repairs & maintenance
- −$1,690
- − Management
- −$1,690
- − Depreciation
- −$3,345
- Taxable income
- $5,082
- Est. tax owed @ 24.0%
- −$1,220
- After-tax cash flow
- $5,357/yr
For passive investors: Depreciation is non-cash, so a rental often shows a tax loss while cash-flowing — sheltering income. Rental losses are passive: they offset passive income freely, and up to $25,000/yr can offset ordinary (W-2) income if you actively participate and your MAGI is under $100k (phasing out to $0 by $150k); unused losses carry forward. On sale, claimed depreciation is recaptured at up to 25%, and gains may owe capital-gains tax (a 1031 exchange can defer both). Figures are a year-1 estimate at your 24.0% rate — not tax advice; consult a CPA.
Condition & rehab AI · 12 photos
This nearly new manufactured home is move-in ready with modern appliances, energy-efficient systems, and a clean, low-maintenance exterior. Minor updates could further enhance its curb appeal and market value.
Value-add opportunities
- Both Paint exterior siding — Enhances curb appeal and value
- Both Replace window coverings — Improves energy efficiency and aesthetics
- Both Install smart home devices — Enhances convenience and marketability
Renovation cost estimate screening
Value-add ROI direction
- Both Paint exterior siding — Enhances curb appeal and value ↑
- Both Replace window coverings — Improves energy efficiency and aesthetics ↑
- Both Install smart home devices — Enhances convenience and marketability ↑
ⓘ Cost ranges are severity-bucket heuristics (US national rule-of-thumb). Get contractor quotes + a written scope before underwriting a rehab budget.
Schools (NCES district)
- District
- Palm Springs Unified
- NCES district ID
- 0629550
- Math proficiency
- 21% ▼ -7.00%
- Reading proficiency
- 42% ▬ 0.00%
- Median HH income
- $43,638
- Composite
- 26.76/100
- National rank
- #7131
- State rank
- #328 of 517 in CA
Livability — Desert Hot Springs
- Score
- 49/100
- State rank
- #1149
- US rank
- #25774
Category grades
Schools grade is shown separately in the Schools card above.
Census & demographics
- Census place
- Desert Hot Springs, CA
- County
- Riverside County · 2,287,001 people
- City population
- 41,615
- Metro
- Riverside-San Bernardino-Ontario, CA
- Population (ZIP)
- 41,615
- Household income
- $54,023
- Rent vs Own
- Severe rent burden
- 2095.0
Population outlook (Riverside County) Hauer SSP2
- Today (2025)
- 2,664,475 people
- By 2030
- 2,802,692 · +5.2%
- By 2040
- 3,050,904 · +14.5%
- By 2050
- 3,256,783 · +22.2%
- By 2075
- 3,655,058 · +37.2%
- By 2100
- 3,766,594 · +41.4%
Race, ethnicity, and origin ACS 2023
- Neighborhood character
- Majority Hispanic (64%)
- Race & ethnicity
- Hispanic / Latino 64% Two or more races 27% White 23% Black 7% Native American 2% Asian 2%
- Hispanic origin (detail)
- Mexican 53%
- Common ancestry
- Lithuanian 1% Romanian 1% Italian 1%
- Foreign-born
- 27% · Canada, Vietnam
- Languages at home
- 47% English-only · Spanish 50% Russian/Polish/Slavic 1%
Political lean MEDSL · Riverside
- 2024 margin
- Toss-up / Even · D 48.0% · R 49.3% · Other 2.6%
- 2008→2024 swing
- -3.6pp toward R · 2008: 2.3pp · 2024: -1.3pp
- All cycles
- 2024: R+1.3 2020: D+8.0 2016: D+4.3 2012: R+0.4 2008: D+2.3
Not yet ingested
- Civics
- —
Market trends
- HPI YoY
- ▼ -102.10%
- Current HPI
- 418.4691
- Rent YoY
- ▲ 3.66%
- Metro
- Riverside-San Bernardino-Ontario, CA
- State GDP YoY
- ▲ 3.21%
- F500 in state
- 116
Industry mix (Fortune 500 HQ in CA)
| Industry | F500 HQs | Revenue |
|---|---|---|
| Technology | 27 | $1,492B |
|
||
| Financial Services | 3 | $174B |
|
||
| Retail | 3 | $44B |
|
||
| Insurance | 3 | $26B |
|
||
| Media / Entertainment | 2 | $115B |
|
||
| Pharmaceuticals / Biotech | 2 | $62B |
|
||
Price history
-4.2% since first listed2 events — show timeline
- 2026-05-05 Price Changed $115,000 GPSMLS
- 2026-03-11 Listed $120,000 GPSMLS
Property tax history
+2.8%/yrLatest (2025): $836 · +2.8% YoY. Source: county tax records.
Cash-flow waterfall
monthlySold comps — $/sqft
last 12 mo · ≤1 miLoading sold comps…