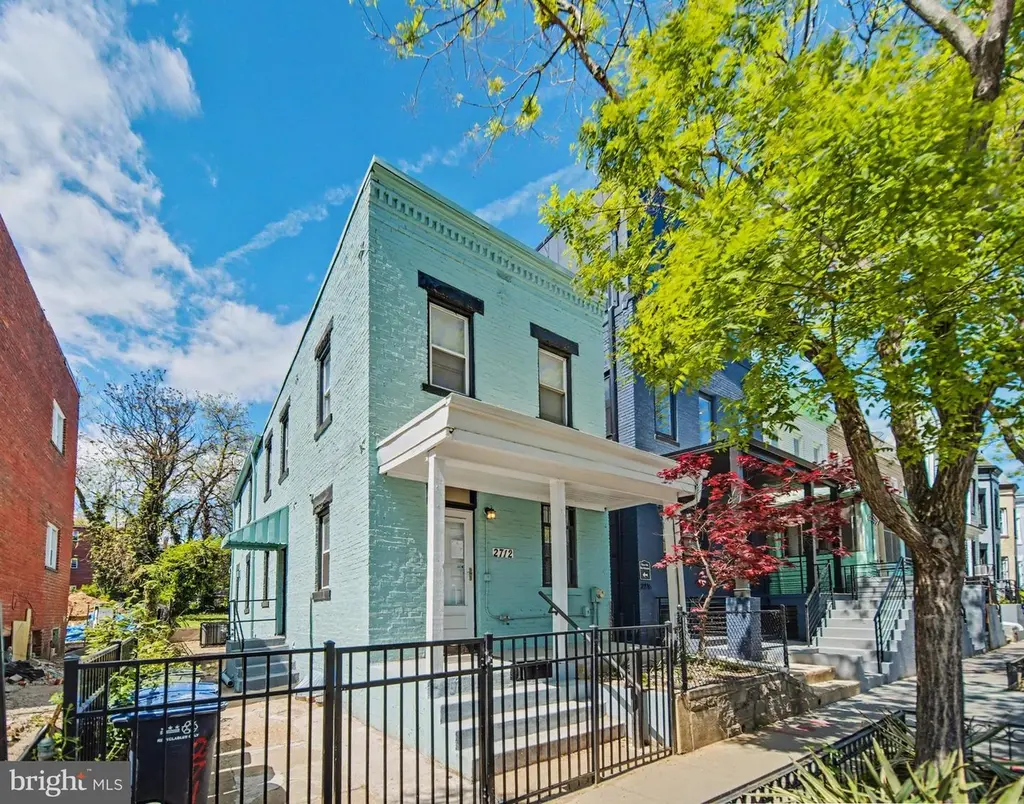
2712 Sherman Ave NW · Washington, DC
Flood risk 8/10 · Major
- FEMA flood zone
- X (unshaded)
- Chance of flooding over 30 yrs
- 0.99%
- Est. flood insurance / yr
- $473 – $860
Fire risk 1/10 · Minimal
- Est. fire insurance / yr
- $631 – $1,173
Heat risk 7/10 · Major
- Hot days now (above 105°F)
- 7 days/yr
- Hot days in 30 yrs
- 15 days/yr
Wind risk 4/10 · Minor
- Chance of severe wind over 30 yrs
- 15.0%
Air-quality risk 4/10 · Minor
- Unhealthy air days now
- 4 days/yr
- Unhealthy air days in 30 yrs
- 5 days/yr
Risk factors via First Street. Map © Google.
Why this score? — see what drove the B- grade
The composite is a weighted blend of 9 inputs, each scored 0–100. Each bar is that input's sub-score; the figure is the points it added to the 100-point composite (weight × sub-score).
- Cash flow +30.0/30.0
- 1% rule +10.0/10.0
- DSCR +10.0/10.0
- ARV discount +7.5/15.0
- Livability +3.7/5.0
- Schools +3.6/10.0
- Condition / age +2.5/5.0
- Rent growth +2.3/5.0
- Appreciation +0.0/10.0
$199,999
🖨 Deal sheet (PDF) 📄 Offer letter ✓ Due diligence
Listing remarks MLS
Potential for possible condo conversion- sold in "as is" condition- could also become a fine renovated single family residence.
Key facts
- 3,000 sq ft lot
- Built 1905
- Listed 42 days
Property features AI
Finance
- Other: Fee simple ownership
Exterior
- Parking: On-street parking
- Utilities: Public water; Public sewer
- Home design: Detached structure; Brick construction
- Construction: Brick construction materials; Other foundation details; Other above- and below-grade structures; Finished above-grade area reported by assessor; Unfinished below-grade area reported by assessor
- Exterior features: No tidal water
Interior
- Bedrooms: Four bedrooms on the first upper level; One bedroom on the main level
- Bathrooms: Three full bathrooms overall; Two full bathrooms on the first upper level; One full bathroom on the main level; One half bathroom on the main level
- Heating & cooling: Hot water heating; Other heating fuel; Other cooling fuel; Other hot water source
- Interior features: Finished above-grade living area per assessor; Basement present (other type)
Neighborhood map
What this means for you Summary
Snapshot
- This is a 4-bed/1.5-bath single-family listed at $200k.
Deal economics
- At list price, monthly cash flow is $2k ($23k/yr) — positive.
- The deal already cash-flows at list — no discount required.
- Meets the 1% rule at list price ($5k rent vs $200k).
- Recommended offer: $194k (3.0% below list) — sets the bar for market timing.
- Cap rate 18.0% vs local median 2.5% in Washington — top-decile yield for the area; either an underpriced asset or a hidden risk that comps aren't pricing in. Stress-test before assuming the spread holds.
Location & tenants
- Location reads 73/100 on livability (#1 in DC) — a middle-class / working-renter tenant base. Strengths: amenities A+, commute A+, employment A+; Watch: crime F, cost of living F.
- District Of Columbia Public Schools (urban): math 33% / reading 40% proficiency, ranked #8 of 32 in DC (top 25%) — families likely to look elsewhere, expect single-tenant / working-renter base with shorter leases; 65% free/reduced lunch — lower-income household profile, screen leases tightly.
- Zoned schools: Tubman Es (540 students, 0% FRL); Luke C. Moore Hs (211 students, 0% FRL) — zoned schools average 0% FRL vs 65% district-wide (65 pts lower); this property's tenant base skews higher-income than the district average.
- Market conditions: Rents soft (-0.8%/yr); 377 active listings in the ZIP; 40 comparable units currently listed for rent nearby; rentals at typical pace (median 22d on market — plan ~3-4 weeks tenant-placement turnaround); high-income renter base; 1,737 units permitted in District of Columbia in 2024 (1,506 in 5+ unit buildings).
- This rent runs 42% of the median local income ($138k/yr) — at the standard rent-burdened threshold; future hikes will face affordability resistance.
Forward outlook
- Local home prices are declining (-3.0%/yr); year-one equity from $1k of loan paydown is wiped out by about $6k of value loss. Plan a longer hold.
- District of Columbia County population projected at +50% by 2050 — long-run rental-demand tailwind backs the buy-and-hold thesis.
- At projected returns (-3.0% appreciation + 0.0% rent growth), your $56k cash investment doubles in ~4 years — after that, you're playing with house money.
Negotiation context
- It's been on market 42 days — a 3% lower offer ($194k) is reasonable based on typical stale-listing flexibility.
- 5 sale attempts since 16y ago; this cycle's ask is 3475% above the opening price — seller raised mid-cycle; expect resistance to lowballs.
Risks & watch-outs
- Watch-outs: property tax is 4.3% of price; flood insurance adds $56/mo; built in 1905 — expect roof / HVAC / electrical / plumbing capex.
- Climate carrying-cost: severe flood risk; extreme-heat days projected 7→15/yr by 2055 (HVAC capex compounding) — expect insurance premiums to compound above CPI over the hold.
Questions for the listing agent
- It's been on market 42 days. Have you received any prior offers? Is the seller open to a 3% concession, seller financing, or rate buy-down credit?
- Built in 1905 — when were the roof, HVAC, electrical panel, plumbing, and water heater last replaced?
- Property tax is high relative to price — has the assessment been appealed recently, and will the sale trigger a re-assessment?
- What's the actual annual flood-insurance premium (NFIP or private), and is the property in a SFHA with mandatory coverage?
- Is there a deadline driving the sale (1031 exchange, divorce, estate, relocation)? That informs how much negotiation room exists.
- Crime grade is F in this area — have there been break-ins, vandalism, or insurance claims at this property in the last 3 years? What carrier currently insures it and at what premium?
- What's the average days-on-market for RENTAL listings here right now (not sales)? A rising rental-DOM trend means longer vacancies and softer asking-rent achievability than the comps imply.
- What's the recent tenant-quality profile in this submarket — average credit score on applications, eviction rate, late-payment / NSF rate, and stable-employment percentage? A property-management company in the area should have these aggregated.
- How much new for-sale + rental construction is in the pipeline within 1–3 miles? Heavy new supply typically softens prices + rents 12–24 months out; constrained supply supports both.
Investment metrics
- 1% rule
- 2.40% ✓
- Cap rate
- 18.02%
- Cash-on-cash
- 41.87%
- DSCR
- 2.86
- GRM
- 3.5
CMA / ARV
- ARV (on-the-fly)
- $803,488
- Comps found
- 2
Show comp detail 2 sales within ~0.75 mi
| Address | Dist | Beds/Ba | Sqft | Sold | Price | $/sf | Match |
|---|---|---|---|---|---|---|---|
| 1452 Fairmont St NW Unit C | 0.43mi | 3/2.0 (-1) | 1,719 (-10%) | 18mo | $364,000 | $212 | 42 |
| 1420 Newton St NW | 0.62mi | 5/2.0 (+1) | 1,720 (-10%) | 17mo | $725,000 | $422 | 34 |
Match score weights: distance 35% · size 25% · config 20% · recency 20%. Top-matched comps best support the ARV.
Projected returns pro-forma
-3.0% appreciation · 0.0% rent growth · sell at horizon
- IRR
- 33.2%
- Equity multiple
- 2.34×
- Total profit
- $74,815
- Equity at exit
- $29,821
- IRR
- 38.3%
- Equity multiple
- 4.00×
- Total profit
- $167,998
- Equity at exit
- $17,292
Cash invested: $56,000 (down + closing). Projections, not guarantees.
Landlord ↔ Tenant lean methodology
- Overall (CITY)
- 0 Strongly Tenant-Friendly
- State District of Columbia
- 12 Strongly Tenant-Friendly · D+43
- County
- — inherits STATE
- City Washington
- 0 Strongly Tenant-Friendly · D+43
ZIP-level market 20001
- Rents YoY
- -0.8%
- Active inventory
- 377
- Price-to-rent
- 3.5×
Monthly cashflow live
- Estimated rent
- $4,807 high interval (Pro) →
- Mortgage (P&I)
- −$1,049
- Tax from tax record
- −$711 /mo · $8,532/yr
- Insurance
- −$83
- Flood insurance flood zone
- −$56 /mo · $666/yr
- HOA
- −$0
- Vacancy / Maint / Mgmt
- −$1,009
- Net cashflow
- $1,899
Break-even live
Sensitivity live
| Price | -10% $2,012 | -5% $1,955 | +0% $1,899 | +5% $1,842 | +10% $1,785 |
|---|---|---|---|---|---|
| Rent | -10% $1,519 | -5% $1,709 | +0% $1,899 | +5% $2,088 | +10% $2,278 |
| Rate | -1.0pp $1,999 | -0.5pp $1,949 | base $1,899 | +0.5pp $1,847 | +1.0pp $1,794 |
UW: 25.0% down · 7.5% · 30yr · 1.5% tax · 5.0% vac · 8.0% maint · 8.0% mgmt
Financing live
Cash to close
- Down payment
- $50,000
- Closing costs
- $6,000
- Reserves months
- —
- Total cash needed
- —
Loan-product check · same deal, 3 products live
Conventional
25% down · 7.5% · 30yr
- Down + closing
- —
- Monthly P&I
- —
- Monthly cashflow
- —
- DSCR
- —
- Eligible?
- —
Personal DTI + credit; lowest rate.
DSCR
20% down · 8.5% · 30yr
- Down + closing
- —
- Monthly P&I
- —
- Monthly cashflow
- —
- DSCR
- —
- Eligible?
- —
No personal income docs; deal must DSCR.
Hard money
10% down · 12.0% · 12mo
- Down + closing
- —
- Monthly P&I
- —
- Monthly cashflow
- —
- DSCR
- —
- Eligible?
- —
Short-term bridge; refi at stabilization.
Rent comps 40 comps
| Address | Beds | Baths | Sqft | Rent | $/sqft | DOM | Units | Dist |
|---|---|---|---|---|---|---|---|---|
| 2712 Sherman Ave NW Washington, DC | 5.0 | 3.5 | 1904 | $5,400 | $2.84 | 26d | 1 | 0.02mi |
| 787 Fairmont St NW Washington, DC | 4.0 | 2.5 | 2350 | $4,950 | $2.11 | 20d | 1 | 0.03mi |
| 2707 11th St NW Washington, DC | 3.0 | 1.0 | 2223 | $2,999 | $1.35 | 26d | 1 | 0.04mi |
| 1004 Girard St NW Washington, DC | 3.0 | 3.5 | 1764 | $4,800 | $2.72 | 26d | 1 | 0.05mi |
| 1017 Euclid St NW #1 Washington, DC | 5.0 | 2.0 | 2048 | $6,999 | $3.42 | 26d | 1 | 0.05mi |
| 763 Girard St NW Washington, DC | 3.0 | 2.5 | 1300 | $3,950 | $3.04 | 9d | 1 | 0.09mi |
| 2533 11th St NW Washington, DC | 3.0 | 2.5 | 2220 | $4,000 | $1.80 | 13d | 1 | 0.12mi |
| 738 Gresham Pl NW Washington, DC | 5.0 | 3.0 | 2166 | $5,500 | $2.54 | 26d | 1 | 0.14mi |
| 733 Gresham Pl NW Washington, DC | 5.0 | 2.0 | 1384 | $4,995 | $3.61 | 26d | 1 | 0.16mi |
| 2717 13th St NW Unit B Washington, DC | 4.0 | 3.5 | 2127 | $5,600 | $2.63 | 26d | 1 | 0.18mi |
| 1113 Clifton St NW Washington, DC | 4.0 | 2.5 | 2076 | $5,700 | $2.75 | 26d | 1 | 0.19mi |
| 636 Columbia Rd NW Washington, DC | 5.0 | 2.5 | 2070 | $4,900 | $2.37 | 26d | 1 | 0.30mi |
| 636 Columbia Rd NW Washington, DC | 4.0 | 2.5 | 2070 | $4,900 | $2.37 | 17d | 1 | 0.30mi |
| 1028 Kenyon St NW Washington, DC | 5.0 | 3.5 | 1800 | $5,395 | $3.00 | 20d | 1 | 0.32mi |
| 3116 13th St NW Washington, DC | 3.0 | 1.0 | 1678 | $2,850 | $1.70 | 9d | 1 | 0.36mi |
| 517 Columbia Rd NW Washington, DC | 4.0 | 2.5 | 1350 | $4,950 | $3.67 | 20d | 1 | 0.41mi |
| 2228 13th St NW #3 Washington, DC | 3.0 | 2.5 | 1305 | $6,200 | $4.75 | 26d | 1 | 0.41mi |
| 520 Irving St NW Washington, DC | 5.0 | 3.5 | 2600 | $6,700 | $2.58 | 3d | 1 | 0.42mi |
| 636 Lamont St NW Washington, DC | 3.0 | 2.5 | 1250 | $3,600 | $2.88 | 21d | 1 | 0.46mi |
| 1227 V St NW Washington, DC | 3.0 | 2.5 | 1674 | $5,550 | $3.32 | 4d | 1 | 0.50mi |
| 1315 Park Rd NW #22 Washington, DC | 3.0 | 2.0 | 1800 | $4,444 | $2.47 | 7d | 1 | 0.50mi |
| 2016 10th St NW Washington, DC | 3.0 | 3.0 | 1656 | $4,500 | $2.72 | 20d | 1 | 0.51mi |
| 752 Park Rd NW Washington, DC | 3.0 | 2.5 | 1920 | $3,595 | $1.87 | 26d | 1 | 0.53mi |
| 447 Lamont St NW Washington, DC | 5.0 | 2.5 | 2000 | $5,600 | $2.80 | 7d | 1 | 0.56mi |
| 1915 11th St NW Washington, DC | 3.0 | 2.0 | 1750 | $4,650 | $2.66 | 26d | 1 | 0.60mi |
| 909 T St NW Washington, DC | 4.0 | 2.5 | 2500 | $6,100 | $2.44 | 9d | 1 | 0.64mi |
| 3613 New Hampshire Ave NW Washington, DC | 4.0 | 2.0 | 1400 | $3,800 | $2.71 | 26d | 1 | 0.65mi |
| 3552 Warder St NW #1 Washington, DC | 3.0 | 2.5 | 1500 | $3,750 | $2.50 | 22d | 1 | 0.66mi |
| 3552 Warder St NW Washington, DC | 3.0 | 3.0 | 1240 | $3,995 | $3.22 | 26d | 1 | 0.66mi |
| 1837 11th St NW Washington, DC | 3.0 | 2.0 | 1563 | $4,500 | $2.88 | 0d | 1 | 0.67mi |
| 1005 Otis Pl NW Washington, DC | 4.0 | 2.0 | 1600 | $1,125 | $0.70 | 26d | 1 | 0.68mi |
| 1920 6th St NW Washington, DC | 3.0 | 2.5 | 1928 | $5,500 | $2.85 | 20d | 1 | 0.68mi |
| 613 Florida Ave NW #2 Washington, DC | 3.0 | 2.0 | 2400 | $4,600 | $1.92 | 6d | 1 | 0.69mi |
| 138 Bryant St NW Washington, DC | 4.0 | 2.0 | 1809 | $3,750 | $2.07 | 22d | 1 | 0.74mi |
| 1936 15th St NW Unit 1055 Washington, DC | 3.0 | 3.0 | 1800 | $3,610 | $2.01 | 4d | 1 | 0.74mi |
| 1805 9th St NW Washington, DC | 3.0 | 2.5 | 1800 | $4,995 | $2.77 | 23d | 1 | 0.75mi |
| 1944 3rd St NW Washington, DC | 3.0 | 2.5 | 2124 | $4,195 | $1.98 | 26d | 1 | 0.75mi |
| 237 Elm St NW Washington, DC | 3.0 | 1.5 | 1484 | $3,100 | $2.09 | 26d | 1 | 0.76mi |
| 1358 Parkwood Pl NW Washington, DC | 3.0 | 1.0 | 1280 | $4,500 | $3.52 | 9d | 1 | 0.77mi |
| 1307 S St NW Washington, DC | 3.0 | 3.5 | 2450 | $7,500 | $3.06 | 26d | 1 | 0.77mi |
Listing history 31 events
-
2026-06-21days on market $199,999 Active 42 DOM
-
2026-06-18days on market $199,999 Active 39 DOM
-
2026-06-17days on market $199,999 Active 38 DOM
-
2026-06-16days on market $199,999 Active 37 DOM
-
2026-06-15days on market $199,999 Active 36 DOM
-
2026-06-13days on market $199,999 Active 34 DOM
-
2026-06-09days on market $199,999 Active 30 DOM
-
2026-06-08days on market $199,999 Active 29 DOM
-
2026-06-07days on market $199,999 Active 28 DOM
-
2026-06-04days on market $199,999 Active 25 DOM
-
2026-06-03days on market $199,999 Active 24 DOM
-
2026-06-02days on market $199,999 Active 23 DOM
-
2026-06-01days on market $199,999 Active 22 DOM
-
2026-05-31days on market $199,999 Active 21 DOM
-
2026-05-27price $199,999
-
2026-05-27status Active
-
2026-04-23historical
-
2026-04-16price $5,400
-
2026-04-10$5,595
-
2026-04-07$699,900 Active
-
2026-04-02historical $699,900
-
2014-01-24soldstatus $650,000
-
2011-08-22soldstatus $340,000
-
2011-08-16soldstatus $340,000 Sold 137-char remark
Show marketing remark (137 chars)
Potential for possible condo conversion- sold in "as is" condition- could also become a fine renovated single family residence.
-
2011-08-16soldstatus $340,000 137-char remark
Show marketing remark (137 chars)
Potential for possible condo conversion- sold in "as is" condition- could also become a fine renovated single family residence.
-
2011-06-13status Contingent (No Kick Out) 137-char remark
Show marketing remark (137 chars)
Potential for possible condo conversion- sold in "as is" condition- could also become a fine renovated single family residence.
-
2011-06-05historical 137-char remark
Show marketing remark (137 chars)
Potential for possible condo conversion- sold in "as is" condition- could also become a fine renovated single family residence.
-
2011-01-06price $399,000 137-char remark
Show marketing remark (137 chars)
Potential for possible condo conversion- sold in "as is" condition- could also become a fine renovated single family residence.
-
2010-07-16$545,000 Active 137-char remark
Show marketing remark (137 chars)
Potential for possible condo conversion- sold in "as is" condition- could also become a fine renovated single family residence.
-
2010-07-16$399,000 137-char remark
Show marketing remark (137 chars)
Potential for possible condo conversion- sold in "as is" condition- could also become a fine renovated single family residence.
-
1986-08-11soldstatus $67,950
ⓘ Source: listings_history table (triggers on properties + properties_extension) + one-shot
backfill from property_details.listing_events for pre-trigger history.
Tax reassessment forecast DC · Partial reset (capped growth)
- Current annual tax
- $8,532 · $711/mo
- Projected year-2 tax
- $8,532 · $711/mo
- Expected delta
- $0/yr ($0/mo · 0.0%)
ⓘ Screening estimate from a state-policy table — verify with the county assessor before closing.
Climate risk First Street
- Flood 8/10 Severe FEMA zone X (unshaded) · 99% chance over 30 yrs
- Wildfire 1/10 Low
- Heat 7/10 Severe 7 d/yr ≥105°F today · 15 d/yr by 30 yrs out
- Wind 4/10 Moderate 15% chance of damaging wind over 30 yrs
- Air quality 4/10 Moderate 4 unhealthy d/yr today · 5 by 30 yrs out
Nearby sold comps map
Loading sold comps map…
Walkable amenities ~0.75 mi
Loading nearby amenities…
Taxation est. · year 1
- Rental income
- $57,680
- − Mortgage interest
- −$11,203
- − Property taxes
- −$8,532
- − Insurance
- −$1,666
- − Repairs & maintenance
- −$4,614
- − Management
- −$4,614
- − Depreciation
- −$5,818
- Taxable income
- $21,231
- Est. tax owed @ 24.0%
- −$5,096
- After-tax cash flow
- $17,687/yr
For passive investors: Depreciation is non-cash, so a rental often shows a tax loss while cash-flowing — sheltering income. Rental losses are passive: they offset passive income freely, and up to $25,000/yr can offset ordinary (W-2) income if you actively participate and your MAGI is under $100k (phasing out to $0 by $150k); unused losses carry forward. On sale, claimed depreciation is recaptured at up to 25%, and gains may owe capital-gains tax (a 1031 exchange can defer both). Figures are a year-1 estimate at your 24.0% rate — not tax advice; consult a CPA.
Schools (NCES district)
- District
- District Of Columbia Public Schools
- NCES district ID
- 1100030
- Math proficiency
- 33% ▲ 3.00%
- Reading proficiency
- 40% ▲ 5.00%
- Median HH income
- $67,671
- Composite
- 35.84/100
- National rank
- #9606
- State rank
- #8 of 32 in DC
Livability — Washington
- Score
- 73/100
- State rank
- #1
- US rank
- #5327
Category grades
Schools grade is shown separately in the Schools card above.
Census & demographics
- Census place
- Washington, DC
- County
- District of Columbia · 671,873 people
- City population
- 671,873
- Metro
- Washington-Arlington-Alexandria, DC-VA-MD-WV
- Population (ZIP)
- 44,616
- Household income
- $138,059
- Rent vs Own
- Severe rent burden
- 3130.0
Population outlook (District of Columbia County) Hauer SSP2
- Today (2025)
- 821,926 people
- By 2030
- 899,517 · +9.4%
- By 2040
- 1,061,162 · +29.1%
- By 2050
- 1,231,493 · +49.8%
- By 2075
- 1,603,312 · +95.1%
- By 2100
- 1,847,141 · +124.7%
Race, ethnicity, and origin ACS 2023
- Neighborhood character
- Diverse neighborhood (Simpson 0.67)
- Race & ethnicity
- White 47% Black 30% Hispanic / Latino 11% Two or more races 8% Asian 7%
- Hispanic origin (detail)
- Mexican 2%
- Common ancestry
- Romanian 3% Lithuanian 3% Italian 2%
- Foreign-born
- 15% · Canada, China, South Korea
- Languages at home
- 81% English-only · Spanish 7% Chinese 3% Other Indo-European 2%
Political lean MEDSL · District of Columbia
- 2024 margin
- Solid D (+86.1) · D 91.2% · R 5.1% · Other 3.8%
- 2008→2024 swing
- +0.1pp no change · 2008: 85.9pp · 2024: 86.1pp
- All cycles
- 2024: D+86.1 2020: D+86.8 2016: D+88.7 2012: D+84.2 2008: D+85.9
Not yet ingested
- Civics
- —
Market trends
- HPI YoY
- ▼ -859.30%
- Current HPI
- 400.1329
- Rent YoY
- ▼ -0.75%
- Metro
- Washington-Arlington-Alexandria, DC-VA-MD-WV
- State GDP YoY
- ▲ 1.33%
- F500 in state
- 6
Industry mix (Fortune 500 HQ in DC)
| Industry | F500 HQs | Revenue |
|---|---|---|
| Financial Services | 1 | $153B |
|
||
| Life Sciences / Industrials | 1 | $25B |
|
||
| Industrial Machinery | 1 | $8B |
|
||
Price history
+194.3% since first listed17 events — show timeline
- 2026-05-27 Price Changed $199,999 BRIGHT MLS
- 2026-05-27 Relisted — BRIGHT MLS
- 2026-04-23 Listing Removed — BRIGHT MLS
- 2026-04-16 Price Changed $5,400 BRIGHTMLS
- 2026-04-10 Listed for Rent $5,595 BRIGHTMLS
- 2026-04-07 Listed $699,900 BRIGHT MLS
- 2026-04-02 Coming Soon $699,900 BRIGHT MLS
- 2014-01-24 Sold (Public Records) $650,000 Public Records
- 2011-08-22 Sold (Public Records) $340,000 Public Records
- 2011-08-16 Sold (MLS) $340,000 BRIGHT MLS
- 2011-08-16 Sold (MLS) $340,000 MRIS
- 2011-06-13 Pending — MRIS
- 2011-06-05 Listing Removed — BRIGHT MLS
- 2011-01-06 Price Changed $399,000 MRIS
- 2010-07-16 Listed $545,000 MRIS
- 2010-07-16 Listed $399,000 BRIGHT MLS
- 1986-08-11 Sold (Public Records) $67,950 Public Records
Property tax history
+2.8%/yrLatest (2025): $8,532 · +1.0% YoY. Source: county tax records.
Cash-flow waterfall
monthlySold comps — $/sqft
last 12 mo · ≤1 miLoading sold comps…