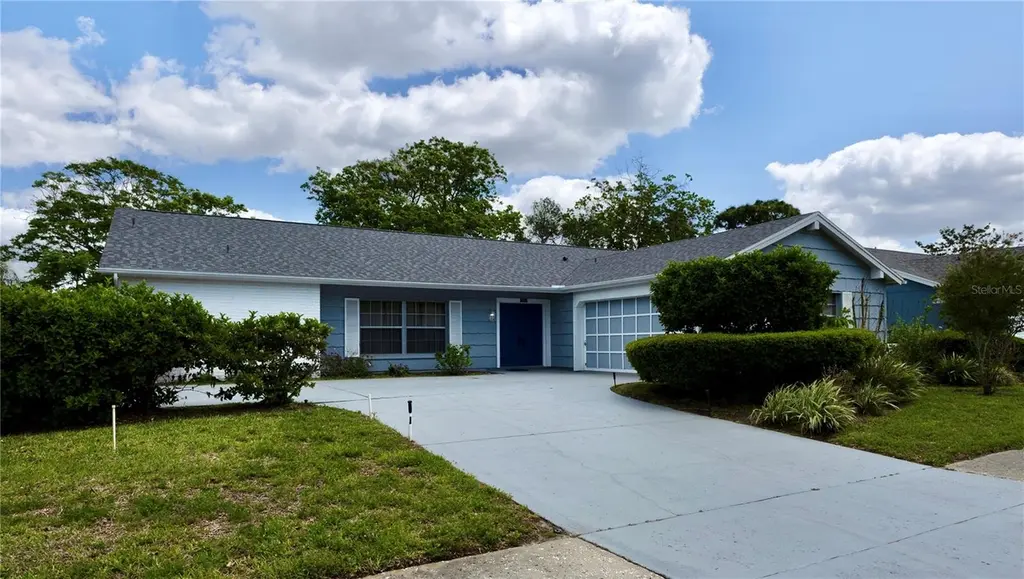
13404 Rayburn Rd · Hudson, FL
Flood risk 1/10 · Minimal
- FEMA flood zone
- X (unshaded)
- Chance of flooding over 30 yrs
- 0.0%
- Est. flood insurance / yr
- $507 – $1,088
Fire risk 1/10 · Minimal
- Est. fire insurance / yr
- $947 – $1,759
Heat risk 10/10 · Severe
- Hot days now (above 108°F)
- 7 days/yr
- Hot days in 30 yrs
- 25 days/yr
Wind risk 10/10 · Severe
- Chance of severe wind over 30 yrs
- 99.0%
Air-quality risk 2/10 · Minimal
- Unhealthy air days now
- 2 days/yr
- Unhealthy air days in 30 yrs
- 2 days/yr
Risk factors via First Street. Map © Google.
Why this score? — see what drove the D+ grade
The composite is a weighted blend of 9 inputs, each scored 0–100. Each bar is that input's sub-score; the figure is the points it added to the 100-point composite (weight × sub-score).
- Cash flow +13.5/30.0
- ARV discount +13.5/15.0
- Schools +4.3/10.0
- DSCR +4.1/10.0
- Livability +3.7/5.0
- 1% rule +2.8/10.0
- Condition / age +2.5/5.0
- Rent growth +1.9/5.0
- Appreciation +0.0/10.0
$294,900
🖨 Deal sheet 📄 Offer letter ✓ Due diligence
Listing remarks
Motivated Seller! Welcome to this well-maintained 3-bedroom, 2-bath home offering a functional layout and a unique side-entry garage design that enhances both curb appeal and interior flow. Recent updates include an architectural shingle roof installed in 2025, a 3.5-ton Goodman A/C system installed on April 21, 2022, and GE kitchen appliances (refrigerator, range, and microwave) installed in 2025. The property also features a sprinkler system supplied by a well for lawn irrigation. The kitchen features solid wood cabinetry and granite countertops, while the interior offers clean, well-kept living spaces and a comfortable layout. A dedicated laundry room includes built-in cabinetry and a fo
Key facts
- Solid wood cabinetry
- Screened lanai
- Sprinkler system
Tags
Property features AI
Finance
- Other: No lease restrictions indicated; R4 zoning
- Financial info: Total monthly fees shown as $33.33; total annual fees shown as $400
- HOA & community: HOA required (Association: Jane Katzen); Monthly HOA approx. $33.33 (Quarterly association fee $100); Community clubhouse, playground, pool, tennis courts, basketball court, shuffleboard court, street lights; Pets allowed
Exterior
- Parking: Driveway; Garage door opener; Attached 2-car garage
- Utilities: Public water and well; Public sewer; Cable available; High-speed internet/BB available; Electricity available and connected; Sprinkler meter and sprinkler well
- Home design: Single family residence; One story; Faces west; Accessible features including accessible bedroom, closets, entrance, hallway(s), kitchen, and washer/dryer
- Construction: Block and stucco construction; Shingle roof; Slab foundation; Built as a one-level home
- Exterior features: Screened patio/porch; Rain gutters; Sidewalk; Sliding doors; Sprinkler (metered); Mature landscaping; Concrete road frontage
Interior
- Kitchen: Dishwasher; Range; Microwave; Refrigerator; Solid surface and stone counters; Solid wood cabinets
- Bedrooms: 3 bedrooms
- Flooring: Carpet; Linoleum; Tile
- Bathrooms: 2 full bathrooms
- Heating & cooling: Electric heating; Central air conditioning
- Interior features: Ceiling fans; Eat-in kitchen; Kitchen open to family room; Living room and dining room combo; Solid surface counters; Stone counters; Solid wood cabinets; Split bedroom floorplan; Walk-in closets; Aluminum frame windows
- Laundry & utility: Washer hookup; Dryer hookup; Inside laundry room; Electric water heater
Neighborhood map
What this means for you Summary
Snapshot
- This is a 3-bed/2.0-bath single-family listed at $295k.
Deal economics
- At list price, monthly cash flow is $10 ($125/yr) — positive.
- The deal already cash-flows at list — no discount required.
- To meet the 1% rule (rent ≥ 1% of price), the offer needs to be $231k (21.6% below list).
- Recommended offer: $231k (21.6% below list) — sets the bar for 1% rule.
- Cap rate 6.3% vs local median 3.4% in Hudson — top-decile yield for the area; either an underpriced asset or a hidden risk that comps aren't pricing in. Stress-test before assuming the spread holds.
Location & tenants
- Location reads 74/100 on livability (#289 in FL, #4,856 nationally) — a middle-class / working-renter tenant base. Strengths: cost of living A+, housing A+, health & safety A+; Watch: amenities D, employment D, commute F.
- Pasco (suburban): math 50% / reading 52% proficiency, ranked #32 of 73 in FL (top 44%) — acceptable for families but not a draw, mixed tenant base, ~2y average lease.
- Zoned schools: Hudson Primary Academy (math 29% / reading 31%, grade F, #1,882 of 2,144 statewide, top 88%, 647 students, 90% FRL); Hudson High School (math 45% / reading 40%, grade F, #264 of 667 statewide, top 41%, 1,387 students, 66% FRL) — zoned schools average 78% FRL vs 48% district-wide (30 pts higher); higher-poverty schools than district average — tighter screening recommended.
- Zoned-school proficiency averages 36% at this address vs 51% district-wide (-15 pts) — the specific schools serving this property underperform the Pasco average; the district grade overstates school quality for this exact location.
- Market conditions: Rents soft (-2.3%/yr); 790 active listings in the ZIP; 17 comparable units currently listed for rent nearby; rentals at typical pace (median 21d on market — plan ~3-4 weeks tenant-placement turnaround); 6,765 units permitted in Pasco County in 2024 (1,250 in 5+ unit buildings).
- At $2,313/mo this rent would consume 54% of the median local household income ($51k/yr) (locally 946% of renters already pay >50% of income on rent) — very limited rent-growth headroom before tenants either downsize or default.
Forward outlook
- Local home prices are declining (-3.0%/yr); year-one equity from $2k of loan paydown is wiped out by about $9k of value loss. Plan a longer hold.
- Pasco County population projected at +29% by 2050 — long-run rental-demand tailwind backs the buy-and-hold thesis.
Negotiation context
- It's been on market 65 days — a 6% lower offer ($277k) is reasonable based on typical stale-listing flexibility.
Risks & watch-outs
- Climate carrying-cost: severe wind risk, 99% chance of damaging wind over 30y; extreme-heat days projected 7→25/yr by 2055 (HVAC capex compounding) — expect insurance premiums to compound above CPI over the hold.
Questions for the listing agent
- It's been on market 65 days. Have you received any prior offers? Is the seller open to a 22% concession, seller financing, or rate buy-down credit?
- What does the HOA fee cover, when was the last increase, and are there any pending special assessments or reserve-fund shortfalls?
- Why hasn't it sold? Are there any deal-killer items the seller is aware of (foundation, flood, title, zoning, code violations)?
- Is there a deadline driving the sale (1031 exchange, divorce, estate, relocation)? That informs how much negotiation room exists.
- Schools are D-rated, which usually means shorter tenancies and higher turnover. Who's the typical renter profile here, and what's been the actual vacancy rate?
- The area grade is low — what's the realistic commute time and amenity access for the typical tenant pool here? Any planned neighborhood developments (good or bad) we should know about?
- What's the average days-on-market for RENTAL listings here right now (not sales)? A rising rental-DOM trend means longer vacancies and softer asking-rent achievability than the comps imply.
- What's the recent tenant-quality profile in this submarket — average credit score on applications, eviction rate, late-payment / NSF rate, and stable-employment percentage? A property-management company in the area should have these aggregated.
- How much new for-sale + rental construction is in the pipeline within 1–3 miles? Heavy new supply typically softens prices + rents 12–24 months out; constrained supply supports both.
Investment metrics
- 1% rule
- 0.78% ✗
- Cap rate
- 6.34%
- Cash-on-cash
- 0.15%
- DSCR
- 1.01
- GRM
- 10.6
CMA / ARV
- ARV (on-the-fly)
- $340,032
- Comps found
- 12
Show comp detail 12 sales within ~0.75 mi
| Address | Dist | Beds/Ba | Sqft | Sold | Price | $/sf | Match |
|---|---|---|---|---|---|---|---|
| 8108 Rumford Ct | 0.06mi | 3/2.0 | 1,773 (-8%) | 0mo | $275,000 | $155 | 83 |
| 8103 Roxboro Dr | 0.13mi | 3/2.0 | 1,749 (-10%) | 1mo | $307,400 | $176 | 78 |
| 8405 Reynolds Dr | 0.20mi | 3/2.0 | 1,771 (-8%) | 2mo | $289,000 | $163 | 76 |
| 8302 Danbury Ln | 0.37mi | 3/2.0 | 1,871 (-3%) | 3mo | $325,000 | $174 | 75 |
| 8035 Woodbrook Ct | 0.21mi | 3/2.0 | 1,747 (-10%) | 2mo | $300,000 | $172 | 72 |
| 13155 Clock Tower Pkwy | 0.37mi | 3/2.0 | 1,832 (-5%) | 3mo | $299,000 | $163 | 72 |
| 8248 Millwood Dr | 0.25mi | 3/2.0 | 1,714 (-11%) | 1mo | $377,000 | $220 | 69 |
| 13944 Talmage Loop | 0.48mi | 3/2.0 | 2,090 (+8%) | 0mo | $406,000 | $194 | 64 |
| 13111 Sumpter Cir | 0.41mi | 4/2.0 (+1) | 2,072 (+7%) | 1mo | $349,900 | $169 | 63 |
| 8301 Valley Stream Ln | 0.66mi | 3/2.0 | 1,873 (-3%) | 2mo | $350,000 | $187 | 62 |
| 8523 Braxton Dr | 0.32mi | 3/2.0 | 1,644 (-15%) | 3mo | $325,000 | $198 | 58 |
| 13615 Arden Dr | 0.73mi | 3/2.0 | 2,040 (+6%) | 2mo | $367,000 | $180 | 55 |
Match score weights: distance 35% · size 25% · config 20% · recency 20%. Top-matched comps best support the ARV.
Projected returns pro-forma
-3.0% appreciation · 0.0% rent growth · sell at horizon
- IRR
- -19.2%
- Equity multiple
- 0.35×
- Total profit
- $-54,002
- Equity at exit
- $43,971
- IRR
- -18.6%
- Equity multiple
- 0.12×
- Total profit
- $-72,777
- Equity at exit
- $25,498
Cash invested: $82,572 (down + closing). Projections, not guarantees.
Landlord ↔ Tenant lean methodology
- Overall (STATE)
- 87 Strongly Landlord-Friendly
- State Florida
- 87 Strongly Landlord-Friendly · R+3
- County
- — inherits STATE
- City
- — inherits STATE
ZIP-level market 34667
- Rents YoY
- -2.3%
- Active inventory
- 790
- Price-to-rent
- 10.6×
Monthly cashflow live
- Estimated rent
- $2,313 high interval (Pro) →
- Mortgage (P&I)
- −$1,546
- Tax from tax record
- −$115 /mo · $1,375/yr
- Insurance
- −$123
- HOA
- −$33
- Vacancy / Maint / Mgmt
- −$486
- Net cashflow
- $10
Break-even live
UW: 25.0% down · 7.5% · 30yr · 1.5% tax · 5.0% vac · 8.0% maint · 8.0% mgmt
Financing live
Cash to close
- Down payment
- $73,725
- Closing costs
- $8,847
- Reserves months
- —
- Total cash needed
- —
Loan-product check · same deal, 3 products live
Conventional
25% down · 7.5% · 30yr
- Down + closing
- —
- Monthly P&I
- —
- Monthly cashflow
- —
- DSCR
- —
- Eligible?
- —
Personal DTI + credit; lowest rate.
DSCR
20% down · 8.5% · 30yr
- Down + closing
- —
- Monthly P&I
- —
- Monthly cashflow
- —
- DSCR
- —
- Eligible?
- —
No personal income docs; deal must DSCR.
Hard money
10% down · 12.0% · 12mo
- Down + closing
- —
- Monthly P&I
- —
- Monthly cashflow
- —
- DSCR
- —
- Eligible?
- —
Short-term bridge; refi at stabilization.
Rent comps 17 comps
| Address | Beds | Baths | Sqft | Rent | $/sqft | DOM | Units | Dist |
|---|---|---|---|---|---|---|---|---|
| 13121 Shadberry Ln Hudson, FL | 3.0 | 2.0 | 1771 | $1,889 | $1.07 | 3d | 1 | 0.35mi |
| 13642 Dunwoody Ct Hudson, FL | 3.0 | 2.0 | 1720 | $2,295 | $1.33 | 17d | 1 | 0.37mi |
| 8724 Ashbury Dr Hudson, FL | 3.0 | 2.0 | 2331 | $2,900 | $1.24 | 24d | 1 | 0.43mi |
| 8811 Seeley Ln Hudson, FL | 3.0 | 2.0 | 1981 | $1,895 | $0.96 | 18d | 1 | 0.72mi |
| 13013 Sawmill Way Hudson, FL | 2.0 | 2.0 | 1519 | $1,790 | $1.18 | 5d | 1 | 0.73mi |
| 13220 Whaler Dr Hudson, FL | 3.0 | 2.0 | 1566 | $1,990 | $1.27 | 24d | 1 | 0.78mi |
| 14144 Whitecap Ave Hudson, FL | 3.0 | 2.0 | 1594 | $2,450 | $1.54 | 20d | 1 | 0.78mi |
| 8826 Medalist Ct Hudson, FL | 4.0 | 2.0 | 2055 | $2,900 | $1.41 | 18d | 1 | 0.83mi |
| 7216 Gulf Breeze Cir Hudson, FL | 3.0 | 2.0 | 1520 | $1,781 | $1.17 | 5d | 1 | 0.99mi |
| 13847 Maria Dr Hudson beach34674, FL | 3.0 | 2.0 | 1448 | $3,000 | $2.07 | 24d | 1 | 1.11mi |
| 12215 Meadowbrook Ln Hudson, FL | 2.0 | 2.0 | 1519 | $1,850 | $1.22 | 24d | 1 | 1.21mi |
| 12213 Saddle Strap Row Hudson, FL | 3.0 | 2.0 | 1684 | $1,990 | $1.18 | 18d | 1 | 1.30mi |
| 14420 Pimberton Dr Hudson, FL | 3.0 | 2.0 | 1735 | $2,000 | $1.15 | 24d | 1 | 1.42mi |
| 6891 Clark St Hudson, FL | 3.0 | 3.0 | 1728 | $2,500 | $1.45 | 24d | 1 | 1.43mi |
| 14709 Shadowwood Blvd Hudson, FL | 2.0 | 2.0 | 1568 | $1,699 | $1.08 | 5d | 1 | 1.45mi |
| 13806 San Juan Ave Hudson, FL | 3.0 | 2.0 | 1800 | $3,500 | $1.94 | 24d | 1 | 1.48mi |
| 7708 Maryland Ave Hudson, FL | 3.0 | 2.0 | 1427 | $2,100 | $1.47 | 24d | 1 | 1.49mi |
HOA detail
- Monthly dues
- $33 · $396/yr
Listing history 15 events
-
2026-06-18days on market $294,900 Active 65 DOM
-
2026-06-17days on market $294,900 Active 64 DOM
-
2026-06-16days on market $294,900 Active 63 DOM
-
2026-06-15days on market $294,900 Active 62 DOM
-
2026-06-13days on market $294,900 Active 60 DOM
-
2026-06-09days on market $294,900 Active 56 DOM
-
2026-06-08days on market $294,900 Active 55 DOM
-
2026-06-07days on market $294,900 Active 54 DOM
-
2026-06-04days on market $294,900 Active 51 DOM
-
2026-06-03days on market $294,900 Active 50 DOM
-
2026-06-02days on market $294,900 Active 49 DOM
-
2026-06-01days on market $294,900 Active 48 DOM
-
2026-05-31days on market $294,900 Active 47 DOM
-
2026-04-29price $294,900
-
2026-04-14$329,900 Active
ⓘ Source: listings_history table (triggers on properties + properties_extension) + one-shot
backfill from property_details.listing_events for pre-trigger history.
Tax reassessment forecast FL · Resets to sale price
- Current annual tax
- $1,375 · $115/mo
- Projected year-2 tax
- $2,448 · $204/mo
- Expected delta
- +$1,072/yr (+$89/mo · 78.0%)
ⓘ Screening estimate from a state-policy table — verify with the county assessor before closing.
Climate risk First Street
- Flood 1/10 Low FEMA zone X (unshaded) · 0% chance over 30 yrs
- Wildfire 1/10 Low
- Heat 10/10 Extreme 7 d/yr ≥108°F today · 25 d/yr by 30 yrs out
- Wind 10/10 Extreme 99% chance of damaging wind over 30 yrs
- Air quality 2/10 Low 2 unhealthy d/yr today · 2 by 30 yrs out
Nearby sold comps map
Loading sold comps map…
Walkable amenities ~0.75 mi
Loading nearby amenities…
Taxation est. · year 1
- Rental income
- $27,758
- − Mortgage interest
- −$16,519
- − Property taxes
- −$1,375
- − Insurance
- −$1,474
- − Repairs & maintenance
- −$2,221
- − Management
- −$2,221
- − HOA
- −$396
- − Depreciation
- −$8,579
- Taxable loss
- −$5,027
- Est. tax savings @ 24.0%
- +$1,206
- After-tax cash flow
- $1,332/yr
For passive investors: Depreciation is non-cash, so a rental often shows a tax loss while cash-flowing — sheltering income. Rental losses are passive: they offset passive income freely, and up to $25,000/yr can offset ordinary (W-2) income if you actively participate and your MAGI is under $100k (phasing out to $0 by $150k); unused losses carry forward. On sale, claimed depreciation is recaptured at up to 25%, and gains may owe capital-gains tax (a 1031 exchange can defer both). Figures are a year-1 estimate at your 24.0% rate — not tax advice; consult a CPA.
Schools (NCES district)
- District
- Pasco
- NCES district ID
- 1201530
- Math proficiency
- 50% ▼ -10.00%
- Reading proficiency
- 52% ▼ -5.00%
- Median HH income
- $45,039
- Composite
- 43.14/100
- National rank
- #3074
- State rank
- #32 of 73 in FL
Livability — Hudson
- Score
- 74/100
- State rank
- #289
- US rank
- #4856
Category grades
Schools grade is shown separately in the Schools card above.
Census & demographics
- Census place
- Hudson, FL
- County
- Pasco County · 524,098 people
- Metro
- Tampa-St. Petersburg-Clearwater, FL
- Population (ZIP)
- 30,689
- Household income
- $51,280
- Rent vs Own
- Severe rent burden
- 946.0
Population outlook (Pasco County) Hauer SSP2
- Today (2025)
- 570,045 people
- By 2030
- 605,844 · +6.3%
- By 2040
- 674,806 · +18.4%
- By 2050
- 736,022 · +29.1%
- By 2075
- 862,900 · +51.4%
- By 2100
- 906,364 · +59.0%
Race, ethnicity, and origin ACS 2023
- Neighborhood character
- Predominantly White (86%)
- Race & ethnicity
- White 86% Hispanic / Latino 7% Two or more races 6% Black 2% Asian 2%
- Hispanic origin (detail)
- Mexican 1% Puerto Rican 2%
- Common ancestry
- Romanian 4% Lithuanian 3% Slovak 2%
- Foreign-born
- 7% · Canada, Jamaica, Vietnam
- Languages at home
- 91% English-only · Spanish 5% Other Indo-European 2% French/Haitian/Cajun 0%
Political lean MEDSL · Pasco
- 2024 margin
- Strong R (+25.2) · D 36.9% · R 62.1% · Other 1.0%
- 2008→2024 swing
- -21.6pp toward R · 2008: -3.6pp · 2024: -25.2pp
- All cycles
- 2024: R+25.2 2020: R+20.1 2016: R+21.6 2012: R+6.7 2008: R+3.6
Not yet ingested
- Civics
- —
Market trends
- HPI YoY
- ▼ -183.96%
- Current HPI
- 307.5552
- Rent YoY
- ▼ -2.26%
- Metro
- Tampa-St. Petersburg-Clearwater, FL
- State GDP YoY
- ▲ 3.28%
- F500 in state
- 36
Industry mix (Fortune 500 HQ in FL)
| Industry | F500 HQs | Revenue |
|---|---|---|
| Industrial Technology | 2 | $29B |
|
||
| Insurance | 2 | $17B |
|
||
| Retail | 1 | $60B |
|
||
| Technology Distribution | 1 | $58B |
|
||
| Homebuilding | 1 | $35B |
|
||
| Technology Manufacturing | 1 | $35B |
|
||
Price history
-10.6% since first listed2 events — show timeline
- 2026-04-29 Price Changed $294,900 Stellar MLS as Distributed by MLS Grid
- 2026-04-14 Listed $329,900 Stellar MLS as Distributed by MLS Grid
Property tax history
+1.9%/yrLatest (2025): $1,375 · +3.2% YoY. Source: county tax records.
Cash-flow waterfall
monthlySold comps — $/sqft
last 12 mo · ≤1 miLoading sold comps…