 Triplex
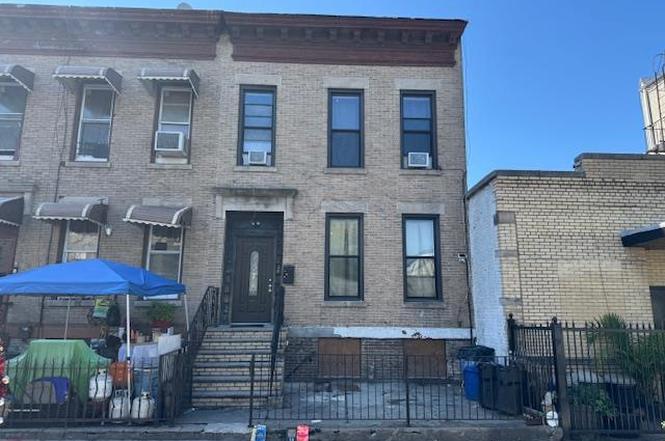
186 Howard Ave · New York, NY
Flood risk 7/10 · Major
- FEMA flood zone
- X (unshaded)
- Chance of flooding over 30 yrs
- 0.76%
- Est. flood insurance / yr
- $507 – $1,088
Fire risk 1/10 · Minimal
- Est. fire insurance / yr
- $691 – $1,283
Heat risk 6/10 · Moderate
- Hot days now (above 99°F)
- 7 days/yr
- Hot days in 30 yrs
- 15 days/yr
Wind risk 6/10 · Moderate
- Chance of severe wind over 30 yrs
- 39.0%
Air-quality risk 5/10 · Moderate
- Unhealthy air days now
- 6 days/yr
- Unhealthy air days in 30 yrs
- 8 days/yr
Risk factors via First Street. Map © Google.
Why this score? — see what drove the D- grade
The composite is a weighted blend of 9 inputs, each scored 0–100. Each bar is that input's sub-score; the figure is the points it added to the 100-point composite (weight × sub-score).
- Appreciation +10.0/10.0
- ARV discount +7.5/15.0
- Schools +5.0/10.0
- Cash flow +4.1/30.0
- Rent growth +4.1/5.0
- Livability +3.8/5.0
- Condition / age +2.5/5.0
- 1% rule +0.0/10.0
- DSCR +0.0/10.0
$1,225,000
🖨 Deal sheet (PDF) 📄 Offer letter ✓ Due diligence
Multi-family units
County records classify this as Multi-Family (2-4 Unit). Listing-text estimate: 3 units. confirmed
Listing remarks
Bank-owned, sold as-is. Previous owner had fully-renovated within past 10 years and now bank-owned and selling fully-rented with PAYING TENANTS. There are 2 gas boilers, and 3 electric meters. Tenants are paying their own gas and electric . Collecting $8,251.75/mo. or $99,021/year. Lot size is 20' x 100'. Taxes: $5,890/year. Don't miss this great opportunity to buy and hold in Bed-Stuy! Investor's Delight
Key facts
- 1,967 sq ft lot
- Built 1910
- Listed 129 days
Neighborhood map
What this means for you Summary
Snapshot
- This is a 3 × 3-bed/1.7-bath units multifamily listed at $1.23M.
Deal economics
- At list price, monthly cash flow is $-3k ($-41k/yr) — negative. Per door: $-1k/mo.
- To cash-flow at today's rent, offer at most $617k (49.7% below list).
- To meet the 1% rule (rent ≥ 1% of price), the offer needs to be $513k (58.1% below list).
- Recommended offer: $513k (58.1% below list) — sets the bar for 1% rule.
Location & tenants
- Location reads 75/100 on livability (#268 in NY, #4,188 nationally) — a middle-class / working-renter tenant base. Strengths: amenities A+, commute A+, health & safety A; Watch: crime F, cost of living F.
- Zoned schools: Elm Tree Elementary School (math 27% / reading 52%, grade F, #1,444 of 2,108 statewide, top 71%, 806 students, 94% FRL); Jhs 383 Philippa Schuyler (math 32% / reading 67%, grade C, #280 of 729 statewide, top 40%, 822 students, 85% FRL); Midwood High School (math 94% / reading 96%, grade A+, #83 of 1,100 statewide, top 8%, 4,062 students, 73% FRL).
- Market conditions: Rents rising fast (+6.4%/yr); 152 active listings in the ZIP; 10,063 units permitted in Kings County in 2024 (9,789 in 5+ unit buildings).
- At $5,131/mo this rent would consume 99% of the median local household income ($62k/yr) (locally 6960% of renters already pay >50% of income on rent) — very limited rent-growth headroom before tenants either downsize or default.
Forward outlook
- In year one you build about $131k of equity ($8k loan paydown + $122k appreciation (10.0% local appreciation)).
- Kings County population projected at +13% by 2050 — modest demand growth; plan on rents tracking national, not racing it.
- By year 2, paydown + projected appreciation supports a ~$211k cash-out refi (75% LTV) — recoverable capital for the next deal without selling this one.
Negotiation context
- It's been on market 129 days — a 12% lower offer ($1.08M) is reasonable based on typical stale-listing flexibility.
- Current owner paid $720k; list at $1.23M implies a 70% gain — meaningful room to come down on a strong offer.
Risks & watch-outs
- Watch-outs: flood insurance adds $66/mo; built in 1910 — expect roof / HVAC / electrical / plumbing capex.
- Climate carrying-cost: major flood risk; major wind risk, 39% chance of damaging wind over 30y; extreme-heat days projected 7→15/yr by 2055 (HVAC capex compounding) — expect insurance premiums to compound above CPI over the hold.
Questions for the listing agent
- What do current leases actually rent for vs. the listed asking? Can we see a recent rent roll and the last 12 months of T-12 income?
- It's been on market 129 days. Have you received any prior offers? Is the seller open to a 58% concession, seller financing, or rate buy-down credit?
- Can we see the unit-by-unit rent roll, current vacancy, and any below-market leases? What's the average tenancy length?
- What capital expenditures (roof, boiler, parking lot, exteriors) have been made in the last 5 years, and what's planned in the next 2?
- Built in 1910 — when were the roof, HVAC, electrical panel, plumbing, and water heater last replaced?
- What's the actual annual flood-insurance premium (NFIP or private), and is the property in a SFHA with mandatory coverage?
- Why hasn't it sold? Are there any deal-killer items the seller is aware of (foundation, flood, title, zoning, code violations)?
- Is there a deadline driving the sale (1031 exchange, divorce, estate, relocation)? That informs how much negotiation room exists.
- Schools are B-rated — typically a magnet for longer-tenancy family renters. What's the average tenant stay here, and is there a school-zone premium baked into asking?
- Crime grade is F in this area — have there been break-ins, vandalism, or insurance claims at this property in the last 3 years? What carrier currently insures it and at what premium?
- The area grade is low — what's the realistic commute time and amenity access for the typical tenant pool here? Any planned neighborhood developments (good or bad) we should know about?
- What's the average days-on-market for RENTAL listings here right now (not sales)? A rising rental-DOM trend means longer vacancies and softer asking-rent achievability than the comps imply.
- What's the recent tenant-quality profile in this submarket — average credit score on applications, eviction rate, late-payment / NSF rate, and stable-employment percentage? A property-management company in the area should have these aggregated.
- How much new apartment / multifamily construction is in the pipeline within 1–3 miles? Heavy new supply (>2% of stock underway) typically softens rents 12–24 months out; light construction supports rent growth.
Investment metrics
- 1% rule
- 0.42% ✗
- Cap rate
- 2.98%
- Cash-on-cash
- -11.82%
- DSCR
- 0.47
- GRM
- 19.9
CMA / ARV
No comps found within radius.
Projected returns pro-forma
10.0% appreciation · 6.44% rent growth · sell at horizon
- IRR
- 16.4%
- Equity multiple
- 2.36×
- Total profit
- $465,647
- Equity at exit
- $1,103,577
- IRR
- 16.2%
- Equity multiple
- 5.62×
- Total profit
- $1,585,556
- Equity at exit
- $2,379,906
Cash invested: $343,000 (down + closing). Projections, not guarantees.
Landlord ↔ Tenant lean methodology
- Overall (CITY)
- 0 Strongly Tenant-Friendly
- State New York
- 15 Strongly Tenant-Friendly · D+10
- County
- — inherits STATE
- City New York
- 0 Strongly Tenant-Friendly · D+34
ZIP-level market 11233
- Home prices YoY
- 2.9%
- Rents YoY
- 6.4%
- Active inventory
- 152
- Price-to-rent
- 59.7×
Monthly cashflow live
- Estimated rent
- $5,131 high interval (Pro) →
- Mortgage (P&I)
- −$6,424
- Tax from tax record
- −$497 /mo · $5,964/yr
- Insurance
- −$510
- Flood insurance flood zone
- −$66 /mo · $798/yr
- HOA
- −$0
- Vacancy / Maint / Mgmt
- −$1,078
- Net cashflow
- $-3,444
Break-even live
Sensitivity live
| Price | -10% $-2,751 | -5% $-3,098 | +0% $-3,444 | +5% $-3,791 | +10% $-4,138 |
|---|---|---|---|---|---|
| Rent | -10% $-3,850 | -5% $-3,647 | +0% $-3,444 | +5% $-3,242 | +10% $-3,039 |
| Rate | -1.0pp $-2,827 | -0.5pp $-3,133 | base $-3,444 | +0.5pp $-3,762 | +1.0pp $-4,085 |
3-unit breakdown (identical units grouped — click to expand)
| Units | Beds | Baths | Est. rent |
|---|---|---|---|
| 3× units | 3 | 1.7 | $5,130 |
| #1 | 3 | 1.7 | $1,710 |
| #2 | 3 | 1.7 | $1,710 |
| #3 | 3 | 1.7 | $1,710 |
| Total (3 units) | $5,131 | ||
UW: 25.0% down · 7.5% · 30yr · 1.5% tax · 5.0% vac · 8.0% maint · 8.0% mgmt
Financing live
Cash to close
- Down payment
- $306,250
- Closing costs
- $36,750
- Reserves months
- —
- Total cash needed
- —
Loan-product check · same deal, 3 products live
Conventional
25% down · 7.5% · 30yr
- Down + closing
- —
- Monthly P&I
- —
- Monthly cashflow
- —
- DSCR
- —
- Eligible?
- —
Personal DTI + credit; lowest rate.
DSCR
20% down · 8.5% · 30yr
- Down + closing
- —
- Monthly P&I
- —
- Monthly cashflow
- —
- DSCR
- —
- Eligible?
- —
No personal income docs; deal must DSCR.
Hard money
10% down · 12.0% · 12mo
- Down + closing
- —
- Monthly P&I
- —
- Monthly cashflow
- —
- DSCR
- —
- Eligible?
- —
Short-term bridge; refi at stabilization.
Listing history 10 events
-
2026-04-10status Pending
-
2026-01-02price $1,225,000
-
2025-10-07$1,275,000 Active
-
2017-07-05soldstatus $720,000
-
2016-02-08soldstatus $423,700
-
2014-01-24soldstatus $280,000
-
2005-04-08soldstatus $351,000
-
2005-03-29soldstatus $326,000
-
2002-04-17soldstatus $185,000
-
2002-04-17soldstatus $315,000
ⓘ Source: listings_history table (triggers on properties + properties_extension) + one-shot
backfill from property_details.listing_events for pre-trigger history.
Tax reassessment forecast NY · Partial reset (capped growth)
- Current annual tax
- $5,964 · $497/mo
- Projected year-2 tax
- $13,333 · $1,111/mo
- Expected delta
- +$7,369/yr (+$614/mo · 123.6%)
ⓘ Screening estimate from a state-policy table — verify with the county assessor before closing.
Climate risk First Street
- Flood 7/10 Severe FEMA zone X (unshaded) · 76% chance over 30 yrs
- Wildfire 1/10 Low
- Heat 6/10 Major 7 d/yr ≥99°F today · 15 d/yr by 30 yrs out
- Wind 6/10 Major 39% chance of damaging wind over 30 yrs
- Air quality 5/10 Major 6 unhealthy d/yr today · 8 by 30 yrs out
Nearby sold comps map
Loading sold comps map…
Walkable amenities ~0.75 mi
Loading nearby amenities…
Taxation est. · year 1
- Rental income
- $61,572
- − Mortgage interest
- −$68,619
- − Property taxes
- −$5,964
- − Insurance
- −$6,922
- − Repairs & maintenance
- −$4,926
- − Management
- −$4,926
- − Depreciation
- −$35,636
- Taxable loss
- −$65,421
- Est. tax savings @ 24.0%
- +$15,701
- After-tax cash flow
- $-25,632/yr
For passive investors: Depreciation is non-cash, so a rental often shows a tax loss while cash-flowing — sheltering income. Rental losses are passive: they offset passive income freely, and up to $25,000/yr can offset ordinary (W-2) income if you actively participate and your MAGI is under $100k (phasing out to $0 by $150k); unused losses carry forward. On sale, claimed depreciation is recaptured at up to 25%, and gains may owe capital-gains tax (a 1031 exchange can defer both). Figures are a year-1 estimate at your 24.0% rate — not tax advice; consult a CPA.
Schools (NCES district)
No district data.
Livability — New York
- Score
- 75/100
- State rank
- #268
- US rank
- #4188
Category grades
Schools grade is shown separately in the Schools card above.
Census & demographics
- Census place
- New York, NY
- County
- Kings County · 2,614,986 people
- City population
- 7,731,280
- Metro
- New York-Newark-Jersey City, NY-NJ-PA
- Population (ZIP)
- 81,822
- Household income
- $62,411
- Rent vs Own
- Severe rent burden
- 6960.0
Population outlook (Kings County) Hauer SSP2
- Today (2025)
- 2,847,441 people
- By 2030
- 2,937,006 · +3.1%
- By 2040
- 3,095,491 · +8.7%
- By 2050
- 3,228,968 · +13.4%
- By 2075
- 3,321,723 · +16.7%
- By 2100
- 3,111,387 · +9.3%
Race, ethnicity, and origin ACS 2023
- Neighborhood character
- Predominantly Black (65%)
- Race & ethnicity
- Black 65% Hispanic / Latino 16% White 12% Two or more races 8% Asian 2%
- Hispanic origin (detail)
- Puerto Rican 5% Dominican 5%
- Common ancestry
- Hispanic 1% Romanian 1% Lithuanian 1%
- Foreign-born
- 25% · Canada, Mexico, China
- Languages at home
- 80% English-only · Spanish 12% French/Haitian/Cajun 3% Other Indo-European 1%
Political lean MEDSL · Kings
- 2024 margin
- Solid D (+44.0) · D 72.0% · R 28.0%
- 2008→2024 swing
- -15.5pp toward R · 2008: 59.4pp · 2024: 44.0pp
- All cycles
- 2024: D+44.0 2020: D+54.8 2016: D+61.8 2012: D+63.9 2008: D+59.4
Not yet ingested
- Civics
- —
Market trends
- HPI YoY
- ▲ 18.31%
- Current HPI
- 645.4828
- Rent YoY
- ▲ 6.44%
- Metro
- New York-Newark-Jersey City, NY-NJ-PA
- State GDP YoY
- ▲ 2.60%
- F500 in state
- 92
Industry mix (Fortune 500 HQ in NY)
| Industry | F500 HQs | Revenue |
|---|---|---|
| Financial Services | 10 | $950B |
|
||
| Consumer Goods | 9 | $162B |
|
||
| Insurance | 4 | $225B |
|
||
| Telecommunications | 2 | $144B |
|
||
| Pharmaceuticals | 2 | $112B |
|
||
| Media / Entertainment | 2 | $69B |
|
||
Price history
+562.2% since first listed10 events — show timeline
- 2026-04-10 Pending — OneKey® MLS as Distributed by MLS Grid
- 2026-01-02 Price Changed $1,225,000 OneKey® MLS as Distributed by MLS Grid
- 2025-10-07 Listed $1,275,000 OneKey® MLS as Distributed by MLS Grid
- 2017-07-05 Sold (Public Records) $720,000 Public Records
- 2016-02-08 Sold (Public Records) $423,700 Public Records
- 2014-01-24 Sold (Public Records) $280,000 Public Records
- 2005-04-08 Sold (Public Records) $351,000 Public Records
- 2005-03-29 Sold (Public Records) $326,000 Public Records
- 2002-04-17 Sold (Public Records) $315,000 Public Records
- 2002-04-17 Sold (Public Records) $185,000 Public Records
Property tax history
+6.7%/yrLatest (2025): $5,964 · +1.3% YoY. Source: county tax records.
Cash-flow waterfall
monthlySold comps — $/sqft
last 12 mo · ≤1 miLoading sold comps…