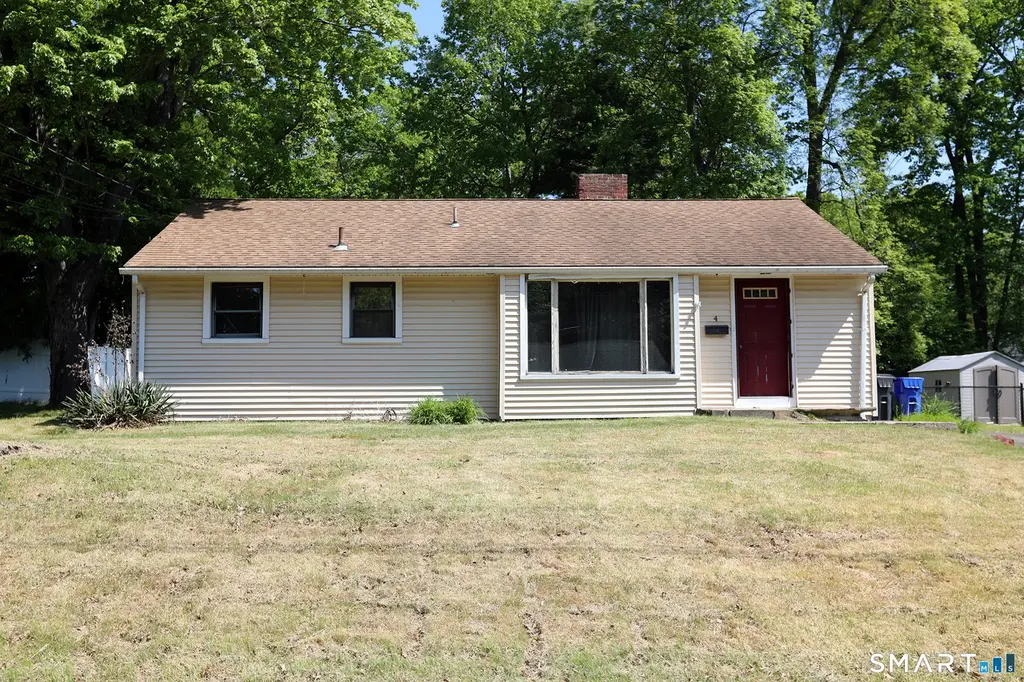
4 Woodside Dr · Blue Hills, CT
Flood risk No data
- FEMA flood zone
- —
- Chance of flooding over 30 yrs
- —
- Est. flood insurance / yr
- —
Fire risk No data
- Est. fire insurance / yr
- —
Heat risk No data
- Hot days now (above threshold)
- —
- Hot days in 30 yrs
- —
Wind risk No data
- Chance of severe wind over 30 yrs
- —
Air-quality risk No data
- Unhealthy air days now
- —
- Unhealthy air days in 30 yrs
- —
Risk factors via First Street. Map © Google.
Why this score? — see what drove the B+ grade
The composite is a weighted blend of 9 inputs, each scored 0–100. Each bar is that input's sub-score; the figure is the points it added to the 100-point composite (weight × sub-score).
- Cash flow +30.0/30.0
- ARV discount +15.0/15.0
- 1% rule +10.0/10.0
- DSCR +10.0/10.0
- Livability +4.0/5.0
- Rent growth +3.3/5.0
- Condition / age +2.5/5.0
- Schools +2.2/10.0
- Appreciation +0.0/10.0
$170,000
🖨 Deal sheet 📄 Offer letter ✓ Due diligence
Listing remarks
Bring your tools or your 203K loan and this home can be a GEM! This ranch in a desirable area of Bloomfield needs some work, but the bones are there. The water has been turned off, we think that perhaps the pipes burst and that is what cause the warping in the floors. This home will not qualify for government financing. Please be careful where you step. Subject to Probate Court Approval.
Key facts
- 0.23 acre lot
- 4 parking spots
- Built 1954
Property features AI
Finance
- Financial info: Assessed value listed
Exterior
- Parking: Driveway; 4 total parking spaces
- Utilities: Public water connected; Public sewer connected; Oil tank located in basement
- Home design: Single-family home
- Construction: Built with frame construction; Vinyl siding; Shingle roof; Concrete foundation
- Exterior features: Level lot; Private driveway
Interior
- Kitchen: Oven/Range; Refrigerator
- Bedrooms: 3 bedrooms
- Bathrooms: 1 full bathroom
- Heating & cooling: Hot water heat (oil-fired); Hot water heater described as 'Other'
- Interior features: One fireplace; Crawl space basement with interior access (unfinished)
Neighborhood map
What this means for you Summary
Snapshot
- This is a 3-bed/1.0-bath single-family listed at $170k.
Deal economics
- At list price, monthly cash flow is $700 ($8k/yr) — positive.
- The deal already cash-flows at list — no discount required.
- Meets the 1% rule at list price ($3k rent vs $170k).
Location & tenants
- Location reads 81/100 on livability (#14 in CT, #1,343 nationally) — a professional / high-income tenant draw. Strengths: crime A+, commute A+, housing A+; Watch: schools F, amenities F.
- Bloomfield School District (suburban): math 16% / reading 30% proficiency, ranked #137 of 153 in CT (top 90%) — low school quality limits family demand, transient renter base, plan for 1-2y turnover.
- Market conditions: Rents rising (+3.1%/yr); 64 active listings in the ZIP; 4 comparable units currently listed for rent nearby; rentals lingering (median 44d on market — plan ~5-8 weeks vacancy on turnover, expect pricing pressure); 75% of comp listings sitting > 30 days — soft ceiling on asking rent; solid renter incomes; 1,867 units permitted in Capitol Planning Region in 2024 (1,399 in 5+ unit buildings).
- This rent runs 33% of the median local income ($98k/yr) — at the standard rent-burdened threshold; future hikes will face affordability resistance.
Forward outlook
- Local home prices are declining (-3.0%/yr); year-one equity from $1k of loan paydown is wiped out by about $5k of value loss. Plan a longer hold.
- At projected returns (-3.0% appreciation + 3.1% rent growth), your $48k cash investment doubles in ~7 years — after that, you're playing with house money.
Negotiation context
- Only 7 days on market — expect competitive offers; lowballing is unlikely to land.
Risks & watch-outs
- Watch-outs: property tax is 3.5% of price; built in 1954 — expect roof / HVAC / electrical / plumbing capex.
Questions for the listing agent
- Built in 1954 — when were the roof, HVAC, electrical panel, plumbing, and water heater last replaced?
- Property tax is high relative to price — has the assessment been appealed recently, and will the sale trigger a re-assessment?
- Is there a deadline driving the sale (1031 exchange, divorce, estate, relocation)? That informs how much negotiation room exists.
- Schools are F-rated, which usually means shorter tenancies and higher turnover. Who's the typical renter profile here, and what's been the actual vacancy rate?
- What's the average days-on-market for RENTAL listings here right now (not sales)? A rising rental-DOM trend means longer vacancies and softer asking-rent achievability than the comps imply.
- What's the recent tenant-quality profile in this submarket — average credit score on applications, eviction rate, late-payment / NSF rate, and stable-employment percentage? A property-management company in the area should have these aggregated.
- How much new for-sale + rental construction is in the pipeline within 1–3 miles? Heavy new supply typically softens prices + rents 12–24 months out; constrained supply supports both.
Investment metrics
- 1% rule
- 1.61% ✓
- Cap rate
- 11.23%
- Cash-on-cash
- 17.64%
- DSCR
- 1.78
- GRM
- 5.2
CMA / ARV
- ARV (on-the-fly)
- $265,398
- Comps found
- 12
Show comp detail 12 sales within ~0.75 mi
| Address | Dist | Beds/Ba | Sqft | Sold | Price | $/sf | Match |
|---|---|---|---|---|---|---|---|
| 91 Ellsworth Dr | 0.11mi | 3/1.0 | 984 (-1%) | 2mo | $300,000 | $305 | 92 |
| 23 Farmstead Cir | 0.18mi | 3/1.0 | 1,008 (+1%) | 2mo | $245,000 | $243 | 87 |
| 31 Farmstead Cir | 0.16mi | 3/1.0 | 1,008 (+1%) | 4mo | $255,000 | $253 | 87 |
| 70 Ellsworth Dr | 0.10mi | 3/1.0 | 984 (-1%) | 10mo | $295,000 | $300 | 85 |
| 80 Ellsworth Dr | 0.05mi | 3/1.0 | 984 (-1%) | 19mo | $275,000 | $279 | 80 |
| 62 Shields Dr | 0.18mi | 3/1.0 | 994 (0%) | 19mo | $265,000 | $267 | 76 |
| 30 Banfield Ln | 0.09mi | 3/1.5 | 1,100 (+11%) | 7mo | $325,000 | $295 | 70 |
| 15 Kelsey Pl | 0.15mi | 3/1.0 | 1,140 (+15%) | 6mo | $275,000 | $241 | 64 |
| 25 Beatrice Ave | 0.58mi | 3/1.0 | 994 (0%) | 17mo | $127,500 | $128 | 58 |
| 15 Woodford Dr | 0.64mi | 2/2.0 (-1) | 1,000 (+1%) | 14mo | $275,000 | $275 | 49 |
| 10 Woodford Dr | 0.66mi | 3/1.5 | 1,083 (+9%) | 16mo | $267,000 | $247 | 39 |
| 26 Pine Grove Rd | 0.50mi | 4/1.0 (+1) | 1,138 (+14%) | 15mo | $294,000 | $258 | 35 |
Match score weights: distance 35% · size 25% · config 20% · recency 20%. Top-matched comps best support the ARV.
Projected returns pro-forma
-3.0% appreciation · 3.11% rent growth · sell at horizon
- IRR
- 9.3%
- Equity multiple
- 1.37×
- Total profit
- $17,544
- Equity at exit
- $25,348
- IRR
- 18.7%
- Equity multiple
- 2.57×
- Total profit
- $74,804
- Equity at exit
- $14,698
Cash invested: $47,600 (down + closing). Projections, not guarantees.
Landlord ↔ Tenant lean methodology
- Overall (STATE)
- 27 Tenant-Leaning
- State Connecticut
- 27 Tenant-Leaning · D+7
- County
- — inherits STATE
- City
- — inherits STATE
ZIP-level market 06002
- Rents YoY
- 3.1%
- Active inventory
- 64
- Price-to-rent
- 5.2×
Monthly cashflow live
- Estimated rent
- $2,739 medium interval (Pro) →
- Mortgage (P&I)
- −$891
- Tax from tax record
- −$501 /mo · $6,017/yr
- Insurance
- −$71
- HOA
- −$0
- Vacancy / Maint / Mgmt
- −$575
- Net cashflow
- $700
Break-even live
UW: 25.0% down · 7.5% · 30yr · 1.5% tax · 5.0% vac · 8.0% maint · 8.0% mgmt
Financing live
Cash to close
- Down payment
- $42,500
- Closing costs
- $5,100
- Reserves months
- —
- Total cash needed
- —
Loan-product check · same deal, 3 products live
Conventional
25% down · 7.5% · 30yr
- Down + closing
- —
- Monthly P&I
- —
- Monthly cashflow
- —
- DSCR
- —
- Eligible?
- —
Personal DTI + credit; lowest rate.
DSCR
20% down · 8.5% · 30yr
- Down + closing
- —
- Monthly P&I
- —
- Monthly cashflow
- —
- DSCR
- —
- Eligible?
- —
No personal income docs; deal must DSCR.
Hard money
10% down · 12.0% · 12mo
- Down + closing
- —
- Monthly P&I
- —
- Monthly cashflow
- —
- DSCR
- —
- Eligible?
- —
Short-term bridge; refi at stabilization.
Rent comps 4 comps
| Address | Beds | Baths | Sqft | Rent | $/sqft | DOM | Units | Dist |
|---|---|---|---|---|---|---|---|---|
| 31 Forest Ln Bloomfield, CT | 4.0 | 1.5 | 1004 | $3,200 | $3.19 | 3d | 1 | 0.38mi |
| 1 Camelot Dr #2 Bloomfield, CT | 2.0 | 1.5 | 1088 | $2,500 | $2.30 | 43d | 1 | 0.56mi |
| 22 Wedgewood Dr Bloomfield, CT | 2.0 | 1.5 | 1113 | $2,100 | $1.89 | 43d | 1 | 0.63mi |
| 3 Camelot Dr #4 Bloomfield, CT | 2.0 | 1.5 | 1100 | $1,975 | $1.80 | 43d | 1 | 0.66mi |
Listing history 4 events
-
2026-06-02statusdays on market $170,000 Under Contract 7 DOM
-
2026-06-01days on market $170,000 Active 6 DOM
-
2026-05-31days on market $170,000 Active 5 DOM
-
2026-05-26$170,000 Active
ⓘ Source: listings_history table (triggers on properties + properties_extension) + one-shot
backfill from property_details.listing_events for pre-trigger history.
Tax reassessment forecast CT · Partial reset (capped growth)
- Current annual tax
- $6,017 · $501/mo
- Projected year-2 tax
- $6,017 · $501/mo
- Expected delta
- $0/yr ($0/mo · 0.0%)
ⓘ Screening estimate from a state-policy table — verify with the county assessor before closing.
Nearby sold comps map
Loading sold comps map…
Walkable amenities ~0.75 mi
Loading nearby amenities…
Taxation est. · year 1
- Rental income
- $32,864
- − Mortgage interest
- −$9,523
- − Property taxes
- −$6,017
- − Insurance
- −$850
- − Repairs & maintenance
- −$2,629
- − Management
- −$2,629
- − Depreciation
- −$4,945
- Taxable income
- $6,270
- Est. tax owed @ 24.0%
- −$1,505
- After-tax cash flow
- $6,892/yr
For passive investors: Depreciation is non-cash, so a rental often shows a tax loss while cash-flowing — sheltering income. Rental losses are passive: they offset passive income freely, and up to $25,000/yr can offset ordinary (W-2) income if you actively participate and your MAGI is under $100k (phasing out to $0 by $150k); unused losses carry forward. On sale, claimed depreciation is recaptured at up to 25%, and gains may owe capital-gains tax (a 1031 exchange can defer both). Figures are a year-1 estimate at your 24.0% rate — not tax advice; consult a CPA.
Schools (NCES district)
- District
- Bloomfield School District
- NCES district ID
- 0900330
- Math proficiency
- 16% ▼ -13.00%
- Reading proficiency
- 30% ▼ -12.00%
- Median HH income
- $71,180
- Composite
- 22.37/100
- National rank
- #8120
- State rank
- #137 of 153 in CT
Livability — Blue Hills
- Score
- 81/100
- State rank
- #14
- US rank
- #1343
Category grades
Schools grade is shown separately in the Schools card above.
Census & demographics
- County
- Hartford County · 754,208 people
- Metro
- Hartford-East Hartford-Middletown, CT
- Population (ZIP)
- 21,865
- Household income
- $98,162
- Rent vs Own
- Severe rent burden
- 692.0
Population outlook (Capitol County) Hauer SSP2
- By 2040
- 1,063,519
Race, ethnicity, and origin ACS 2023
- Neighborhood character
- Diverse neighborhood (Simpson 0.61)
- Race & ethnicity
- Black 54% White 30% Hispanic / Latino 8% Two or more races 6% Asian 4%
- Hispanic origin (detail)
- Puerto Rican 4%
- Common ancestry
- Romanian 2% Lithuanian 2% Scotch-Irish 2%
- Foreign-born
- 25% · Canada, Vietnam, China
- Languages at home
- 82% English-only · Spanish 6% Other Indo-European 2% French/Haitian/Cajun 2%
Political lean MEDSL · Capitol
- 2024 margin
- Strong D (+21.9) · D 60.1% · R 38.2% · Other 1.7%
- All cycles
- 2024: D+21.9
Not yet ingested
- Civics
- —
Market trends
- HPI YoY
- ▼ -175.76%
- Current HPI
- 198.4604
- Rent YoY
- ▲ 3.11%
- Metro
- Hartford-East Hartford-Middletown, CT
- State GDP YoY
- ▲ 1.06%
- F500 in state
- 38
Industry mix (Fortune 500 HQ in CT)
| Industry | F500 HQs | Revenue |
|---|---|---|
| Industrial Machinery | 4 | $38B |
|
||
| Insurance | 3 | $71B |
|
||
| Financial Services | 2 | $25B |
|
||
| Transportation / Logistics | 2 | $18B |
|
||
| Healthcare | 1 | $247B |
|
||
| Telecommunications | 1 | $55B |
|
||
Price history
1 event — show timeline
- 2026-05-26 Listed $170,000 Smart MLS
Property tax history
+4.1%/yrLatest (2025): $6,017 · +51.1% YoY. Source: county tax records.
Cash-flow waterfall
monthlySold comps — $/sqft
last 12 mo · ≤1 miLoading sold comps…