1522 Kraft Ave · Cedar Grove, FL
Flood risk 1/10 · Minimal
- FEMA flood zone
- X (unshaded)
- Chance of flooding over 30 yrs
- 0.0%
- Est. flood insurance / yr
- $507 – $1,088
Fire risk 5/10 · Moderate
- Est. fire insurance / yr
- $947 – $1,759
Heat risk 10/10 · Severe
- Hot days now (above 105°F)
- 7 days/yr
- Hot days in 30 yrs
- 21 days/yr
Wind risk 9/10 · Severe
- Chance of severe wind over 30 yrs
- 99.0%
Air-quality risk 1/10 · Minimal
- Unhealthy air days now
- 0 days/yr
- Unhealthy air days in 30 yrs
- 0 days/yr
Risk factors via First Street. Map © Google.
Why this score? — see what drove the B- grade
The composite is a weighted blend of 9 inputs, each scored 0–100. Each bar is that input's sub-score; the figure is the points it added to the 100-point composite (weight × sub-score).
- Cash flow +25.1/30.0
- ARV discount +15.0/15.0
- DSCR +8.2/10.0
- 1% rule +5.5/10.0
- Schools +4.3/10.0
- Livability +3.5/5.0
- Rent growth +2.8/5.0
- Condition / age +2.5/5.0
- Appreciation +0.0/10.0
$134,900
🖨 Deal sheet 📄 Offer letter ✓ Due diligence
Listing remarks
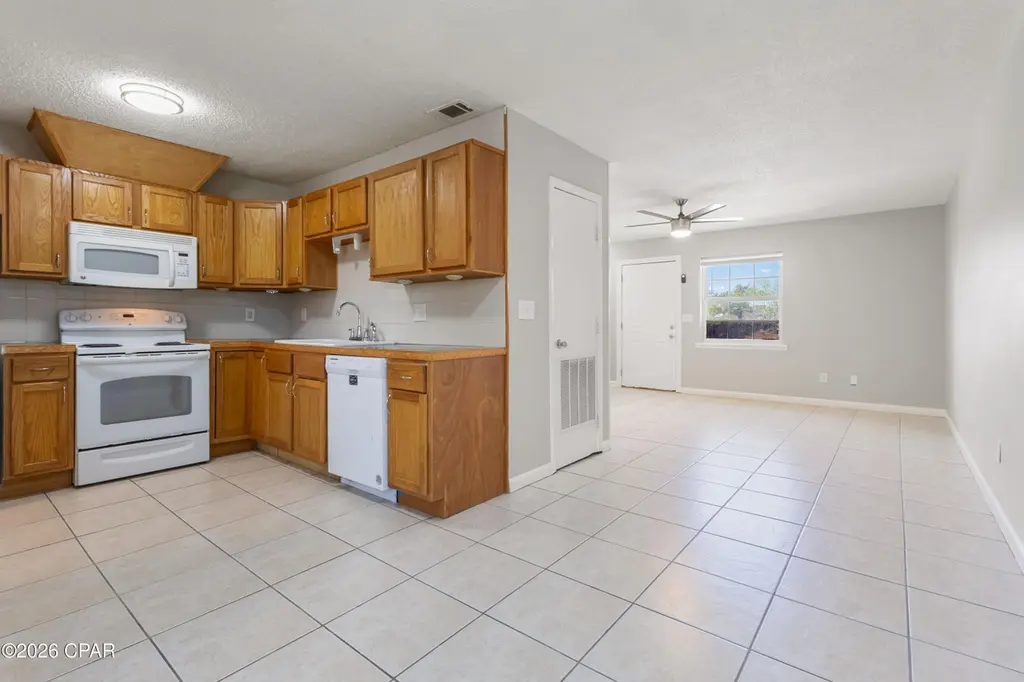
Welcome to 1522 Kraft Avenue in Panama City; a beautifully renovated home that combines modern updates with everyday convenience. This property has been thoughtfully upgraded with brand-new flooring, fresh drywall throughout, completely updated bathrooms, and more, offering a clean and move-in-ready experience. Ideally located, you'll enjoy quick access to grocery stores, restaurants, schools, and shopping, making daily errands simple and efficient. Whether you're heading to work, grabbing a bite, or enjoying everything the area has to offer, this location keeps you close to it all. If you're looking for a updated home in a convenient location, this one checks all the boxes.
Key facts
- Fresh drywall
- Renovated home
- New flooring
Tags
Property features AI
Finance
- HOA & community: Short-term rentals allowed
Exterior
- Parking: Paved parking
- Utilities: Electricity available; Public sewer
- Home design: Single-family residence
- Construction: Composition/shingle roof; Mobile home dimensions recorded in feet
- Exterior features: Paved parking; City street frontage; Publicly maintained road; Zoned for single-family residential
Interior
- Kitchen: Electric cooktop; Electric oven
- Bedrooms: Primary bedroom on second level; Additional bedroom on second level
- Bathrooms: 1 full bathroom; 1 half bathroom
- Heating & cooling: Central heating (electric); Central air conditioning
- Interior features: Two total rooms
- Laundry & utility: Electric water heater
Neighborhood map
What this means for you Summary
Snapshot
- This is a 2-bed/2.0-bath townhouse listed at $135k.
Deal economics
- At list price, monthly cash flow is $298 ($4k/yr) — positive.
- The deal already cash-flows at list — no discount required.
- Meets the 1% rule at list price ($1k rent vs $135k).
- Recommended offer: $131k (3.0% below list) — sets the bar for market timing.
Location & tenants
- Location reads 70/100 on livability (#445 in FL) — a middle-class / working-renter tenant base. Strengths: cost of living A+, housing A+, crime A; Watch: employment C-, schools F, amenities F.
- Bay (suburban): math 51% / reading 51% proficiency, ranked #29 of 73 in FL (top 40%) — acceptable for families but not a draw, mixed tenant base, ~2y average lease.
- Market conditions: Rents rising (+1.2%/yr); 381 active listings in the ZIP; 7 comparable units currently listed for rent nearby; rentals at typical pace (median 21d on market — plan ~3-4 weeks tenant-placement turnaround); 2,473 units permitted in Bay County in 2024 (559 in 5+ unit buildings).
Forward outlook
- Local home prices are declining (-3.0%/yr); year-one equity from $933 of loan paydown is wiped out by about $4k of value loss. Plan a longer hold.
- Bay County population projected at +24% by 2050 — long-run rental-demand tailwind backs the buy-and-hold thesis.
Negotiation context
- It's been on market 59 days — a 3% lower offer ($131k) is reasonable based on typical stale-listing flexibility.
- 4 sale attempts since 3y ago with the ask held roughly flat each time — persistent listings suggest the price (not the market) is what's stuck; bring a comps-based counter.
- Current owner paid $39k; list at $135k implies a 247% gain — meaningful room to come down on a strong offer.
Risks & watch-outs
- Climate carrying-cost: severe wind risk, 99% chance of damaging wind over 30y; moderate wildfire risk; extreme-heat days projected 7→21/yr by 2055 (HVAC capex compounding) — expect insurance premiums to compound above CPI over the hold.
Questions for the listing agent
- It's been on market 59 days. Have you received any prior offers? Is the seller open to a 3% concession, seller financing, or rate buy-down credit?
- Is there a deadline driving the sale (1031 exchange, divorce, estate, relocation)? That informs how much negotiation room exists.
- Schools are F-rated, which usually means shorter tenancies and higher turnover. Who's the typical renter profile here, and what's been the actual vacancy rate?
- What's the average days-on-market for RENTAL listings here right now (not sales)? A rising rental-DOM trend means longer vacancies and softer asking-rent achievability than the comps imply.
- What's the recent tenant-quality profile in this submarket — average credit score on applications, eviction rate, late-payment / NSF rate, and stable-employment percentage? A property-management company in the area should have these aggregated.
- How much new for-sale + rental construction is in the pipeline within 1–3 miles? Heavy new supply typically softens prices + rents 12–24 months out; constrained supply supports both.
Investment metrics
- 1% rule
- 1.05% ✓
- Cap rate
- 8.95%
- Cash-on-cash
- 9.48%
- DSCR
- 1.42
- GRM
- 8.0
CMA / ARV
- ARV (on-the-fly)
- $184,680
- Comps found
- 1
Show comp detail 1 sale within ~0.75 mi
| Address | Dist | Beds/Ba | Sqft | Sold | Price | $/sf | Match |
|---|---|---|---|---|---|---|---|
| 2716 Oak Hammock Dr | 0.68mi | 3/2.0 (+1) | 1,040 (+1%) | 24mo | $187,000 | $180 | 41 |
Match score weights: distance 35% · size 25% · config 20% · recency 20%. Top-matched comps best support the ARV.
Projected returns pro-forma
-3.0% appreciation · 1.24% rent growth · sell at horizon
- IRR
- -3.9%
- Equity multiple
- 0.86×
- Total profit
- $-5,360
- Equity at exit
- $20,114
- IRR
- 3.9%
- Equity multiple
- 1.26×
- Total profit
- $9,872
- Equity at exit
- $11,664
Cash invested: $37,772 (down + closing). Projections, not guarantees.
Landlord ↔ Tenant lean methodology
- Overall (STATE)
- 87 Strongly Landlord-Friendly
- State Florida
- 87 Strongly Landlord-Friendly · R+3
- County
- — inherits STATE
- City
- — inherits STATE
ZIP-level market 32405
- Rents YoY
- 1.2%
- Active inventory
- 381
- Price-to-rent
- 8.0×
Monthly cashflow live
- Estimated rent
- $1,412 high interval (Pro) →
- Mortgage (P&I)
- −$707
- Tax from tax record
- −$53 /mo · $639/yr
- Insurance
- −$56
- HOA
- −$0
- Vacancy / Maint / Mgmt
- −$296
- Net cashflow
- $298
Break-even live
UW: 25.0% down · 7.5% · 30yr · 1.5% tax · 5.0% vac · 8.0% maint · 8.0% mgmt
Financing live
Cash to close
- Down payment
- $33,725
- Closing costs
- $4,047
- Reserves months
- —
- Total cash needed
- —
Loan-product check · same deal, 3 products live
Conventional
25% down · 7.5% · 30yr
- Down + closing
- —
- Monthly P&I
- —
- Monthly cashflow
- —
- DSCR
- —
- Eligible?
- —
Personal DTI + credit; lowest rate.
DSCR
20% down · 8.5% · 30yr
- Down + closing
- —
- Monthly P&I
- —
- Monthly cashflow
- —
- DSCR
- —
- Eligible?
- —
No personal income docs; deal must DSCR.
Hard money
10% down · 12.0% · 12mo
- Down + closing
- —
- Monthly P&I
- —
- Monthly cashflow
- —
- DSCR
- —
- Eligible?
- —
Short-term bridge; refi at stabilization.
Rent comps 7 comps
| Address | Beds | Baths | Sqft | Rent | $/sqft | DOM | Units | Dist |
|---|---|---|---|---|---|---|---|---|
| 1637 N James Ave Panama City, FL | 2.0 | 1.5 | 972 | $1,275 | $1.31 | 21d | 1 | 0.20mi |
| 2623 E 16th St Unit A Panama City, FL | 3.0 | 2.0 | 1250 | $1,625 | $1.30 | 21d | 1 | 0.27mi |
| 1401 Transmitter Rd Unit 15 Panama City, FL | 3.0 | 2.0 | 1100 | $1,395 | $1.27 | 13d | 1 | 0.82mi |
| 3719 E 8th Ct Panama City, FL | 1.0–4.0 | 1.0–1.5 | 950 | $1,100 | $1.16 | 21d | 1 | 0.99mi |
| 725 Sherman Ave Unit B Panama City, FL | 3.0 | 1.0 | 878 | $1,250 | $1.42 | 21d | 1 | 1.19mi |
| 3914 E 11th St #301 Panama City, FL | 2.0 | 2.0 | 864 | $1,000 | $1.16 | 21d | 1 | 1.20mi |
| 906 Kevin Ct Panama City, FL | 3.0 | 2.0 | 1266 | $1,795 | $1.42 | 21d | 1 | 1.45mi |
Listing history 32 events
-
2026-06-19days on market $134,900 Active 59 DOM
-
2026-06-18days on market $134,900 Active 58 DOM
-
2026-06-17days on market $134,900 Active 57 DOM
-
2026-06-16days on market $134,900 Active 56 DOM
-
2026-06-15days on market $134,900 Active 55 DOM
-
2026-06-14days on market $134,900 Active 53 DOM
-
2026-06-13days on market $134,900 Active 52 DOM
-
2026-06-10days on market $134,900 Active 50 DOM
-
2026-06-09days on market $134,900 Active 49 DOM
-
2026-06-08days on market $134,900 Active 48 DOM
-
2026-06-07days on market $134,900 Active 47 DOM
-
2026-06-05days on market $134,900 Active 44 DOM
-
2026-06-03days on market $134,900 Active 43 DOM
-
2026-06-02days on market $134,900 Active 42 DOM
-
2026-06-01days on market $134,900 Active 41 DOM
-
2026-05-31days on market $134,900 Active 40 DOM
-
2026-05-30days on market $134,900 Active 39 DOM
-
2026-05-21status Active
-
2026-05-07status Pending
-
2026-05-04price $134,900
-
2026-04-06$139,900 Active
-
2026-03-31historical
-
2026-01-21price $139,999
-
2025-10-29price $118,999
-
2025-09-16$120,000 Active
-
2023-10-15historical $1,150
-
2023-10-06$1,150
-
2020-03-09soldstatus $38,923
-
2008-07-17soldstatus $114,000
-
2004-11-04soldstatus $44,000
-
1998-10-01soldstatus $47,000
-
1990-03-01soldstatus $30,600
ⓘ Source: listings_history table (triggers on properties + properties_extension) + one-shot
backfill from property_details.listing_events for pre-trigger history.
Tax reassessment forecast FL · Resets to sale price
- Current annual tax
- $639 · $53/mo
- Projected year-2 tax
- $1,120 · $93/mo
- Expected delta
- +$481/yr (+$40/mo · 75.3%)
ⓘ Screening estimate from a state-policy table — verify with the county assessor before closing.
Climate risk First Street
- Flood 1/10 Low FEMA zone X (unshaded) · 0% chance over 30 yrs
- Wildfire 5/10 Major
- Heat 10/10 Extreme 7 d/yr ≥105°F today · 21 d/yr by 30 yrs out
- Wind 9/10 Extreme 99% chance of damaging wind over 30 yrs
- Air quality 1/10 Low 0 unhealthy d/yr today · 0 by 30 yrs out
Nearby sold comps map
Loading sold comps map…
Walkable amenities ~0.75 mi
Loading nearby amenities…
Taxation est. · year 1
- Rental income
- $16,941
- − Mortgage interest
- −$7,556
- − Property taxes
- −$639
- − Insurance
- −$674
- − Repairs & maintenance
- −$1,355
- − Management
- −$1,355
- − Depreciation
- −$3,924
- Taxable income
- $1,436
- Est. tax owed @ 24.0%
- −$345
- After-tax cash flow
- $3,236/yr
For passive investors: Depreciation is non-cash, so a rental often shows a tax loss while cash-flowing — sheltering income. Rental losses are passive: they offset passive income freely, and up to $25,000/yr can offset ordinary (W-2) income if you actively participate and your MAGI is under $100k (phasing out to $0 by $150k); unused losses carry forward. On sale, claimed depreciation is recaptured at up to 25%, and gains may owe capital-gains tax (a 1031 exchange can defer both). Figures are a year-1 estimate at your 24.0% rate — not tax advice; consult a CPA.
Schools (NCES district)
- District
- Bay
- NCES district ID
- 1200090
- Math proficiency
- 51% ▼ -8.00%
- Reading proficiency
- 51% ▼ -7.00%
- Median HH income
- $47,740
- Composite
- 43.41/100
- National rank
- #3014
- State rank
- #29 of 73 in FL
Livability — Cedar Grove
- Score
- 70/100
- State rank
- #445
- US rank
- #8018
Category grades
Schools grade is shown separately in the Schools card above.
Census & demographics
- Census place
- Cedar Grove, FL
- County
- Bay County · 163,593 people
- Metro
- Panama City, FL
- Population (ZIP)
- 29,984
- Household income
- $73,373
- Rent vs Own
- Severe rent burden
- 1008.0
Population outlook (Bay County) Hauer SSP2
- Today (2025)
- 206,264 people
- By 2030
- 217,740 · +5.6%
- By 2040
- 238,738 · +15.7%
- By 2050
- 255,545 · +23.9%
- By 2075
- 288,295 · +39.8%
- By 2100
- 288,638 · +39.9%
Race, ethnicity, and origin ACS 2023
- Neighborhood character
- Predominantly White (67%)
- Race & ethnicity
- White 67% Black 17% Two or more races 8% Hispanic / Latino 7% Native American 1%
- Hispanic origin (detail)
- Mexican 2% Puerto Rican 3%
- Common ancestry
- Slovak 4% Lithuanian 2% Romanian 2%
- Foreign-born
- 7% · Canada
- Languages at home
- 89% English-only · Spanish 6% Arabic 1% French/Haitian/Cajun 1%
Political lean MEDSL · Bay
- 2024 margin
- Solid R (+47.4) · D 25.8% · R 73.1% · Other 1.1%
- 2008→2024 swing
- -6.6pp toward R · 2008: -40.7pp · 2024: -47.4pp
- All cycles
- 2024: R+47.4 2020: R+43.5 2016: R+46.3 2012: R+43.6 2008: R+40.7
Not yet ingested
- Civics
- —
Market trends
- HPI YoY
- ▼ -217.88%
- Current HPI
- 262.7854
- Rent YoY
- ▲ 1.24%
- Metro
- Panama City, FL
- State GDP YoY
- ▲ 3.28%
- F500 in state
- 36
Industry mix (Fortune 500 HQ in FL)
| Industry | F500 HQs | Revenue |
|---|---|---|
| Industrial Technology | 2 | $29B |
|
||
| Insurance | 2 | $17B |
|
||
| Retail | 1 | $60B |
|
||
| Technology Distribution | 1 | $58B |
|
||
| Homebuilding | 1 | $35B |
|
||
| Technology Manufacturing | 1 | $35B |
|
||
Price history
+340.8% since first listed15 events — show timeline
- 2026-05-21 Relisted — CPARMLS
- 2026-05-07 Pending — CPARMLS
- 2026-05-04 Price Changed $134,900 CPARMLS
- 2026-04-06 Listed $139,900 CPARMLS
- 2026-03-31 Listing Removed — CPARMLS
- 2026-01-21 Price Changed $139,999 CPARMLS
- 2025-10-29 Price Changed $118,999 CPARMLS
- 2025-09-16 Listed $120,000 CPARMLS
- 2023-10-15 Rental Removed $1,150 APPFOLIO
- 2023-10-06 Listed for Rent $1,150 APPFOLIO
- 2020-03-09 Sold (Public Records) $38,923 Public Records
- 2008-07-17 Sold (Public Records) $114,000 Public Records
- 2004-11-04 Sold (Public Records) $44,000 Public Records
- 1998-10-01 Sold (Public Records) $47,000 Public Records
- 1990-03-01 Sold (Public Records) $30,600 Public Records
Property tax history
+7.0%/yrLatest (2025): $639 · +9.3% YoY. Source: county tax records.
Cash-flow waterfall
monthlySold comps — $/sqft
last 12 mo · ≤1 miLoading sold comps…