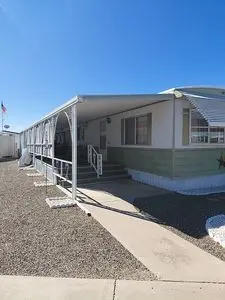
900 N San Marcos Dr · Apache Junction, AZ
Flood risk 1/10 · Minimal
- FEMA flood zone
- X (shaded)
- Chance of flooding over 30 yrs
- 0.0%
- Est. flood insurance / yr
- $507 – $1,088
Fire risk 6/10 · Moderate
- Est. fire insurance / yr
- $610 – $1,132
Heat risk 8/10 · Major
- Hot days now (above 111°F)
- 4 days/yr
- Hot days in 30 yrs
- 10 days/yr
Wind risk 1/10 · Minimal
- Chance of severe wind over 30 yrs
- —
Air-quality risk 3/10 · Minor
- Unhealthy air days now
- 2 days/yr
- Unhealthy air days in 30 yrs
- 3 days/yr
Risk factors via First Street. Map © Google.
Why this score? — see what drove the C+ grade
The composite is a weighted blend of 9 inputs, each scored 0–100. Each bar is that input's sub-score; the figure is the points it added to the 100-point composite (weight × sub-score).
- Cash flow +30.0/30.0
- 1% rule +10.0/10.0
- DSCR +10.0/10.0
- ARV discount +4.7/15.0
- Livability +3.3/5.0
- Condition / age +2.5/5.0
- Rent growth +1.6/5.0
- Schools +1.5/10.0
- Appreciation +0.0/10.0
$50,000
🖨 Deal sheet 📄 Offer letter ✓ Due diligence
Listing remarks
14x70 2 bdrm 1 bth. Large living room and kitchen open plan with bar. Large master bdrm and good size 2nd bdrm. Double windows. Partially furnished. All appliances stay. Newer heat pump works great. Large covered porch and drive way. Two sheds with electric. Very nice for it& apos; s age. Low lot rent. Bring your offer or questions
Key facts
- Double windows
- Large covered porch
- Large living room
Tags
Neighborhood map
What this means for you Summary
Snapshot
- This is a 2-bed/1.0-bath manufactured listed at $50k.
Deal economics
- At list price, monthly cash flow is $929 ($11k/yr) — positive.
- The deal already cash-flows at list — no discount required.
- Meets the 1% rule at list price ($2k rent vs $50k).
- Recommended offer: $49k (1.5% below list) — sets the bar for market timing.
- Cap rate 28.6% vs local median 3.5% in Apache Junction — top-decile yield for the area; either an underpriced asset or a hidden risk that comps aren't pricing in. Stress-test before assuming the spread holds.
Location & tenants
- Location reads 66/100 on livability (#70 in AZ) — a middle-class / working-renter tenant base. Strengths: cost of living A+, housing A+; Watch: crime D+, schools F, amenities F.
- Apache Junction Unified District (4443) (suburban): math 15% / reading 20% proficiency, ranked #195 of 249 in AZ (top 78%) — low school quality limits family demand, transient renter base, plan for 1-2y turnover.
- Market conditions: Rents falling (-3.5%/yr); 455 active listings in the ZIP; 10 comparable units currently listed for rent nearby; rentals at typical pace (median 24d on market — plan ~3-4 weeks tenant-placement turnaround); 9,504 units permitted in Pinal County in 2024 (776 in 5+ unit buildings).
- This rent runs 34% of the median local income ($58k/yr) — at the standard rent-burdened threshold; future hikes will face affordability resistance.
Forward outlook
- Local home prices are declining (-3.0%/yr); year-one equity from $346 of loan paydown is wiped out by about $2k of value loss. Plan a longer hold.
- At projected returns (-3.0% appreciation + 0.0% rent growth), your $14k cash investment doubles in ~2 years — after that, you're playing with house money.
Negotiation context
- It's been on market 23 days — a 2% lower offer ($49k) is reasonable based on typical stale-listing flexibility.
Risks & watch-outs
- Climate carrying-cost: major wildfire risk; extreme-heat days projected 4→10/yr by 2055 (HVAC capex compounding) — expect insurance premiums to compound above CPI over the hold.
Questions for the listing agent
- Built in 1977 — when were the roof, HVAC, electrical panel, plumbing, and water heater last replaced?
- Is there a deadline driving the sale (1031 exchange, divorce, estate, relocation)? That informs how much negotiation room exists.
- Schools are F-rated, which usually means shorter tenancies and higher turnover. Who's the typical renter profile here, and what's been the actual vacancy rate?
- Crime grade is D in this area — have there been break-ins, vandalism, or insurance claims at this property in the last 3 years? What carrier currently insures it and at what premium?
- What's the average days-on-market for RENTAL listings here right now (not sales)? A rising rental-DOM trend means longer vacancies and softer asking-rent achievability than the comps imply.
- What's the recent tenant-quality profile in this submarket — average credit score on applications, eviction rate, late-payment / NSF rate, and stable-employment percentage? A property-management company in the area should have these aggregated.
- How much new for-sale + rental construction is in the pipeline within 1–3 miles? Heavy new supply typically softens prices + rents 12–24 months out; constrained supply supports both.
Investment metrics
- 1% rule
- 3.23% ✓
- Cap rate
- 28.60%
- Cash-on-cash
- 79.65%
- DSCR
- 4.54
- GRM
- 2.6
CMA / ARV
- ARV (on-the-fly)
- $47,040
- Comps found
- 12
Show comp detail 12 sales within ~0.75 mi
| Address | Dist | Beds/Ba | Sqft | Sold | Price | $/sf | Match |
|---|---|---|---|---|---|---|---|
| 900 N San Marcos Dr #95 | 0.03mi | 2/1.0 | 980 (0%) | 4mo | $20,000 | $20 | 96 |
| 980 N Ironwood Dr #15 | 0.56mi | 2/1.0 | 975 (-0%) | 2mo | $77,900 | $80 | 71 |
| 985 W Roundup St | 0.14mi | 2/2.0 | 896 (-9%) | 11mo | $330,000 | $368 | 65 |
| 1363 N Plaza Dr #9 | 0.46mi | 2/2.0 | 1,027 (+5%) | 3mo | $135,000 | $131 | 64 |
| 1065 N San Marcos Dr #25 | 0.18mi | 2/2.0 | 1,056 (+8%) | 14mo | $48,000 | $45 | 62 |
| 800 W Apache Trl #93 | 0.51mi | 2/1.0 | 888 (-9%) | 2mo | $19,969 | $22 | 59 |
| 800 W Apache Trl #141 | 0.49mi | 2/1.5 | 910 (-7%) | 11mo | $30,000 | $33 | 54 |
| 875 W Smoketree St | 0.51mi | 2/2.0 | 1,080 (+10%) | 7mo | $337,000 | $312 | 50 |
| 800 W Apache Trl N #144 | 0.49mi | 2/1.0 | 896 (-9%) | 16mo | $42,900 | $48 | 50 |
| 800 W Apache Trail Trl #147 | 0.49mi | 2/2.0 | 1,056 (+8%) | 17mo | $37,900 | $36 | 46 |
| 1776 N San Marcos Dr | 0.50mi | 2/1.0 | 841 (-14%) | 14mo | $385,000 | $458 | 42 |
| 1804 W Tepee St #34 | 0.71mi | 2/1.5 | 840 (-14%) | 16mo | $27,000 | $32 | 28 |
Match score weights: distance 35% · size 25% · config 20% · recency 20%. Top-matched comps best support the ARV.
Projected returns pro-forma
-3.0% appreciation · 0.0% rent growth · sell at horizon
- IRR
- 76.4%
- Equity multiple
- 4.31×
- Total profit
- $46,381
- Equity at exit
- $7,455
- IRR
- 79.2%
- Equity multiple
- 8.03×
- Total profit
- $98,423
- Equity at exit
- $4,323
Cash invested: $14,000 (down + closing). Projections, not guarantees.
Landlord ↔ Tenant lean methodology
- Overall (STATE)
- 87 Strongly Landlord-Friendly
- State Arizona
- 87 Strongly Landlord-Friendly · R+3
- County
- — inherits STATE
- City
- — inherits STATE
ZIP-level market 85120
- Home prices YoY
- -29.0%
- Rents YoY
- -3.5%
- Active inventory
- 455
- Price-to-rent
- 2.6×
Monthly cashflow live
- Estimated rent
- $1,614 high interval (Pro) →
- Mortgage (P&I)
- −$262
- Tax est. 1.5%
- −$62 /mo · $750/yr
- Insurance
- −$21
- HOA
- −$0
- Vacancy / Maint / Mgmt
- −$339
- Net cashflow
- $929
Break-even live
UW: 25.0% down · 7.5% · 30yr · 1.5% tax · 5.0% vac · 8.0% maint · 8.0% mgmt
Financing live
Cash to close
- Down payment
- $12,500
- Closing costs
- $1,500
- Reserves months
- —
- Total cash needed
- —
Loan-product check · same deal, 3 products live
Conventional
25% down · 7.5% · 30yr
- Down + closing
- —
- Monthly P&I
- —
- Monthly cashflow
- —
- DSCR
- —
- Eligible?
- —
Personal DTI + credit; lowest rate.
DSCR
20% down · 8.5% · 30yr
- Down + closing
- —
- Monthly P&I
- —
- Monthly cashflow
- —
- DSCR
- —
- Eligible?
- —
No personal income docs; deal must DSCR.
Hard money
10% down · 12.0% · 12mo
- Down + closing
- —
- Monthly P&I
- —
- Monthly cashflow
- —
- DSCR
- —
- Eligible?
- —
Short-term bridge; refi at stabilization.
Rent comps 10 comps
| Address | Beds | Baths | Sqft | Rent | $/sqft | DOM | Units | Dist |
|---|---|---|---|---|---|---|---|---|
| 1440 N Idaho Rd Apache Junction, AZ | 1.0–2.0 | 1.0–1.5 | 1010 | $1,900 | $1.88 | 24d | 3 | 0.63mi |
| 135 N Palo Verde Dr Unit 8 Apache Junction, AZ | 1.0 | 1.0 | 750 | $925 | $1.23 | 23d | 1 | 0.81mi |
| 135 N Palo Verde Dr Apache Junction, AZ | 1.0 | 1.0 | 750 | $915 | $1.22 | 19d | 1 | 0.81mi |
| 2185 W Ohio St Apache Junction, AZ | 2.0 | 1.0 | 1000 | $1,295 | $1.29 | 4d | 1 | 0.86mi |
| 455 N Delaware Dr Unit 7 Apache Junction, AZ | 2.0 | 2.0 | 1060 | $1,900 | $1.79 | 24d | 1 | 0.96mi |
| 695 E Superstition Blvd Apache Junction, AZ | 1.0–3.0 | 1.0–2.0 | 983 | $1,860 | $1.89 | 1d | 13 | 1.02mi |
| 111 S Outpost Rd Unit 4 Apache Junction, AZ | 2.0 | 1.0 | 775 | $1,175 | $1.52 | 23d | 1 | 1.04mi |
| 960 S Mara Dr Unit 1 Apache Junction, AZ | 2.0 | 1.0 | 682 | $1,450 | $2.13 | 12d | 1 | 1.29mi |
| 455 S Delaware Dr Unit 179 Apache Junction, AZ | 2.0 | 2.0 | 1060 | $2,395 | $2.26 | 24d | 1 | 1.29mi |
| 455 S Delaware Dr Apache Junction, AZ | 2.0 | 2.0 | 1060 | $2,048 | $1.93 | 20d | 2 | 1.29mi |
Listing history 15 events
-
2026-06-18days on market $50,000 Active 23 DOM
-
2026-06-17days on market $50,000 Active 22 DOM
-
2026-06-16days on market $50,000 Active 21 DOM
-
2026-06-15days on market $50,000 Active 20 DOM
-
2026-06-13days on market $50,000 Active 18 DOM
-
2026-06-09days on market $50,000 Active 14 DOM
-
2026-06-08days on market $50,000 Active 13 DOM
-
2026-06-07days on market $50,000 Active 12 DOM
-
2026-06-04days on market $50,000 Active 9 DOM
-
2026-06-03days on market $50,000 Active 8 DOM
-
2026-06-02days on market $50,000 Active 7 DOM
-
2026-06-01days on market $50,000 Active 6 DOM
-
2026-05-31days on market $50,000 Active 5 DOM
-
2026-05-26$50,000 Active
-
1986-12-15soldstatus $1,020,000
ⓘ Source: listings_history table (triggers on properties + properties_extension) + one-shot
backfill from property_details.listing_events for pre-trigger history.
Climate risk First Street
- Flood 1/10 Low FEMA zone X (shaded) · 0% chance over 30 yrs
- Wildfire 6/10 Major
- Heat 8/10 Severe 4 d/yr ≥111°F today · 10 d/yr by 30 yrs out
- Wind 1/10 Low
- Air quality 3/10 Moderate 2 unhealthy d/yr today · 3 by 30 yrs out
Nearby sold comps map
Loading sold comps map…
Walkable amenities ~0.75 mi
Loading nearby amenities…
Taxation est. · year 1
- Rental income
- $19,365
- − Mortgage interest
- −$2,801
- − Property taxes
- −$750
- − Insurance
- −$250
- − Repairs & maintenance
- −$1,549
- − Management
- −$1,549
- − Depreciation
- −$1,455
- Taxable income
- $11,011
- Est. tax owed @ 24.0%
- −$2,643
- After-tax cash flow
- $8,509/yr
For passive investors: Depreciation is non-cash, so a rental often shows a tax loss while cash-flowing — sheltering income. Rental losses are passive: they offset passive income freely, and up to $25,000/yr can offset ordinary (W-2) income if you actively participate and your MAGI is under $100k (phasing out to $0 by $150k); unused losses carry forward. On sale, claimed depreciation is recaptured at up to 25%, and gains may owe capital-gains tax (a 1031 exchange can defer both). Figures are a year-1 estimate at your 24.0% rate — not tax advice; consult a CPA.
Schools (NCES district)
- District
- Apache Junction Unified District (4443)
- NCES district ID
- 0400790
- Math proficiency
- 15% ▼ -17.00%
- Reading proficiency
- 20% ▼ -13.00%
- Median HH income
- $44,930
- Composite
- 15.34/100
- National rank
- #9325
- State rank
- #195 of 249 in AZ
Livability — Apache Junction
- Score
- 66/100
- State rank
- #70
- US rank
- #11242
Category grades
Schools grade is shown separately in the Schools card above.
Census & demographics
- Census place
- Apache Junction, AZ
- County
- Pinal County · 399,947 people
- City population
- 56,611
- Metro
- Phoenix-Mesa-Chandler, AZ
- Population (ZIP)
- 31,191
- Household income
- $57,786
- Rent vs Own
- Severe rent burden
- 686.0
Population outlook (Pinal County) Hauer SSP2
- Today (2025)
- 437,574 people
- By 2030
- 446,903 · +2.1%
- By 2040
- 452,589 · +3.4%
- By 2050
- 444,126 · +1.5%
- By 2075
- 430,300 · -1.7%
- By 2100
- 393,536 · -10.1%
Race, ethnicity, and origin ACS 2023
- Neighborhood character
- Predominantly White (77%)
- Race & ethnicity
- White 77% Hispanic / Latino 16% Two or more races 10% Asian 1%
- Hispanic origin (detail)
- Mexican 13%
- Common ancestry
- Romanian 3% Lithuanian 3% Portuguese 3%
- Foreign-born
- 7% · Canada
- Languages at home
- 89% English-only · Spanish 8% Tagalog/Filipino 1%
Political lean MEDSL · Pinal
- 2024 margin
- Strong R (+22.1) · D 38.5% · R 60.6%
- 2008→2024 swing
- -7.6pp toward R · 2008: -14.5pp · 2024: -22.1pp
- All cycles
- 2024: R+22.1 2020: R+17.3 2016: R+19.3 2012: R+17.1 2008: R+14.5
Not yet ingested
- Civics
- —
Market trends
- HPI YoY
- ▼ -128.31%
- Current HPI
- 313.4666
- Rent YoY
- ▼ -3.50%
- Metro
- Phoenix-Mesa-Chandler, AZ
- State GDP YoY
- ▲ 4.54%
- F500 in state
- 20
Industry mix (Fortune 500 HQ in AZ)
| Industry | F500 HQs | Revenue |
|---|---|---|
| Technology | 2 | $13B |
|
||
| Mining / Metals | 1 | $23B |
|
||
| Environmental Services | 1 | $16B |
|
||
| Metals / Steel | 1 | $14B |
|
||
| Technology Distribution | 1 | $9B |
|
||
| Homebuilding | 1 | $8B |
|
||
Price history
-95.1% since first listed2 events — show timeline
- 2026-05-26 Listed $50,000 FSBO.com
- 1986-12-15 Sold (Public Records) $1,020,000 Public Records
Property tax history
-2.6%/yrLatest (2025): $10,074 · -1.6% YoY. Source: county tax records.
Cash-flow waterfall
monthlySold comps — $/sqft
last 12 mo · ≤1 miLoading sold comps…