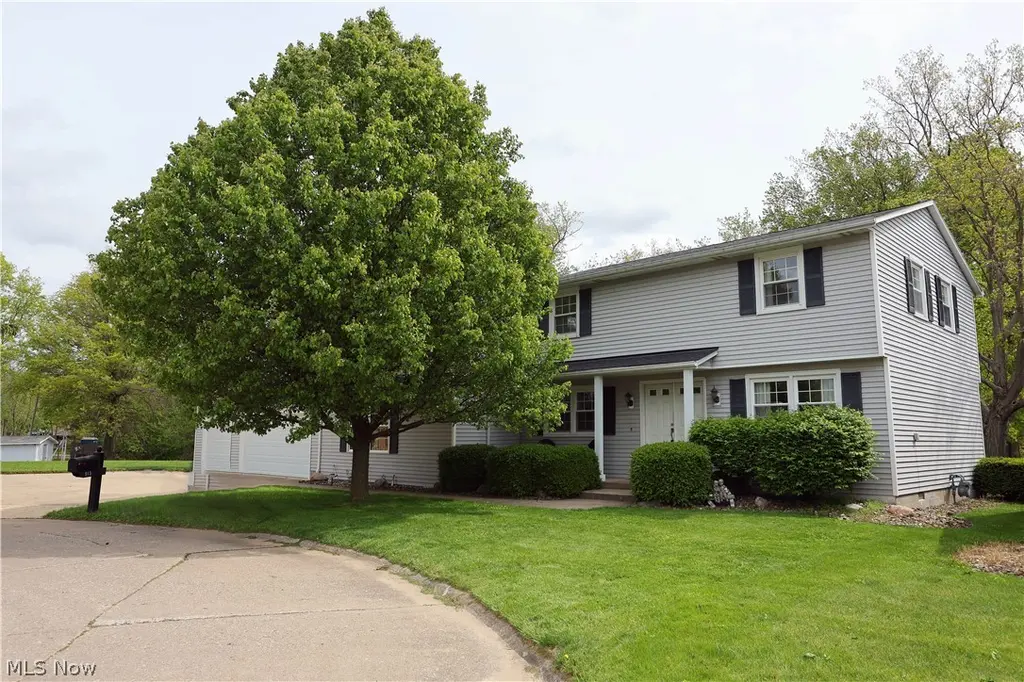
915 Nautical Dr · Vermilion, OH
Flood risk 10/10 · Severe
- FEMA flood zone
- AE
- Chance of flooding over 30 yrs
- 0.99%
- Est. flood insurance / yr
- $1,737 – $8,500
Fire risk 1/10 · Minimal
- Est. fire insurance / yr
- $713 – $1,323
Heat risk 3/10 · Minor
- Hot days now (above 96°F)
- 7 days/yr
- Hot days in 30 yrs
- 17 days/yr
Wind risk 2/10 · Minimal
- Chance of severe wind over 30 yrs
- —
Air-quality risk 2/10 · Minimal
- Unhealthy air days now
- 1 days/yr
- Unhealthy air days in 30 yrs
- 3 days/yr
Risk factors via First Street. Map © Google.
Why this score? — see what drove the C+ grade
The composite is a weighted blend of 9 inputs, each scored 0–100. Each bar is that input's sub-score; the figure is the points it added to the 100-point composite (weight × sub-score).
- Cash flow +26.7/30.0
- DSCR +9.1/10.0
- ARV discount +7.5/15.0
- 1% rule +6.5/10.0
- Schools +5.0/10.0
- Livability +4.0/5.0
- Rent growth +2.5/5.0
- Condition / age +2.5/5.0
- Appreciation +0.0/10.0
$525,000
🖨 Deal sheet 📄 Offer letter ✓ Due diligence
Listing remarks
Imagine living the dream every day with your boat and water toys in your back yard while boating and fishing on Lake Erie. This fantastic 3- bedroom 2311 sq ft. home is located in a fantastic area of waterfront homes with 195 Ft of break wall to dock boats. The home was built on a double lot that allows for a very big yard. The very large 3 car garage 21x31nand10x21 also has plenty of room for more cars, workshop, or toy storage. There is a covered deck on the back of the house. This area is the ultimate place to entertain or relax after a long day and enjoy the views. The updated kitchen has wood cabinets, all appliances and seating area. The family room, informal eating area, formal dinin
Key facts
- Covered deck
- Open floor plan
- Double lot
Tags
Property features AI
Exterior
- Parking: Attached garage with 3 garage spaces
- Utilities: Public water; Public sewer
- Home design: 2-story home; Above-grade finished area reported at 2,311; Vinyl siding exterior; Asphalt roof
- Construction: Vinyl siding construction; Asphalt roof; Built (year source: public records)
- Exterior features: Boat slip; Dock; Covered patio/porch; Waterfront property; Lot dimensions approximately 100 x 92
Interior
- Kitchen: Kitchen on first level
- Bedrooms: Bedroom on second level
- Flooring: Carpet in several rooms; Laminate in dining room; Ceramic tile in one bathroom
- Bathrooms: Two full bathrooms; One half bathroom; Two main-level bathrooms
- Heating & cooling: Central air conditioning; Forced air heating; Gas heating
- Interior features: Total of 8 rooms; Home has a view
Neighborhood map
What this means for you Summary
Snapshot
- This is a 3-bed/2.0-bath single-family listed at $525k.
Deal economics
- At list price, monthly cash flow is $989 ($12k/yr) — positive.
- The deal already cash-flows at list — no discount required.
- Meets the 1% rule at list price ($6k rent vs $525k).
- Cap rate 9.5% vs local median 5.0% in Vermilion — top-decile yield for the area; either an underpriced asset or a hidden risk that comps aren't pricing in. Stress-test before assuming the spread holds.
Location & tenants
- Location reads 81/100 on livability (#96 in OH, #1,481 nationally) — a professional / high-income tenant draw. Strengths: crime A+, cost of living A+, housing A+; Watch: commute F.
- Vermilion Local (suburban): math 56% / reading 60% proficiency, ranked #316 of 656 in OH (top 48%) — acceptable for families but not a draw, mixed tenant base, ~2y average lease.
- Market conditions: 142 active listings in the ZIP; 2 comparable units currently listed for rent nearby; 128 units permitted in Erie County in 2024 (5 in 5+ unit buildings).
- At $6,044/mo this rent would consume 101% of the median local household income ($72k/yr) — very limited rent-growth headroom before tenants either downsize or default.
Forward outlook
- Local home prices are declining (-3.0%/yr); year-one equity from $4k of loan paydown is wiped out by about $16k of value loss. Plan a longer hold.
- Erie County population projected at -15% by 2050 — secular population decline; favor cash flow + early exit over multi-decade hold.
Negotiation context
- Only 7 days on market — expect competitive offers; lowballing is unlikely to land.
- 4 sale attempts since 21y ago with the ask held roughly flat each time — persistent listings suggest the price (not the market) is what's stuck; bring a comps-based counter.
Risks & watch-outs
- Watch-outs: flood insurance adds $427/mo.
- Climate carrying-cost: in FEMA flood zone AE (mandatory federal flood insurance) — expect insurance premiums to compound above CPI over the hold.
Questions for the listing agent
- Built in 1969 — when were the roof, HVAC, electrical panel, plumbing, and water heater last replaced?
- What's the actual annual flood-insurance premium (NFIP or private), and is the property in a SFHA with mandatory coverage?
- Is there a deadline driving the sale (1031 exchange, divorce, estate, relocation)? That informs how much negotiation room exists.
- Schools are B-rated — typically a magnet for longer-tenancy family renters. What's the average tenant stay here, and is there a school-zone premium baked into asking?
- What's the average days-on-market for RENTAL listings here right now (not sales)? A rising rental-DOM trend means longer vacancies and softer asking-rent achievability than the comps imply.
- What's the recent tenant-quality profile in this submarket — average credit score on applications, eviction rate, late-payment / NSF rate, and stable-employment percentage? A property-management company in the area should have these aggregated.
- How much new for-sale + rental construction is in the pipeline within 1–3 miles? Heavy new supply typically softens prices + rents 12–24 months out; constrained supply supports both.
Investment metrics
- 1% rule
- 1.15% ✓
- Cap rate
- 9.53%
- Cash-on-cash
- 11.56%
- DSCR
- 1.51
- GRM
- 7.2
CMA / ARV
- ARV (median comp)
- $276,747
- List price
- $525,000
- Delta
- 89.70%
- Verdict
- OVERPRICED
- Comps
- 20 within 1.0 mi
Show comp detail 12 sales within ~0.75 mi
| Address | Dist | Beds/Ba | Sqft | Sold | Price | $/sf | Match |
|---|---|---|---|---|---|---|---|
| 915 Nautical Dr | 0.00mi | 3/2.5 | 2,311 (0%) | 0mo | $480,000 | $208 | 98 |
| 1140 W River Rd | 0.30mi | 4/2.0 (+1) | 2,300 (-0%) | 9mo | $240,000 | $104 | 72 |
| 969 Vermilion Rd | 0.22mi | 2/1.0 (-1) | 2,345 (+2%) | 9mo | $135,000 | $58 | 71 |
| 4829 Woodview Dr | 0.56mi | 4/2.5 (+1) | 2,304 (-0%) | 2mo | $314,900 | $137 | 65 |
| 880 Exchange St | 0.62mi | 3/2.0 | 2,230 (-4%) | 6mo | $315,000 | $141 | 60 |
| 5105 Park Dr | 0.55mi | 3/2.5 | 2,128 (-8%) | 8mo | $889,000 | $418 | 52 |
| 5408 Park Dr | 0.70mi | 4/3.0 (+1) | 2,321 (+0%) | 9mo | $899,000 | $387 | 50 |
| 4560 Newbury Dr | 0.71mi | 3/3.0 | 2,124 (-8%) | 1mo | $341,000 | $161 | 49 |
| 1062 Flint Dr | 0.62mi | 3/3.0 | 2,100 (-9%) | 9mo | $497,000 | $237 | 44 |
| 1058 Wayne Trl | 0.55mi | 4/2.5 (+1) | 2,098 (-9%) | 12mo | $415,000 | $198 | 42 |
| 5267 Portage Dr | 0.65mi | 4/3.0 (+1) | 2,614 (+13%) | 0mo | $900,000 | $344 | 38 |
| 4973 Woodview Dr | 0.60mi | 4/2.5 (+1) | 1,965 (-15%) | 6mo | $325,000 | $165 | 35 |
Match score weights: distance 35% · size 25% · config 20% · recency 20%. Top-matched comps best support the ARV.
Projected returns pro-forma
-3.0% appreciation · 3.0% rent growth · sell at horizon
- IRR
- -4.0%
- Equity multiple
- 0.85×
- Total profit
- $-21,896
- Equity at exit
- $78,279
- IRR
- 5.7%
- Equity multiple
- 1.43×
- Total profit
- $62,805
- Equity at exit
- $45,392
Cash invested: $147,000 (down + closing). Projections, not guarantees.
Landlord ↔ Tenant lean methodology
- Overall (STATE)
- 73 Landlord-Friendly
- State Ohio
- 73 Landlord-Friendly · R+6
- County
- — inherits STATE
- City
- — inherits STATE
ZIP-level market 44089
- Active inventory
- 142
- Price-to-rent
- 7.2×
Monthly cashflow live
- Estimated rent
- $6,044 medium interval (Pro) →
- Mortgage (P&I)
- −$2,753
- Tax from tax record
- −$388 /mo · $4,652/yr
- Insurance
- −$219
- Flood insurance flood zone
- −$427 /mo · $5,118/yr
- HOA
- −$0
- Vacancy / Maint / Mgmt
- −$1,269
- Net cashflow
- $989
Break-even live
UW: 25.0% down · 7.5% · 30yr · 1.5% tax · 5.0% vac · 8.0% maint · 8.0% mgmt
Financing live
Cash to close
- Down payment
- $131,250
- Closing costs
- $15,750
- Reserves months
- —
- Total cash needed
- —
Loan-product check · same deal, 3 products live
Conventional
25% down · 7.5% · 30yr
- Down + closing
- —
- Monthly P&I
- —
- Monthly cashflow
- —
- DSCR
- —
- Eligible?
- —
Personal DTI + credit; lowest rate.
DSCR
20% down · 8.5% · 30yr
- Down + closing
- —
- Monthly P&I
- —
- Monthly cashflow
- —
- DSCR
- —
- Eligible?
- —
No personal income docs; deal must DSCR.
Hard money
10% down · 12.0% · 12mo
- Down + closing
- —
- Monthly P&I
- —
- Monthly cashflow
- —
- DSCR
- —
- Eligible?
- —
Short-term bridge; refi at stabilization.
Rent comps 2 comps
| Address | Beds | Baths | Sqft | Rent | $/sqft | DOM | Units | Dist |
|---|---|---|---|---|---|---|---|---|
| 5012 Hollyview Dr Unit 1496126P Vermilion, OH | 4.0 | 1.5 | 1679 | $8,362 | $4.98 | 43d | 1 | 0.81mi |
| 1041 Dogwood Ln Vermilion, OH | 2.0 | 2.0 | 1457 | $2,274 | $1.56 | 1d | 12 | 1.15mi |
Listing history 8 events
-
2026-05-14$525,000 Active 1110-char remark
-
2026-01-23price $525,000
-
2025-12-13$550,000 Active
-
2007-04-23soldstatus $269,000
-
2006-07-06historical
-
2006-01-06$274,900
-
2006-01-05historical
-
2005-07-05$274,900
ⓘ Source: listings_history table (triggers on properties + properties_extension) + one-shot
backfill from property_details.listing_events for pre-trigger history.
Tax reassessment forecast OH · Partial reset (capped growth)
- Current annual tax
- $4,652 · $388/mo
- Projected year-2 tax
- $6,421 · $535/mo
- Expected delta
- +$1,769/yr (+$147/mo · 38.0%)
ⓘ Screening estimate from a state-policy table — verify with the county assessor before closing.
Climate risk First Street
- Flood 10/10 Extreme FEMA zone AE · 99% chance over 30 yrs
- Wildfire 1/10 Low
- Heat 3/10 Moderate 7 d/yr ≥96°F today · 17 d/yr by 30 yrs out
- Wind 2/10 Low
- Air quality 2/10 Low 1 unhealthy d/yr today · 3 by 30 yrs out
Nearby sold comps map
Loading sold comps map…
Walkable amenities ~0.75 mi
Loading nearby amenities…
Taxation est. · year 1
- Rental income
- $72,533
- − Mortgage interest
- −$29,408
- − Property taxes
- −$4,652
- − Insurance
- −$7,744
- − Repairs & maintenance
- −$5,803
- − Management
- −$5,803
- − Depreciation
- −$15,273
- Taxable income
- $3,851
- Est. tax owed @ 24.0%
- −$924
- After-tax cash flow
- $10,943/yr
For passive investors: Depreciation is non-cash, so a rental often shows a tax loss while cash-flowing — sheltering income. Rental losses are passive: they offset passive income freely, and up to $25,000/yr can offset ordinary (W-2) income if you actively participate and your MAGI is under $100k (phasing out to $0 by $150k); unused losses carry forward. On sale, claimed depreciation is recaptured at up to 25%, and gains may owe capital-gains tax (a 1031 exchange can defer both). Figures are a year-1 estimate at your 24.0% rate — not tax advice; consult a CPA.
Schools (NCES district)
- District
- Vermilion Local
- NCES district ID
- 3904682
- Math proficiency
- 56% ▼ -13.00%
- Reading proficiency
- 60% ▼ -5.00%
- Median HH income
- $52,091
- Composite
- 49.61/100
- National rank
- #1981
- State rank
- #316 of 656 in OH
Livability — Vermilion
- Score
- 81/100
- State rank
- #96
- US rank
- #1481
Category grades
Schools grade is shown separately in the Schools card above.
Census & demographics
- Census place
- Vermilion, OH
- County
- Erie · 78,232 people
- Metro
- Sandusky, OH
- Population (ZIP)
- 15,873
- Household income
- $72,045
- Rent vs Own
- Severe rent burden
- 5.8
Population outlook (Erie County) Hauer SSP2
- Today (2025)
- 73,204 people
- By 2030
- 71,341 · -2.5%
- By 2040
- 66,771 · -8.8%
- By 2050
- 62,512 · -14.6%
- By 2075
- 56,154 · -23.3%
- By 2100
- 49,045 · -33.0%
Race, ethnicity, and origin ACS 2023
- Neighborhood character
- Predominantly White (93%)
- Race & ethnicity
- White 93% Hispanic / Latino 4% Two or more races 3%
- Common ancestry
- Romanian 7% Lithuanian 4% Slovak 2%
- Foreign-born
- 1%
- Languages at home
- 98% English-only · Other Indo-European 1%
Political lean MEDSL · Erie
- 2024 margin
- R (+14.1) · D 42.5% · R 56.6%
- 2008→2024 swing
- -28.0pp toward R · 2008: 13.9pp · 2024: -14.1pp
- All cycles
- 2024: R+14.1 2020: R+11.6 2016: R+9.8 2012: D+11.3 2008: D+13.9
Not yet ingested
- Civics
- —
Market trends
- HPI YoY
- ▼ -122.76%
- Current HPI
- 206.8223
- Rent YoY
- —
- Metro
- —
- State GDP YoY
- ▲ 1.98%
- F500 in state
- 48
Industry mix (Fortune 500 HQ in OH)
| Industry | F500 HQs | Revenue |
|---|---|---|
| Insurance | 3 | $145B |
|
||
| Industrial Machinery | 3 | $49B |
|
||
| Financial Services | 3 | $24B |
|
||
| Consumer Goods | 2 | $93B |
|
||
| Aerospace / Defense | 2 | $47B |
|
||
| Utilities | 2 | $33B |
|
||
Price history
-99.5% since first listed11 events — show timeline
- 2026-06-05 Sold (Public Records) $1,440 Public Records
- 2026-06-05 Sold (MLS) $480,000 MLSNOW
- 2026-05-21 Pending — MLSNOW
- 2026-05-14 Listed $525,000 MLSNOW
- 2026-01-23 Price Changed $525,000 MLSNOW
- 2025-12-13 Listed $550,000 MLSNOW
- 2007-04-23 Sold (Public Records) $269,000 Public Records
- 2006-07-06 Listing Removed — MLSNOW
- 2006-01-06 Listed $274,900 MLSNOW
- 2006-01-05 Listing Removed — MLSNOW
- 2005-07-05 Listed $274,900 MLSNOW
Property tax history
+1.9%/yrLatest (2025): $4,652 · -11.6% YoY. Source: county tax records.
Cash-flow waterfall
monthlySold comps — $/sqft
last 12 mo · ≤1 miLoading sold comps…