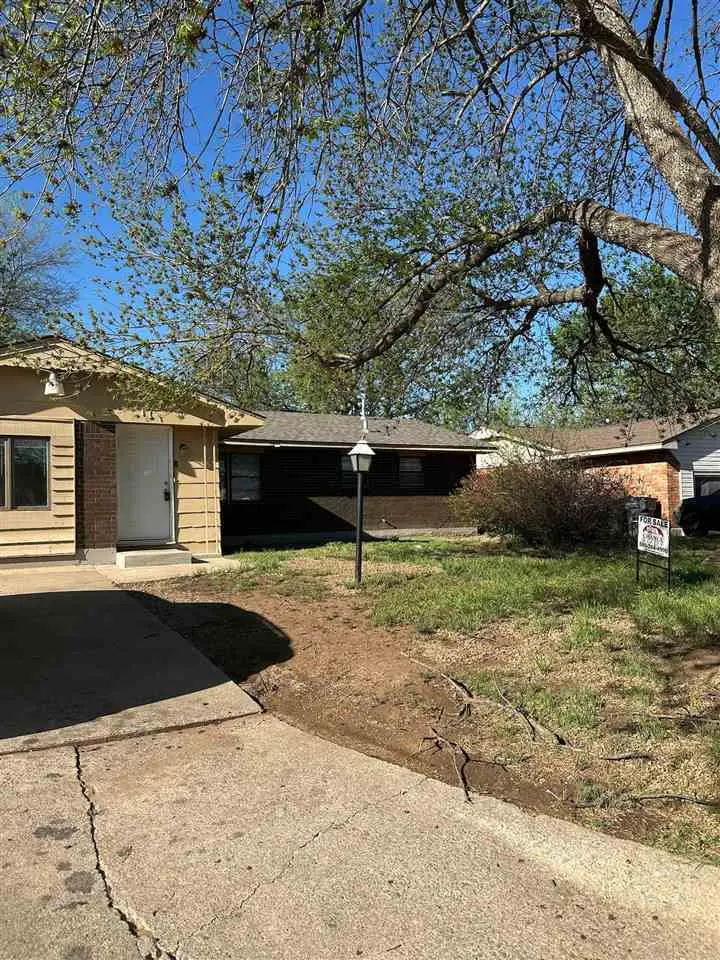
118 NE Angus · Lawton, OK
Flood risk 1/10 · Minimal
- FEMA flood zone
- X (unshaded)
- Chance of flooding over 30 yrs
- 0.0%
- Est. flood insurance / yr
- $507 – $1,088
Fire risk 7/10 · Major
- Est. fire insurance / yr
- $2,463 – $4,575
Heat risk 6/10 · Moderate
- Hot days now (above 108°F)
- 7 days/yr
- Hot days in 30 yrs
- 19 days/yr
Wind risk 3/10 · Minor
- Chance of severe wind over 30 yrs
- 5.0%
Air-quality risk 1/10 · Minimal
- Unhealthy air days now
- 0 days/yr
- Unhealthy air days in 30 yrs
- 0 days/yr
Risk factors via First Street. Map © Google.
Why this score? — see what drove the B- grade
The composite is a weighted blend of 9 inputs, each scored 0–100. Each bar is that input's sub-score; the figure is the points it added to the 100-point composite (weight × sub-score).
- Cash flow +26.4/30.0
- ARV discount +15.0/15.0
- DSCR +9.0/10.0
- 1% rule +7.0/10.0
- Livability +3.2/5.0
- Rent growth +2.6/5.0
- Condition / age +2.5/5.0
- Schools +2.0/10.0
- Appreciation +0.0/10.0
$99,000
🖨 Deal sheet 📄 Offer letter ✓ Due diligence
Listing remarks
Buyer will need to satisfy himself as to home condition. Outstanding area and potential for great home after some updates. Good future value here. Call Teresa with any questions. 580 284 4900.
Key facts
- 6,600 sq ft lot
- Garage
- Built 1964
Property features AI
Exterior
- Parking: No garage (converted garage)
- Utilities: Public water; Public sewer
- Home design: Single family residence; One story; Brick veneer construction
- Construction: Composition roof; Slab foundation
- Exterior features: Chain link fencing; Shed(s); Workshop
Interior
- Kitchen: Cooktop; Dishwasher; Refrigerator
- Flooring: Other
- Bathrooms: 1 full bathroom; 1 half bathroom
- Heating & cooling: Central heating; Natural gas heating; Fireplace heating; Central electric air conditioning
- Interior features: Wood-burning fireplace; Covered patio; Deck
- Laundry & utility: Gas water heater
Neighborhood map
What this means for you Summary
Snapshot
- This is a 3-bed/1.0-bath single-family listed at $99k.
Deal economics
- At list price, monthly cash flow is $258 ($3k/yr) — positive.
- The deal already cash-flows at list — no discount required.
- Meets the 1% rule at list price ($1k rent vs $99k).
- Recommended offer: $93k (6.0% below list) — sets the bar for market timing.
- Cap rate 9.4% vs local median 6.1% in Lawton — top-decile yield for the area; either an underpriced asset or a hidden risk that comps aren't pricing in. Stress-test before assuming the spread holds.
Location & tenants
- Location reads 63/100 on livability (#206 in OK) — a middle-class / working-renter tenant base. Strengths: cost of living A+, housing A+; Watch: employment D, crime F, commute F.
- Lawton (urban): math 20% / reading 26% proficiency, ranked #137 of 270 in OK (top 51%) — low school quality limits family demand, transient renter base, plan for 1-2y turnover.
- Zoned schools: Pioneer Park Es (math 22% / reading 17%, grade F, #479 of 845 statewide, top 63%, 460 students, 0% FRL); Macarthur Ms (math 16% / reading 31%, grade F, #113 of 345 statewide, top 34%, 865 students, 0% FRL); Macarthur Hs (math 19% / reading 34%, grade F, #139 of 447 statewide, top 31%, 1,163 students, 0% FRL) — zoned schools average 0% FRL vs 54% district-wide (54 pts lower); this property's tenant base skews higher-income than the district average.
- Market conditions: Rents flat; 208 active listings in the ZIP; 133 units permitted in Comanche County in 2024 (0 in 5+ unit buildings).
Forward outlook
- Local home prices are declining (-3.0%/yr); year-one equity from $684 of loan paydown is wiped out by about $3k of value loss. Plan a longer hold.
- Comanche County population projected to shrink 3% by 2050 — rents likely to lag national; underwrite the cash flow, not the appreciation.
Negotiation context
- It's been on market 72 days — a 6% lower offer ($93k) is reasonable based on typical stale-listing flexibility.
- 5 sale attempts since 9y ago; this cycle's ask has dropped $11k (10%) from the opening price — seller is motivated, your offer sets the floor, not the list.
- Current owner paid $86k; 15% above their basis — modest negotiation headroom, anchor on the comps not their cost.
Risks & watch-outs
- Climate carrying-cost: major wildfire risk; extreme-heat days projected 7→19/yr by 2055 (HVAC capex compounding) — expect insurance premiums to compound above CPI over the hold.
Questions for the listing agent
- It's been on market 72 days. Have you received any prior offers? Is the seller open to a 6% concession, seller financing, or rate buy-down credit?
- Built in 1964 — when were the roof, HVAC, electrical panel, plumbing, and water heater last replaced?
- Why hasn't it sold? Are there any deal-killer items the seller is aware of (foundation, flood, title, zoning, code violations)?
- Is there a deadline driving the sale (1031 exchange, divorce, estate, relocation)? That informs how much negotiation room exists.
- Schools are D-rated, which usually means shorter tenancies and higher turnover. Who's the typical renter profile here, and what's been the actual vacancy rate?
- Crime grade is F in this area — have there been break-ins, vandalism, or insurance claims at this property in the last 3 years? What carrier currently insures it and at what premium?
- What's the average days-on-market for RENTAL listings here right now (not sales)? A rising rental-DOM trend means longer vacancies and softer asking-rent achievability than the comps imply.
- What's the recent tenant-quality profile in this submarket — average credit score on applications, eviction rate, late-payment / NSF rate, and stable-employment percentage? A property-management company in the area should have these aggregated.
- How much new for-sale + rental construction is in the pipeline within 1–3 miles? Heavy new supply typically softens prices + rents 12–24 months out; constrained supply supports both.
Investment metrics
- 1% rule
- 1.20% ✓
- Cap rate
- 9.41%
- Cash-on-cash
- 11.15%
- DSCR
- 1.50
- GRM
- 6.9
CMA / ARV
- ARV (on-the-fly)
- $195,776
- Comps found
- 12
Show comp detail 12 sales within ~0.75 mi
| Address | Dist | Beds/Ba | Sqft | Sold | Price | $/sf | Match |
|---|---|---|---|---|---|---|---|
| 101 NE English St | 0.23mi | 4/2.0 (+1) | 1,716 (-2%) | 2mo | $194,000 | $113 | 75 |
| 908 NE Dove Ln | 0.43mi | 3/2.0 | 1,800 (+3%) | 7mo | $195,000 | $108 | 65 |
| 801 NE Turtle Dove Ln | 0.35mi | 3/2.0 | 1,781 (+2%) | 16mo | $190,000 | $107 | 63 |
| 2304 NE 9th St | 0.65mi | 3/2.0 | 1,800 (+3%) | 5mo | $185,000 | $103 | 57 |
| 125 NE Babbit St | 0.07mi | 4/2.0 (+1) | 1,500 (-14%) | 15mo | $117,000 | $78 | 52 |
| 2313 NE Turtle Creek Dr | 0.67mi | 3/2.0 | 1,900 (+9%) | 2mo | $212,000 | $112 | 49 |
| 206 NW Mimosa Ln | 0.51mi | 3/2.5 | 1,900 (+9%) | 11mo | $195,000 | $103 | 47 |
| 2326 NE Garden Ln | 0.75mi | 3/2.0 | 1,749 (+0%) | 20mo | $215,000 | $123 | 45 |
| 905 NE Bob White Rd | 0.69mi | 4/2.0 (+1) | 2,000 (+14%) | 4mo | $309,900 | $155 | 32 |
| 7908 SW Powell St | 0.74mi | 3/2.0 | 1,575 (-10%) | 17mo | $254,990 | $162 | 31 |
| 1002 NE Bob White Rd | 0.68mi | 4/2.0 (+1) | 2,000 (+14%) | 13mo | $229,900 | $115 | 25 |
| 2508 NE Turtle Creek Dr | 0.57mi | 4/2.0 (+1) | 2,000 (+14%) | 22mo | $220,000 | $110 | 22 |
Match score weights: distance 35% · size 25% · config 20% · recency 20%. Top-matched comps best support the ARV.
Projected returns pro-forma
-3.0% appreciation · 0.25% rent growth · sell at horizon
- IRR
- -2.8%
- Equity multiple
- 0.90×
- Total profit
- $-2,833
- Equity at exit
- $14,761
- IRR
- 3.6%
- Equity multiple
- 1.23×
- Total profit
- $6,258
- Equity at exit
- $8,560
Cash invested: $27,720 (down + closing). Projections, not guarantees.
Landlord ↔ Tenant lean methodology
- Overall (STATE)
- 83 Strongly Landlord-Friendly
- State Oklahoma
- 83 Strongly Landlord-Friendly · R+20
- County
- — inherits STATE
- City
- — inherits STATE
ZIP-level market 73507
- Home prices YoY
- -23.2%
- Rents YoY
- 0.2%
- Active inventory
- 208
- Price-to-rent
- 6.9×
Monthly cashflow live
- Estimated rent
- $1,192 medium interval (Pro) →
- Mortgage (P&I)
- −$519
- Tax from tax record
- −$124 /mo · $1,486/yr
- Insurance
- −$41
- HOA
- −$0
- Vacancy / Maint / Mgmt
- −$250
- Net cashflow
- $258
Break-even live
UW: 25.0% down · 7.5% · 30yr · 1.5% tax · 5.0% vac · 8.0% maint · 8.0% mgmt
Financing live
Cash to close
- Down payment
- $24,750
- Closing costs
- $2,970
- Reserves months
- —
- Total cash needed
- —
Loan-product check · same deal, 3 products live
Conventional
25% down · 7.5% · 30yr
- Down + closing
- —
- Monthly P&I
- —
- Monthly cashflow
- —
- DSCR
- —
- Eligible?
- —
Personal DTI + credit; lowest rate.
DSCR
20% down · 8.5% · 30yr
- Down + closing
- —
- Monthly P&I
- —
- Monthly cashflow
- —
- DSCR
- —
- Eligible?
- —
No personal income docs; deal must DSCR.
Hard money
10% down · 12.0% · 12mo
- Down + closing
- —
- Monthly P&I
- —
- Monthly cashflow
- —
- DSCR
- —
- Eligible?
- —
Short-term bridge; refi at stabilization.
Listing history 26 events
-
2026-06-18status $99,000 Pending 72 DOM
-
2026-06-18days on market $99,000 Active 72 DOM
-
2026-06-17days on market $99,000 Active 71 DOM
-
2026-06-16days on market $99,000 Active 70 DOM
-
2026-06-15days on market $99,000 Active 69 DOM
-
2026-06-14days on market $99,000 Active 67 DOM
-
2026-06-13days on market $99,000 Active 66 DOM
-
2026-06-10days on market $99,000 Active 64 DOM
-
2026-06-09days on market $99,000 Active 63 DOM
-
2026-06-08days on market $99,000 Active 62 DOM
-
2026-06-07days on market $99,000 Active 61 DOM
-
2026-06-05days on market $99,000 Active 58 DOM
-
2026-06-03days on market $99,000 Active 57 DOM
-
2026-06-02days on market $99,000 Active 56 DOM
-
2026-06-01days on market $99,000 Active 55 DOM
-
2026-05-31days on market $99,000 Active 54 DOM
-
2026-05-30days on market $99,000 Active 53 DOM
-
2026-05-19price $99,000
-
2026-03-26$110,000 Active
-
2025-01-22$110,000 Active
-
2023-10-30$120,000 Active
-
2021-11-30soldstatus $86,000
-
2020-10-05$89,500
-
2018-09-17soldstatus $53,500
-
2018-09-10soldstatus $43,500
-
2017-11-24$44,900
ⓘ Source: listings_history table (triggers on properties + properties_extension) + one-shot
backfill from property_details.listing_events for pre-trigger history.
Tax reassessment forecast OK · Resets to sale price
- Current annual tax
- $1,486 · $124/mo
- Projected year-2 tax
- $1,486 · $124/mo
- Expected delta
- $0/yr ($0/mo · 0.0%)
ⓘ Screening estimate from a state-policy table — verify with the county assessor before closing.
Climate risk First Street
- Flood 1/10 Low FEMA zone X (unshaded) · 0% chance over 30 yrs
- Wildfire 7/10 Severe
- Heat 6/10 Major 7 d/yr ≥108°F today · 19 d/yr by 30 yrs out
- Wind 3/10 Moderate 5% chance of damaging wind over 30 yrs
- Air quality 1/10 Low 0 unhealthy d/yr today · 0 by 30 yrs out
Nearby sold comps map
Loading sold comps map…
Walkable amenities ~0.75 mi
Loading nearby amenities…
Taxation est. · year 1
- Rental income
- $14,305
- − Mortgage interest
- −$5,546
- − Property taxes
- −$1,486
- − Insurance
- −$495
- − Repairs & maintenance
- −$1,144
- − Management
- −$1,144
- − Depreciation
- −$2,880
- Taxable income
- $1,610
- Est. tax owed @ 24.0%
- −$386
- After-tax cash flow
- $2,704/yr
For passive investors: Depreciation is non-cash, so a rental often shows a tax loss while cash-flowing — sheltering income. Rental losses are passive: they offset passive income freely, and up to $25,000/yr can offset ordinary (W-2) income if you actively participate and your MAGI is under $100k (phasing out to $0 by $150k); unused losses carry forward. On sale, claimed depreciation is recaptured at up to 25%, and gains may owe capital-gains tax (a 1031 exchange can defer both). Figures are a year-1 estimate at your 24.0% rate — not tax advice; consult a CPA.
Schools (NCES district)
- District
- Lawton
- NCES district ID
- 4017250
- Math proficiency
- 20% ▼ -12.00%
- Reading proficiency
- 26% ▼ -9.00%
- Median HH income
- $42,618
- Composite
- 19.68/100
- National rank
- #8732
- State rank
- #137 of 270 in OK
Livability — Lawton
- Score
- 63/100
- State rank
- #206
- US rank
- #15131
Category grades
Schools grade is shown separately in the Schools card above.
Census & demographics
- Census place
- Lawton, OK
- County
- Comanche County · 96,361 people
- City population
- 89,233
- Metro
- Lawton, OK
- Population (ZIP)
- 21,046
- Household income
- $62,132
- Rent vs Own
- Severe rent burden
- 979.0
Population outlook (Comanche County) Hauer SSP2
- Today (2025)
- 124,518 people
- By 2030
- 124,231 · -0.2%
- By 2040
- 122,193 · -1.9%
- By 2050
- 120,368 · -3.3%
- By 2075
- 120,492 · -3.2%
- By 2100
- 123,113 · -1.1%
Race, ethnicity, and origin ACS 2023
- Neighborhood character
- Diverse neighborhood (Simpson 0.65)
- Race & ethnicity
- White 56% Hispanic / Latino 14% Two or more races 13% Black 13% Native American 7% Asian 2%
- Hispanic origin (detail)
- Mexican 7% Puerto Rican 4%
- Common ancestry
- Lithuanian 2% Slovak 2% Italian 1%
- Foreign-born
- 5% · Canada, South Korea
- Languages at home
- 89% English-only · Spanish 6% German/W. Germanic 1% Other Asian/Pacific 1%
Political lean MEDSL · Comanche
- 2024 margin
- Strong R (+23.3) · D 37.4% · R 60.7% · Other 1.9%
- 2008→2024 swing
- -5.8pp toward R · 2008: -17.5pp · 2024: -23.3pp
- All cycles
- 2024: R+23.3 2020: R+20.1 2016: R+23.7 2012: R+17.0 2008: R+17.5
Not yet ingested
- Civics
- —
Market trends
- HPI YoY
- ▼ -38.48%
- Current HPI
- 127.057
- Rent YoY
- ▲ 0.25%
- Metro
- Lawton, OK
- State GDP YoY
- ▲ 1.55%
- F500 in state
- 6
Industry mix (Fortune 500 HQ in OK)
| Industry | F500 HQs | Revenue |
|---|---|---|
| Energy | 3 | $48B |
|
||
Price history
+120.5% since first listed9 events — show timeline
- 2026-05-19 Price Changed $99,000 LBRMLS
- 2026-03-26 Listed $110,000 LBRMLS
- 2025-01-22 Listed $110,000 LBRMLS
- 2023-10-30 Listed $120,000 LBRMLS
- 2021-11-30 Sold (MLS) $86,000 LBRMLS
- 2020-10-05 Listed $89,500 LBRMLS
- 2018-09-17 Sold (Public Records) $53,500 Public Records
- 2018-09-10 Sold (MLS) $43,500 LBRMLS
- 2017-11-24 Listed $44,900 LBRMLS
Property tax history
+5.1%/yrLatest (2025): $1,486 · +4.7% YoY. Source: county tax records.
Cash-flow waterfall
monthlySold comps — $/sqft
last 12 mo · ≤1 miLoading sold comps…