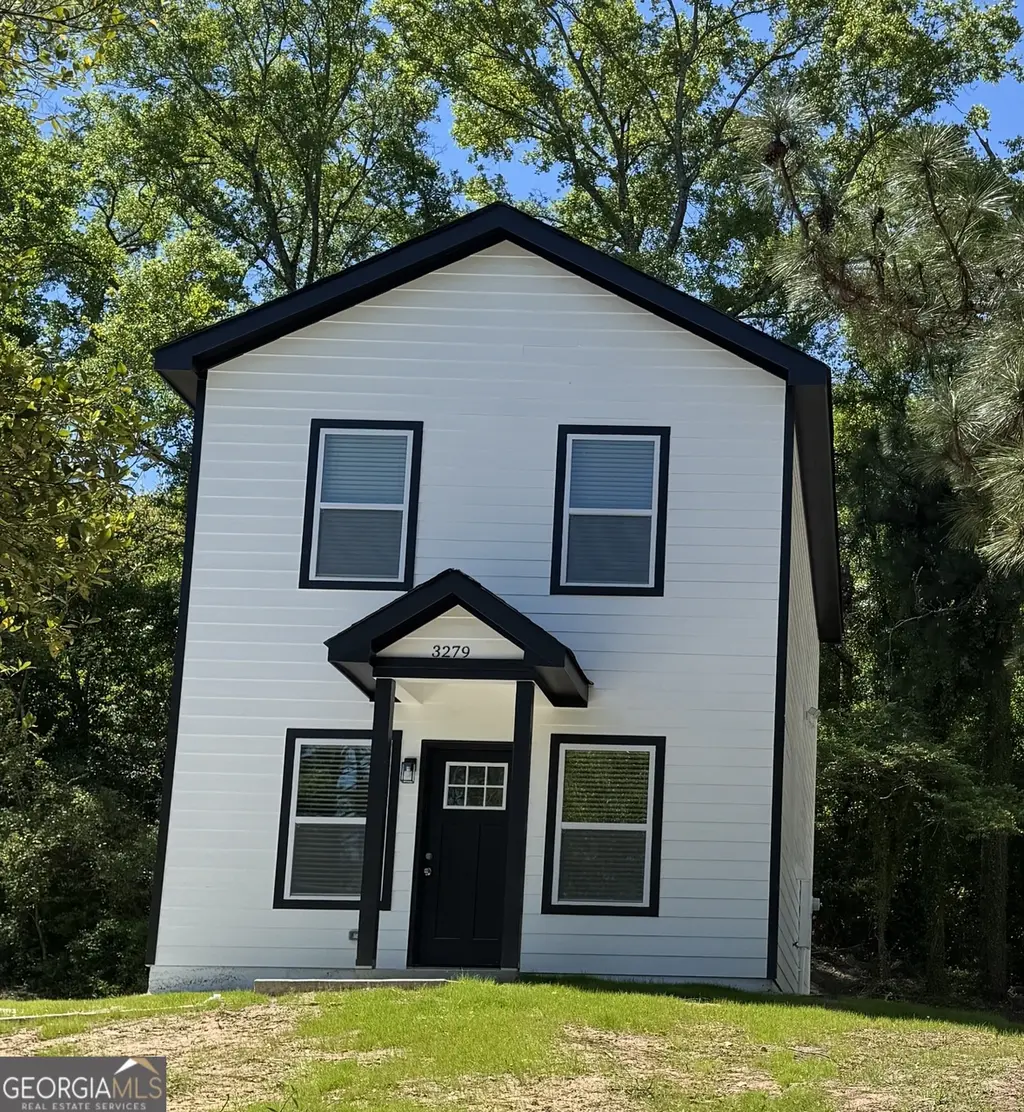
3279 Kings Park Cir · Macon-Bibb County, GA
Flood risk 1/10 · Minimal
- FEMA flood zone
- X (unshaded)
- Chance of flooding over 30 yrs
- 0.0%
- Est. flood insurance / yr
- $507 – $1,088
Fire risk 4/10 · Minor
- Est. fire insurance / yr
- $963 – $1,789
Heat risk 7/10 · Major
- Hot days now (above 107°F)
- 7 days/yr
- Hot days in 30 yrs
- 17 days/yr
Wind risk 6/10 · Moderate
- Chance of severe wind over 30 yrs
- 68.0%
Air-quality risk 4/10 · Minor
- Unhealthy air days now
- 5 days/yr
- Unhealthy air days in 30 yrs
- 5 days/yr
Risk factors via First Street. Map © Google.
Why this score? — see what drove the D+ grade
The composite is a weighted blend of 9 inputs, each scored 0–100. Each bar is that input's sub-score; the figure is the points it added to the 100-point composite (weight × sub-score).
- Cash flow +13.2/30.0
- ARV discount +7.5/15.0
- Appreciation +7.2/10.0
- Rent growth +5.0/5.0
- DSCR +4.0/10.0
- 1% rule +3.7/10.0
- Livability +2.5/5.0
- Condition / age +2.5/5.0
- Schools +1.2/10.0
$150,000
🖨 Deal sheet (PDF) 📄 Offer letter ✓ Due diligence
Listing remarks MLS
Home is offered for sale and rent. Stunning new construction 2-story home designed with both comfort and style in mind. This thoughtfully crafted home offers LVP flooring, recessed lighting, and granite countertops in the modern kitchen. The open-concept living area creates an inviting space, perfect for entertaining and everyday living. The spacious primary bedroom is conveniently located on the main level, featuring a luxurious tile surround bathtub. Upstairs, you'll find two sizable bedrooms, including one with a private en-suite bathroom complete with a tile surround walk-in shower. This home combines affordable, efficient, and low-maintenance living with meticulous attention to detail inside and out. As an added bonus, the seller is offering a credit to be used towards closing costs. Don't miss this incredible opportunity to own a brand-new home at a price that won't break the bank! *Photos are of similar home*
Key facts
- 8,276 sq ft lot
- Built 2025
- Listed 90 days
Neighborhood map
What this means for you Summary
Snapshot
- This is a 3-bed/2.0-bath other listed at $150k.
Deal economics
- At list price, monthly cash flow is $-2 ($-18/yr) — negative.
- To cash-flow at today's rent, offer at most $150k (0.1% below list).
- To meet the 1% rule (rent ≥ 1% of price), the offer needs to be $131k (12.7% below list).
- Recommended offer: $131k (12.7% below list) — sets the bar for 1% rule.
Location & tenants
- Location reads: area grade D — affects rentability + tenant quality, not the cash-flow math above.
- Bibb County (urban): math 11% / reading 18% proficiency, ranked #161 of 174 in GA (top 92%) — low school quality limits family demand, transient renter base, plan for 1-2y turnover; 75% free/reduced lunch — lower-income household profile, screen leases tightly.
- Zoned schools: Bernd Elementary School (math 8% / reading 12%, grade F, #1,092 of 1,228 statewide, top 91%, 415 students, 100% FRL); Appling Middle School (math 7% / reading 14%, grade F, #429 of 470 statewide, top 91%, 648 students, 100% FRL); Northeast High School (math 2% / reading 5%, grade F, #413 of 424 statewide, top 99%, 742 students, 100% FRL) — zoned schools average 100% FRL vs 75% district-wide (25 pts higher); higher-poverty schools than district average — tighter screening recommended.
- Market conditions: Rents rising fast (+10.8%/yr); 123 active listings in the ZIP; 3 comparable units currently listed for rent nearby; rentals at typical pace (median 15d on market — plan ~3-4 weeks tenant-placement turnaround); lower-income renter base — watch delinquency; 154 units permitted in Bibb County in 2024 (0 in 5+ unit buildings).
- This rent runs 35% of the median local income ($45k/yr) — at the standard rent-burdened threshold; future hikes will face affordability resistance.
Forward outlook
- In year one you build about $8k of equity ($1k loan paydown + $6k appreciation (4.3% local appreciation)).
- Bibb County population projected at -12% by 2050 — secular population decline; favor cash flow + early exit over multi-decade hold.
- At projected returns (4.3% appreciation + 8.0% rent growth), your $42k cash investment doubles in ~5 years — after that, you're playing with house money.
- By year 5, paydown + projected appreciation supports a ~$32k cash-out refi (75% LTV) — recoverable capital for the next deal without selling this one.
Negotiation context
- It's been on market 90 days — a 6% lower offer ($141k) is reasonable based on typical stale-listing flexibility.
- 3 sale attempts; this cycle's ask is 11011% above the opening price — seller raised mid-cycle; expect resistance to lowballs.
Risks & watch-outs
- Climate carrying-cost: major wind risk, 68% chance of damaging wind over 30y; extreme-heat days projected 7→17/yr by 2055 (HVAC capex compounding) — expect insurance premiums to compound above CPI over the hold.
Questions for the listing agent
- What do current leases actually rent for vs. the listed asking? Can we see a recent rent roll and the last 12 months of T-12 income?
- It's been on market 90 days. Have you received any prior offers? Is the seller open to a 13% concession, seller financing, or rate buy-down credit?
- Why hasn't it sold? Are there any deal-killer items the seller is aware of (foundation, flood, title, zoning, code violations)?
- Is there a deadline driving the sale (1031 exchange, divorce, estate, relocation)? That informs how much negotiation room exists.
- The area grade is low — what's the realistic commute time and amenity access for the typical tenant pool here? Any planned neighborhood developments (good or bad) we should know about?
- What's the average days-on-market for RENTAL listings here right now (not sales)? A rising rental-DOM trend means longer vacancies and softer asking-rent achievability than the comps imply.
- What's the recent tenant-quality profile in this submarket — average credit score on applications, eviction rate, late-payment / NSF rate, and stable-employment percentage? A property-management company in the area should have these aggregated.
- How much new for-sale + rental construction is in the pipeline within 1–3 miles? Heavy new supply typically softens prices + rents 12–24 months out; constrained supply supports both.
Investment metrics
- 1% rule
- 0.87% ✗
- Cap rate
- 6.28%
- Cash-on-cash
- -0.04%
- DSCR
- 1.00
- GRM
- 9.5
CMA / ARV
- ARV (median comp)
- $49,063
- List price
- $150,000
- Delta
- 205.73%
- Verdict
- OVERPRICED
- Comps
- 20 within 1.0 mi
Projected returns pro-forma
4.31% appreciation · 8.0% rent growth · sell at horizon
- IRR
- 13.5%
- Equity multiple
- 1.85×
- Total profit
- $35,593
- Equity at exit
- $78,805
- IRR
- 16.8%
- Equity multiple
- 4.03×
- Total profit
- $127,344
- Equity at exit
- $131,137
Cash invested: $42,000 (down + closing). Projections, not guarantees.
Landlord ↔ Tenant lean methodology
- Overall (STATE)
- 90 Strongly Landlord-Friendly
- State Georgia
- 90 Strongly Landlord-Friendly · R+3
- County
- — inherits STATE
- City
- — inherits STATE
ZIP-level market 31217
- Home prices YoY
- 2.1%
- Rents YoY
- 10.8%
- Active inventory
- 123
- Price-to-rent
- 9.5×
Monthly cashflow live
- Estimated rent
- $1,310 medium interval (Pro) →
- Mortgage (P&I)
- −$787
- Tax est. 1.5%
- −$188 /mo · $2,250/yr
- Insurance
- −$62
- HOA
- −$0
- Vacancy / Maint / Mgmt
- −$275
- Net cashflow
- $-2
Break-even live
Sensitivity live
| Price | -10% $102 | -5% $50 | +0% $-2 | +5% $-53 | +10% $-105 |
|---|---|---|---|---|---|
| Rent | -10% $-105 | -5% $-53 | +0% $-2 | +5% $50 | +10% $102 |
| Rate | -1.0pp $74 | -0.5pp $37 | base $-2 | +0.5pp $-40 | +1.0pp $-80 |
UW: 25.0% down · 7.5% · 30yr · 1.5% tax · 5.0% vac · 8.0% maint · 8.0% mgmt
Financing live
Cash to close
- Down payment
- $37,500
- Closing costs
- $4,500
- Reserves months
- —
- Total cash needed
- —
Loan-product check · same deal, 3 products live
Conventional
25% down · 7.5% · 30yr
- Down + closing
- —
- Monthly P&I
- —
- Monthly cashflow
- —
- DSCR
- —
- Eligible?
- —
Personal DTI + credit; lowest rate.
DSCR
20% down · 8.5% · 30yr
- Down + closing
- —
- Monthly P&I
- —
- Monthly cashflow
- —
- DSCR
- —
- Eligible?
- —
No personal income docs; deal must DSCR.
Hard money
10% down · 12.0% · 12mo
- Down + closing
- —
- Monthly P&I
- —
- Monthly cashflow
- —
- DSCR
- —
- Eligible?
- —
Short-term bridge; refi at stabilization.
Rent comps 3 comps
| Address | Beds | Baths | Sqft | Rent | $/sqft | DOM | Units | Dist |
|---|---|---|---|---|---|---|---|---|
| 3258 Lancing Ln Macon, GA | 3.0 | 2.0 | 1000 | $1,200 | $1.20 | 15d | 1 | 0.10mi |
| 3938 Kings Park Cir Macon, GA | 4.0 | 1.5 | 1200 | $1,400 | $1.17 | 15d | 1 | 0.11mi |
| 3722 Piedmont Dr Macon, GA | 3.0 | 1.0 | 780 | $895 | $1.15 | 15d | 1 | 0.12mi |
Listing history 22 events
-
2026-06-21days on market $150,000 Active 90 DOM
-
2026-06-19days on market $150,000 Active 88 DOM
-
2026-06-18days on market $150,000 Active 87 DOM
-
2026-06-17days on market $150,000 Active 86 DOM
-
2026-06-16days on market $150,000 Active 85 DOM
-
2026-06-15days on market $150,000 Active 84 DOM
-
2026-06-14days on market $150,000 Active 82 DOM
-
2026-06-13days on market $150,000 Active 81 DOM
-
2026-06-10days on market $150,000 Active 79 DOM
-
2026-06-09days on market $150,000 Active 78 DOM
-
2026-06-09days on market $150,000 Active 77 DOM
-
2026-06-07days on market $150,000 Active 76 DOM
-
2026-06-03days on market $150,000 Active 72 DOM
-
2026-06-02days on market $150,000 Active 71 DOM
-
2026-06-01days on market $150,000 Active 70 DOM
-
2026-05-31days on market $150,000 Active 69 DOM
-
2026-05-30days on market $150,000 Active 68 DOM
-
2026-04-26historical $1,350
-
2026-03-24$1,350
-
2026-03-17$150,000 New 929-char remark
Show marketing remark (929 chars)
Home is offered for sale and rent. Stunning new construction 2-story home designed with both comfort and style in mind. This thoughtfully crafted home offers LVP flooring, recessed lighting, and granite countertops in the modern kitchen. The open-concept living area creates an inviting space, perfect for entertaining and everyday living. The spacious primary bedroom is conveniently located on the main level, featuring a luxurious tile surround bathtub. Upstairs, you'll find two sizable bedrooms, including one with a private en-suite bathroom complete with a tile surround walk-in shower. This home combines affordable, efficient, and low-maintenance living with meticulous attention to detail inside and out. As an added bonus, the seller is offering a credit to be used towards closing costs. Don't miss this incredible opportunity to own a brand-new home at a price that won't break the bank! *Photos are of similar home*
-
2026-02-27historical
-
2025-11-29$170,000 New
ⓘ Source: listings_history table (triggers on properties + properties_extension) + one-shot
backfill from property_details.listing_events for pre-trigger history.
Climate risk First Street
- Flood 1/10 Low FEMA zone X (unshaded) · 0% chance over 30 yrs
- Wildfire 4/10 Moderate
- Heat 7/10 Severe 7 d/yr ≥107°F today · 17 d/yr by 30 yrs out
- Wind 6/10 Major 68% chance of damaging wind over 30 yrs
- Air quality 4/10 Moderate 5 unhealthy d/yr today · 5 by 30 yrs out
Nearby sold comps map
Loading sold comps map…
Walkable amenities ~0.75 mi
Loading nearby amenities…
Taxation est. · year 1
- Rental income
- $15,723
- − Mortgage interest
- −$8,402
- − Property taxes
- −$2,250
- − Insurance
- −$750
- − Repairs & maintenance
- −$1,258
- − Management
- −$1,258
- − Depreciation
- −$4,364
- Taxable loss
- −$2,559
- Est. tax savings @ 24.0%
- +$614
- After-tax cash flow
- $596/yr
For passive investors: Depreciation is non-cash, so a rental often shows a tax loss while cash-flowing — sheltering income. Rental losses are passive: they offset passive income freely, and up to $25,000/yr can offset ordinary (W-2) income if you actively participate and your MAGI is under $100k (phasing out to $0 by $150k); unused losses carry forward. On sale, claimed depreciation is recaptured at up to 25%, and gains may owe capital-gains tax (a 1031 exchange can defer both). Figures are a year-1 estimate at your 24.0% rate — not tax advice; consult a CPA.
Schools (NCES district)
- District
- Bibb County
- NCES district ID
- 1300420
- Math proficiency
- 11% ▼ -14.00%
- Reading proficiency
- 18% ▼ -11.00%
- Median HH income
- $37,426
- Composite
- 12.13/100
- National rank
- #9654
- State rank
- #161 of 174 in GA
Livability — Macon-Bibb County
No livability data for this city. (Only ~50 U.S. cities are tracked.)
Census & demographics
- Census place
- Macon-Bibb County, GA
- County
- Bibb County · 164,332 people
- City population
- 143,186
- Metro
- Macon-Bibb County, GA
- Population (ZIP)
- 17,732
- Household income
- $44,809
- Rent vs Own
- Severe rent burden
- 391.0
Population outlook (Bibb County) Hauer SSP2
- Today (2025)
- 148,772 people
- By 2030
- 145,904 · -1.9%
- By 2040
- 139,404 · -6.3%
- By 2050
- 131,603 · -11.5%
- By 2075
- 111,050 · -25.4%
- By 2100
- 83,346 · -44.0%
Race, ethnicity, and origin ACS 2023
- Neighborhood character
- Majority Black (57%)
- Race & ethnicity
- Black 57% White 38% Two or more races 4% Hispanic / Latino 2%
- Common ancestry
- Slovak 1% Italian 1%
- Foreign-born
- 1% · Canada
- Languages at home
- 98% English-only · Spanish 1%
Political lean MEDSL · Bibb
- 2024 margin
- Strong D (+22.4) · D 61.0% · R 38.5%
- 2008→2024 swing
- +4.4pp toward D · 2008: 18.0pp · 2024: 22.4pp
- All cycles
- 2024: D+22.4 2020: D+23.8 2016: D+20.2 2012: D+20.0 2008: D+18.0
Not yet ingested
- Civics
- —
Market trends
- HPI YoY
- ▲ 4.31%
- Current HPI
- 209.9166
- Rent YoY
- ▲ 10.85%
- Metro
- Macon-Bibb County, GA
- State GDP YoY
- ▲ 2.66%
- F500 in state
- 28
Industry mix (Fortune 500 HQ in GA)
| Industry | F500 HQs | Revenue |
|---|---|---|
| Paper / Packaging | 2 | $29B |
|
||
| Retail | 1 | $160B |
|
||
| Transportation / Logistics | 1 | $91B |
|
||
| Airlines | 1 | $62B |
|
||
| Consumer Goods | 1 | $47B |
|
||
| Utilities | 1 | $25B |
|
||
Price history
-99.2% since first listed5 events — show timeline
- 2026-04-26 Rental Removed $1,350 GAMLS
- 2026-03-24 Listed for Rent $1,350 GAMLS
- 2026-03-17 Listed $150,000 GAMLS
- 2026-02-27 Listing Removed — GAMLS
- 2025-11-29 Listed $170,000 GAMLS
Property tax history
-19.3%/yrLatest (2023): $51 · -38.3% YoY. Source: county tax records.
Cash-flow waterfall
monthlySold comps — $/sqft
last 12 mo · ≤1 miLoading sold comps…