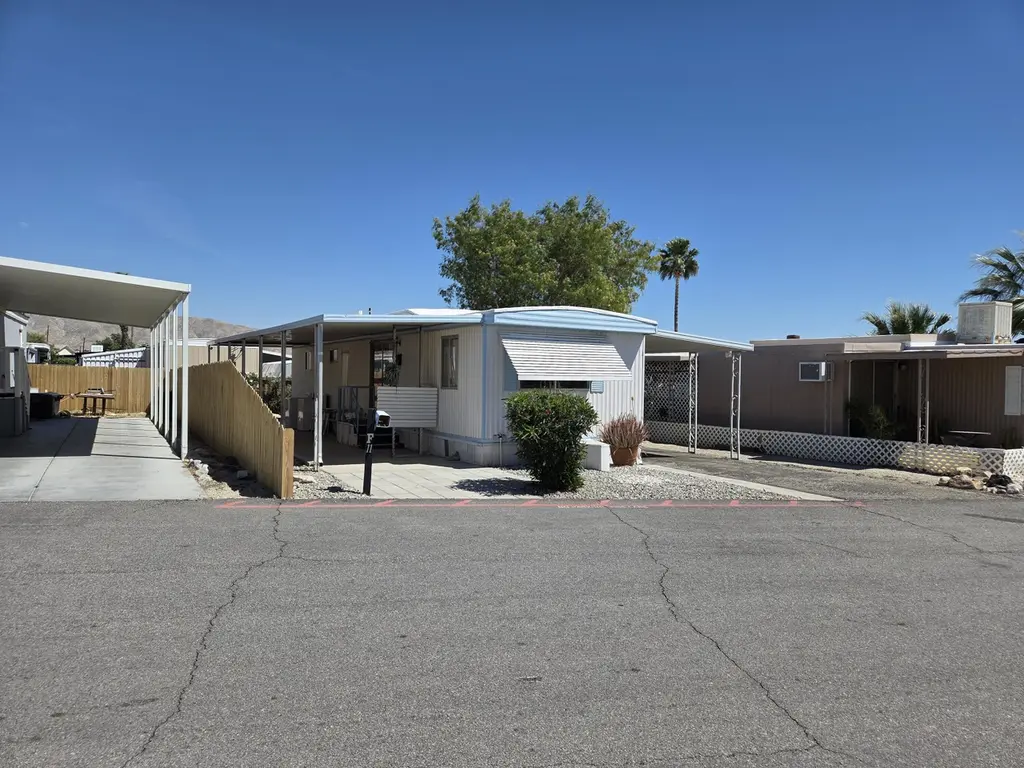
64625 Pierson Blvd · Desert Hot Springs, CA
Flood risk 1/10 · Minimal
- FEMA flood zone
- AO
- Chance of flooding over 30 yrs
- 0.0%
- Est. flood insurance / yr
- $848 – $2,087
Fire risk 6/10 · Moderate
- Est. fire insurance / yr
- $659 – $1,223
Heat risk 8/10 · Major
- Hot days now (above 110°F)
- 5 days/yr
- Hot days in 30 yrs
- 13 days/yr
Wind risk 1/10 · Minimal
- Chance of severe wind over 30 yrs
- —
Air-quality risk 5/10 · Moderate
- Unhealthy air days now
- 7 days/yr
- Unhealthy air days in 30 yrs
- 10 days/yr
Risk factors via First Street. Map © Google.
Why this score? — see what drove the D grade
The composite is a weighted blend of 9 inputs, each scored 0–100. Each bar is that input's sub-score; the figure is the points it added to the 100-point composite (weight × sub-score).
- Cash flow +15.0/30.0
- ARV discount +7.5/15.0
- 1% rule +5.0/10.0
- DSCR +5.0/10.0
- Rent growth +3.4/5.0
- Schools +2.7/10.0
- Livability +2.5/5.0
- Condition / age +2.5/5.0
- Appreciation +0.0/10.0
$37,500
🖨 Deal sheet 📄 Offer letter ✓ Due diligence
Listing remarks MLS
Welcome to Space F-11 in Park West, an all-age community. This lovely 1967, 624 sq. ft. , one-bedroom, one-bath Skyline home is ready for you to move in and enjoy the desert lifestyle. The home's primary entrance is through the sliding glass doors accessed by the north-facing covered patio. An additional window in the living room allows an abundance of natural light to enter. The kitchen has ample storage, full size refrigerator, natural gas wall oven, natural gas cooktop and hood fan, and just the right amount of counter space. A short hallway leads to the private quarters and holds a linen closet and the homes furnace. The bathroom has has shower over tub, single-basin vanity, and toilet. At the opposite end of the home from the kitchen is the bedroom with dual closets, and a wall-mounted A/C unit, which allows one to cool only the bedroom to help keep the electricity bill low. Beneath the carport awning is a shed and room for a single car with enough space for a second vehicle to be parked behind it in tandem uncovered. Laundry facilities (W/ D) have been installed on the home's patio. Park approval is required. Visit the park office for an application or go online to ParkWestMHP.com for an application. Call today to schedule your private showing.
Key facts
- Natural gas cooktop
- Dual closets
- Ample storage
Tags
Neighborhood map
What this means for you Summary
Snapshot
- This is a 2-bed/2.0-bath manufactured listed at $38k.
Deal economics
- At list price, monthly cash flow is $1k ($16k/yr) — positive.
- The deal already cash-flows at list — no discount required.
- Meets the 1% rule at list price ($2k rent vs $38k).
- Recommended offer: $35k (6.0% below list) — sets the bar for market timing.
- Cap rate 53.9% vs local median 4.0% in Desert Hot Springs — top-decile yield for the area; either an underpriced asset or a hidden risk that comps aren't pricing in. Stress-test before assuming the spread holds.
Location & tenants
- Location reads 49/100 on livability (#1,149 in CA) — a working-class tenant base; expect higher turnover. Strengths: housing B+; Watch: crime D+, schools F, amenities F.
- Palm Springs Unified (suburban): math 21% / reading 42% proficiency, ranked #328 of 517 in CA (top 63%) — families likely to look elsewhere, expect single-tenant / working-renter base with shorter leases; 73% free/reduced lunch — lower-income household profile, screen leases tightly.
- Market conditions: Rents rising (+3.7%/yr); 515 active listings in the ZIP; 6 comparable units currently listed for rent nearby; rentals lingering (median 44d on market — plan ~5-8 weeks vacancy on turnover, expect pricing pressure); 50% of comp listings sitting > 30 days — soft ceiling on asking rent; 9,195 units permitted in Riverside County in 2024 (1,512 in 5+ unit buildings).
- At $2,178/mo this rent would consume 48% of the median local household income ($54k/yr) (locally 2095% of renters already pay >50% of income on rent) — very limited rent-growth headroom before tenants either downsize or default.
Forward outlook
- Local home prices are declining (-3.0%/yr); year-one equity from $259 of loan paydown is wiped out by about $1k of value loss. Plan a longer hold.
- Riverside County population projected at +22% by 2050 — long-run rental-demand tailwind backs the buy-and-hold thesis.
- At projected returns (-3.0% appreciation + 3.7% rent growth), your $10k cash investment doubles in ~1 year — after that, you're playing with house money.
Negotiation context
- It's been on market 83 days — a 6% lower offer ($35k) is reasonable based on typical stale-listing flexibility.
- 3 sale attempts since 12y ago; this cycle's ask has dropped $5k (12%) from the opening price — seller is motivated, your offer sets the floor, not the list.
Risks & watch-outs
- Watch-outs: flood insurance adds $122/mo.
- Climate carrying-cost: in FEMA flood zone AO (mandatory federal flood insurance); major wildfire risk; extreme-heat days projected 5→13/yr by 2055 (HVAC capex compounding) — expect insurance premiums to compound above CPI over the hold.
Questions for the listing agent
- It's been on market 83 days. Have you received any prior offers? Is the seller open to a 6% concession, seller financing, or rate buy-down credit?
- Built in 1967 — when were the roof, HVAC, electrical panel, plumbing, and water heater last replaced?
- What's the actual annual flood-insurance premium (NFIP or private), and is the property in a SFHA with mandatory coverage?
- Why hasn't it sold? Are there any deal-killer items the seller is aware of (foundation, flood, title, zoning, code violations)?
- Is there a deadline driving the sale (1031 exchange, divorce, estate, relocation)? That informs how much negotiation room exists.
- Schools are F-rated, which usually means shorter tenancies and higher turnover. Who's the typical renter profile here, and what's been the actual vacancy rate?
- Crime grade is D in this area — have there been break-ins, vandalism, or insurance claims at this property in the last 3 years? What carrier currently insures it and at what premium?
- The area grade is low — what's the realistic commute time and amenity access for the typical tenant pool here? Any planned neighborhood developments (good or bad) we should know about?
- What's the average days-on-market for RENTAL listings here right now (not sales)? A rising rental-DOM trend means longer vacancies and softer asking-rent achievability than the comps imply.
- What's the recent tenant-quality profile in this submarket — average credit score on applications, eviction rate, late-payment / NSF rate, and stable-employment percentage? A property-management company in the area should have these aggregated.
- How much new for-sale + rental construction is in the pipeline within 1–3 miles? Heavy new supply typically softens prices + rents 12–24 months out; constrained supply supports both.
Investment metrics
- 1% rule
- 5.81% ✓
- Cap rate
- 53.86%
- Cash-on-cash
- 169.88%
- DSCR
- 8.56
- GRM
- 1.4
CMA / ARV
- ARV (median comp)
- $24,630
- List price
- $37,500
- Delta
- 52.25%
- Verdict
- OVERPRICED
- Comps
- 1 within 2.0 mi
Show comp detail 8 sales within ~0.75 mi
| Address | Dist | Beds/Ba | Sqft | Sold | Price | $/sf | Match |
|---|---|---|---|---|---|---|---|
| 64550 Pierson Blvd #98 | 0.27mi | 3/2.0 (+1) | 1,248 (0%) | 3mo | $95,000 | $76 | 80 |
| 64550 Pierson Blvd #25 | 0.24mi | 2/2.0 | 1,215 (-3%) | 5mo | $100,000 | $82 | 80 |
| 64625 Pierson Blvd Unit A20 | 0.11mi | 3/2.0 (+1) | 1,320 (+6%) | 1mo | $142,000 | $108 | 80 |
| 64550 Pierson Blvd #56 | 0.27mi | 2/2.0 | 1,248 (0%) | 13mo | $61,000 | $49 | 76 |
| 64625 Pierson Blvd Unit B21 | 0.07mi | 2/2.0 | 1,120 (-10%) | 23mo | $75,000 | $67 | 60 |
| 64625 Pierson Blvd Unit A32 | 0.07mi | 3/2.0 (+1) | 1,400 (+12%) | 19mo | $95,000 | $68 | 55 |
| 64550 Pierson Blvd #3 | 0.27mi | 3/2.0 (+1) | 1,104 (-12%) | 11mo | $105,000 | $95 | 54 |
| 64550 Pierson Blvd #12 | 0.24mi | 3/2.0 (+1) | 1,060 (-15%) | 8mo | $83,000 | $78 | 52 |
Match score weights: distance 35% · size 25% · config 20% · recency 20%. Top-matched comps best support the ARV.
Projected returns pro-forma
-3.0% appreciation · 3.66% rent growth · sell at horizon
- IRR
- —
- Equity multiple
- 8.84×
- Total profit
- $82,358
- Equity at exit
- $5,591
- IRR
- —
- Equity multiple
- 19.10×
- Total profit
- $190,028
- Equity at exit
- $3,242
Cash invested: $10,500 (down + closing). Projections, not guarantees.
Landlord ↔ Tenant lean methodology
- Overall (STATE)
- 18 Strongly Tenant-Friendly
- State California
- 18 Strongly Tenant-Friendly · D+13
- County
- — inherits STATE
- City
- — inherits STATE
ZIP-level market 92240
- Home prices YoY
- -19.6%
- Rents YoY
- 3.7%
- Active inventory
- 515
- Price-to-rent
- 1.4×
Monthly cashflow live
- Estimated rent
- $2,178 high interval (Pro) →
- Mortgage (P&I)
- −$197
- Tax from tax record
- −$22 /mo · $266/yr
- Insurance
- −$16
- Flood insurance flood zone
- −$122 /mo · $1,468/yr
- HOA
- −$0
- Vacancy / Maint / Mgmt
- −$457
- Net cashflow
- $1,364
Break-even live
UW: 25.0% down · 7.5% · 30yr · 1.5% tax · 5.0% vac · 8.0% maint · 8.0% mgmt
Financing live
Cash to close
- Down payment
- $9,375
- Closing costs
- $1,125
- Reserves months
- —
- Total cash needed
- —
Loan-product check · same deal, 3 products live
Conventional
25% down · 7.5% · 30yr
- Down + closing
- —
- Monthly P&I
- —
- Monthly cashflow
- —
- DSCR
- —
- Eligible?
- —
Personal DTI + credit; lowest rate.
DSCR
20% down · 8.5% · 30yr
- Down + closing
- —
- Monthly P&I
- —
- Monthly cashflow
- —
- DSCR
- —
- Eligible?
- —
No personal income docs; deal must DSCR.
Hard money
10% down · 12.0% · 12mo
- Down + closing
- —
- Monthly P&I
- —
- Monthly cashflow
- —
- DSCR
- —
- Eligible?
- —
Short-term bridge; refi at stabilization.
Rent comps 6 comps
| Address | Beds | Baths | Sqft | Rent | $/sqft | DOM | Units | Dist |
|---|---|---|---|---|---|---|---|---|
| 65568 Acoma Ave Desert Hot Springs, CA | 2.0 | 2.5 | 1320 | $2,095 | $1.59 | 15d | 1 | 0.93mi |
| 65565 Acoma Ave #49 Desert Hot Springs, CA | 3.0 | 2.0 | 1396 | $2,300 | $1.65 | 44d | 1 | 0.95mi |
| 65841 6th St Desert Hot Springs, CA | 2.0 | 2.0 | 1204 | $2,250 | $1.87 | 44d | 1 | 1.30mi |
| 13322 El Rio Ln Desert Hot Springs, CA | 3.0 | 2.0 | 1215 | $2,750 | $2.26 | 44d | 1 | 1.33mi |
| 13715 El Rio Ln Desert Hot Springs, CA | 3.0 | 2.0 | 1318 | $2,600 | $1.97 | 8d | 1 | 1.40mi |
| 66051 3rd St Desert Hot Springs, CA | 2.0 | 1.0 | 760 | $1,675 | $2.20 | 24d | 1 | 1.45mi |
Listing history 21 events
-
2026-06-18days on market $37,500 Active 83 DOM
-
2026-06-17days on market $37,500 Active 82 DOM
-
2026-06-16days on market $37,500 Active 81 DOM
-
2026-06-15days on market $37,500 Active 80 DOM
-
2026-06-13days on market $37,500 Active 78 DOM
-
2026-06-13pricedays on market $37,500 Active 77 DOM
-
2026-06-09days on market $42,500 Active 74 DOM
-
2026-06-08days on market $42,500 Active 73 DOM
-
2026-06-07days on market $42,500 Active 72 DOM
-
2026-06-04days on market $42,500 Active 69 DOM
-
2026-06-03days on market $42,500 Active 68 DOM
-
2026-06-02days on market $42,500 Active 67 DOM
-
2026-06-01days on market $42,500 Active 66 DOM
-
2026-05-31days on market $42,500 Active 65 DOM
-
2026-03-25$42,500 Active 1270-char remark
Show marketing remark (1270 chars)
Welcome to Space F-11 in Park West, an all-age community. This lovely 1967, 624 sq. ft. , one-bedroom, one-bath Skyline home is ready for you to move in and enjoy the desert lifestyle. The home's primary entrance is through the sliding glass doors accessed by the north-facing covered patio. An additional window in the living room allows an abundance of natural light to enter. The kitchen has ample storage, full size refrigerator, natural gas wall oven, natural gas cooktop and hood fan, and just the right amount of counter space. A short hallway leads to the private quarters and holds a linen closet and the homes furnace. The bathroom has has shower over tub, single-basin vanity, and toilet. At the opposite end of the home from the kitchen is the bedroom with dual closets, and a wall-mounted A/C unit, which allows one to cool only the bedroom to help keep the electricity bill low. Beneath the carport awning is a shed and room for a single car with enough space for a second vehicle to be parked behind it in tandem uncovered. Laundry facilities (W/ D) have been installed on the home's patio. Park approval is required. Visit the park office for an application or go online to ParkWestMHP.com for an application. Call today to schedule your private showing.
-
2014-07-16historical
-
2014-05-13status Active
-
2014-04-25historical
-
2014-04-03price $11,000
-
2014-02-21price $18,000
-
2014-02-05$19,000 Active
ⓘ Source: listings_history table (triggers on properties + properties_extension) + one-shot
backfill from property_details.listing_events for pre-trigger history.
Tax reassessment forecast CA · Resets to sale price
- Current annual tax
- $266 · $22/mo
- Projected year-2 tax
- $285 · $24/mo
- Expected delta
- +$19/yr (+$2/mo · 7.1%)
ⓘ Screening estimate from a state-policy table — verify with the county assessor before closing.
Climate risk First Street
- Flood 1/10 Low FEMA zone AO · 0% chance over 30 yrs
- Wildfire 6/10 Major
- Heat 8/10 Severe 5 d/yr ≥110°F today · 13 d/yr by 30 yrs out
- Wind 1/10 Low
- Air quality 5/10 Major 7 unhealthy d/yr today · 10 by 30 yrs out
Nearby sold comps map
Loading sold comps map…
Walkable amenities ~0.75 mi
Loading nearby amenities…
Taxation est. · year 1
- Rental income
- $26,141
- − Mortgage interest
- −$2,101
- − Property taxes
- −$266
- − Insurance
- −$1,655
- − Repairs & maintenance
- −$2,091
- − Management
- −$2,091
- − Depreciation
- −$1,091
- Taxable income
- $16,846
- Est. tax owed @ 24.0%
- −$4,043
- After-tax cash flow
- $12,327/yr
For passive investors: Depreciation is non-cash, so a rental often shows a tax loss while cash-flowing — sheltering income. Rental losses are passive: they offset passive income freely, and up to $25,000/yr can offset ordinary (W-2) income if you actively participate and your MAGI is under $100k (phasing out to $0 by $150k); unused losses carry forward. On sale, claimed depreciation is recaptured at up to 25%, and gains may owe capital-gains tax (a 1031 exchange can defer both). Figures are a year-1 estimate at your 24.0% rate — not tax advice; consult a CPA.
Schools (NCES district)
- District
- Palm Springs Unified
- NCES district ID
- 0629550
- Math proficiency
- 21% ▼ -7.00%
- Reading proficiency
- 42% ▬ 0.00%
- Median HH income
- $43,638
- Composite
- 26.76/100
- National rank
- #7131
- State rank
- #328 of 517 in CA
Livability — Desert Hot Springs
- Score
- 49/100
- State rank
- #1149
- US rank
- #25774
Category grades
Schools grade is shown separately in the Schools card above.
Census & demographics
- County
- Riverside County · 2,287,001 people
- City population
- 41,615
- Metro
- Riverside-San Bernardino-Ontario, CA
- Population (ZIP)
- 41,615
- Household income
- $54,023
- Rent vs Own
- Severe rent burden
- 2095.0
Population outlook (Riverside County) Hauer SSP2
- Today (2025)
- 2,664,475 people
- By 2030
- 2,802,692 · +5.2%
- By 2040
- 3,050,904 · +14.5%
- By 2050
- 3,256,783 · +22.2%
- By 2075
- 3,655,058 · +37.2%
- By 2100
- 3,766,594 · +41.4%
Race, ethnicity, and origin ACS 2023
- Neighborhood character
- Majority Hispanic (64%)
- Race & ethnicity
- Hispanic / Latino 64% Two or more races 27% White 23% Black 7% Native American 2% Asian 2%
- Hispanic origin (detail)
- Mexican 53%
- Common ancestry
- Lithuanian 1% Romanian 1% Italian 1%
- Foreign-born
- 27% · Canada, Vietnam
- Languages at home
- 47% English-only · Spanish 50% Russian/Polish/Slavic 1%
Political lean MEDSL · Riverside
- 2024 margin
- Toss-up / Even · D 48.0% · R 49.3% · Other 2.6%
- 2008→2024 swing
- -3.6pp toward R · 2008: 2.3pp · 2024: -1.3pp
- All cycles
- 2024: R+1.3 2020: D+8.0 2016: D+4.3 2012: R+0.4 2008: D+2.3
Not yet ingested
- Civics
- —
Market trends
- HPI YoY
- ▼ -102.10%
- Current HPI
- 418.4691
- Rent YoY
- ▲ 3.66%
- Metro
- Riverside-San Bernardino-Ontario, CA
- State GDP YoY
- ▲ 3.21%
- F500 in state
- 116
Industry mix (Fortune 500 HQ in CA)
| Industry | F500 HQs | Revenue |
|---|---|---|
| Technology | 27 | $1,492B |
|
||
| Financial Services | 3 | $174B |
|
||
| Retail | 3 | $44B |
|
||
| Insurance | 3 | $26B |
|
||
| Media / Entertainment | 2 | $115B |
|
||
| Pharmaceuticals / Biotech | 2 | $62B |
|
||
Price history
+123.7% since first listed7 events — show timeline
- 2026-03-25 Listed $42,500 GPSMLS
- 2014-07-16 Listing Removed — GPSMLS
- 2014-05-13 Relisted — GPSMLS
- 2014-04-25 Listing Removed — GPSMLS
- 2014-04-03 Price Changed $11,000 GPSMLS
- 2014-02-21 Price Changed $18,000 GPSMLS
- 2014-02-05 Listed $19,000 GPSMLS
Property tax history
+1.3%/yrLatest (2025): $266 · -2.1% YoY. Source: county tax records.
Cash-flow waterfall
monthlySold comps — $/sqft
last 12 mo · ≤1 miLoading sold comps…