122 Diablo Loop · Elgin, TX
Flood risk No data
- FEMA flood zone
- —
- Chance of flooding over 30 yrs
- —
- Est. flood insurance / yr
- —
Fire risk No data
- Est. fire insurance / yr
- —
Heat risk No data
- Hot days now (above threshold)
- —
- Hot days in 30 yrs
- —
Wind risk No data
- Chance of severe wind over 30 yrs
- —
Air-quality risk No data
- Unhealthy air days now
- —
- Unhealthy air days in 30 yrs
- —
Risk factors via First Street. Map © Google.
Why this score? — see what drove the D- grade
The composite is a weighted blend of 9 inputs, each scored 0–100. Each bar is that input's sub-score; the figure is the points it added to the 100-point composite (weight × sub-score).
- Appreciation +10.0/10.0
- ARV discount +8.2/15.0
- Cash flow +6.7/30.0
- Livability +3.7/5.0
- Rent growth +3.3/5.0
- Condition / age +2.5/5.0
- Schools +2.0/10.0
- 1% rule +1.7/10.0
- DSCR +1.0/10.0
$299,900
🖨 Deal sheet 📄 Offer letter ✓ Due diligence
Listing remarks MLS
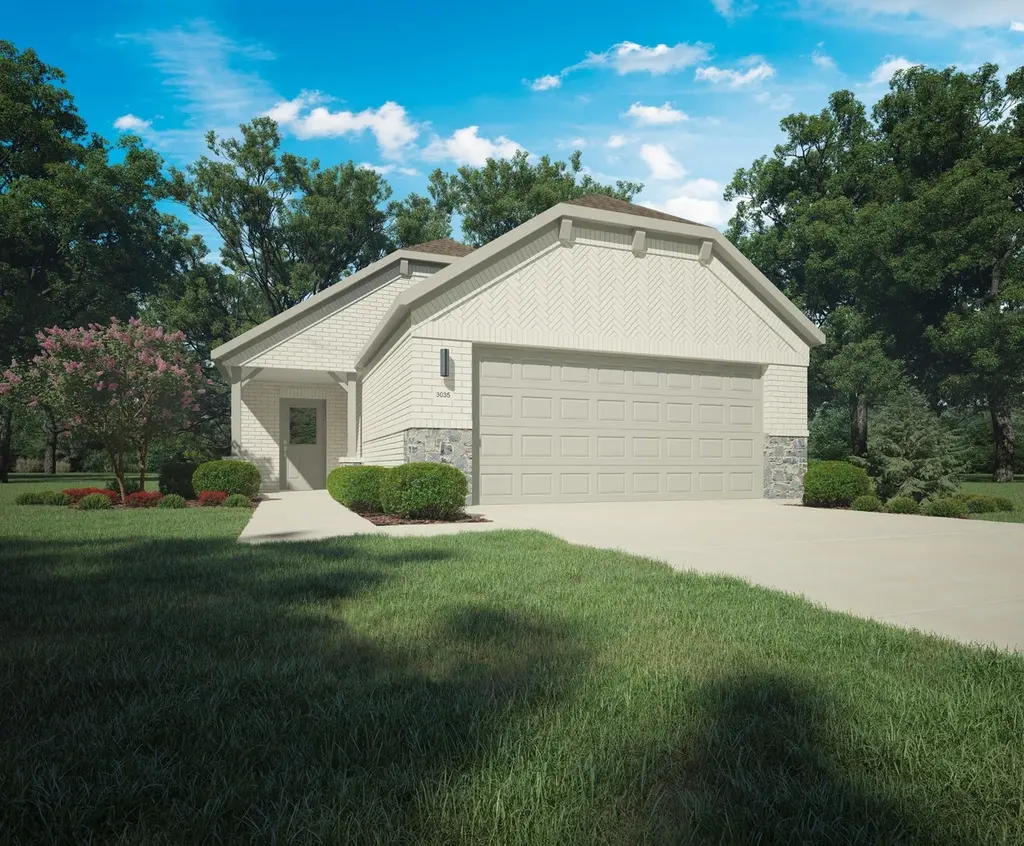
The birch tree represents new beginnings and what better place to start anew than with a floor plan bearing the same name? Invite new neighbors over for a housewarming party featuring stuffed mushrooms. The secret ingredient is the gourmet kitchen you used to make them in. There's plenty of room to entertain in the airy great room, but with the patio door open, guests can enjoy fresh air. When conversation turns to work, take them to see the bedroom you converted into a home office. The spacious closet is perfect for storing supplies. After the party, snuggle with your spouse in the lovely primary suite. You made some great new friends today.
Key facts
- Gourmet kitchen
- Airy great room
- Spacious closet
Tags
Neighborhood map
What this means for you Summary
Snapshot
- This is a 3-bed/2.0-bath single-family listed at $300k.
Deal economics
- At list price, monthly cash flow is $-475 ($-6k/yr) — negative.
- To cash-flow at today's rent, offer at most $231k (22.9% below list).
- To meet the 1% rule (rent ≥ 1% of price), the offer needs to be $202k (32.6% below list).
- Recommended offer: $202k (32.6% below list) — sets the bar for 1% rule.
Location & tenants
- Location reads 74/100 on livability (#167 in TX, #4,404 nationally) — a middle-class / working-renter tenant base. Strengths: cost of living A+, housing A+, health & safety A+; Watch: schools F, amenities F, commute F.
- Elgin ISD (rural): math 17% / reading 26% proficiency, ranked #741 of 826 in TX (top 90%) — low school quality limits family demand, transient renter base, plan for 1-2y turnover; 67% free/reduced lunch — lower-income household profile, screen leases tightly.
- Market conditions: Rents rising (+3.1%/yr); 807 active listings in the ZIP; 6 comparable units currently listed for rent nearby; rentals lingering (median 44d on market — plan ~5-8 weeks vacancy on turnover, expect pricing pressure); 50% of comp listings sitting > 30 days — soft ceiling on asking rent; solid renter incomes; 1,841 units permitted in Bastrop County in 2024 (150 in 5+ unit buildings).
Forward outlook
- In year one you build about $32k of equity ($2k loan paydown + $30k appreciation (10.0% local appreciation)).
- Bastrop County population projected at +37% by 2050 — long-run rental-demand tailwind backs the buy-and-hold thesis.
- By year 2, paydown + projected appreciation supports a ~$52k cash-out refi (75% LTV) — recoverable capital for the next deal without selling this one.
Negotiation context
- It's been on market 781 days — a 12% lower offer ($264k) is reasonable based on typical stale-listing flexibility.
Questions for the listing agent
- What do current leases actually rent for vs. the listed asking? Can we see a recent rent roll and the last 12 months of T-12 income?
- It's been on market 781 days. Have you received any prior offers? Is the seller open to a 33% concession, seller financing, or rate buy-down credit?
- Why hasn't it sold? Are there any deal-killer items the seller is aware of (foundation, flood, title, zoning, code violations)?
- Is there a deadline driving the sale (1031 exchange, divorce, estate, relocation)? That informs how much negotiation room exists.
- Schools are F-rated, which usually means shorter tenancies and higher turnover. Who's the typical renter profile here, and what's been the actual vacancy rate?
- The area grade is low — what's the realistic commute time and amenity access for the typical tenant pool here? Any planned neighborhood developments (good or bad) we should know about?
- What's the average days-on-market for RENTAL listings here right now (not sales)? A rising rental-DOM trend means longer vacancies and softer asking-rent achievability than the comps imply.
- What's the recent tenant-quality profile in this submarket — average credit score on applications, eviction rate, late-payment / NSF rate, and stable-employment percentage? A property-management company in the area should have these aggregated.
- How much new for-sale + rental construction is in the pipeline within 1–3 miles? Heavy new supply typically softens prices + rents 12–24 months out; constrained supply supports both.
Investment metrics
- 1% rule
- 0.67% ✗
- Cap rate
- 4.39%
- Cash-on-cash
- -6.79%
- DSCR
- 0.70
- GRM
- 12.4
CMA / ARV
- ARV (median comp)
- $304,894
- List price
- $299,900
- Delta
- -1.64%
- Verdict
- FAIR
- Comps
- 20 within 1.0 mi
Show comp detail 12 sales within ~0.75 mi
| Address | Dist | Beds/Ba | Sqft | Sold | Price | $/sf | Match |
|---|---|---|---|---|---|---|---|
| 126 Two Bits Ln | 0.20mi | 3/2.0 | 1,388 (+7%) | 2mo | $259,990 | $187 | 77 |
| 158 Two Bits Ln | 0.19mi | 3/2.0 | 1,388 (+7%) | 3mo | $259,490 | $187 | 77 |
| 142 Two Bits Ln | 0.19mi | 3/2.0 | 1,388 (+7%) | 3mo | $260,990 | $188 | 77 |
| 148 Two Bits Ln | 0.19mi | 3/2.0 | 1,388 (+7%) | 4mo | $258,990 | $187 | 76 |
| 137 Two Bits Ln | 0.22mi | 3/2.0 | 1,388 (+7%) | 3mo | $267,990 | $193 | 76 |
| 153 Two Bits Ln | 0.22mi | 3/2.0 | 1,388 (+7%) | 4mo | $261,990 | $189 | 75 |
| 330 Bendecido Loop | 0.26mi | 3/2.0 | 1,482 (+14%) | 4mo | $299,265 | $202 | 61 |
| 140 Tolo Dr | 0.40mi | 3/2.0 | 1,487 (+15%) | 0mo | $253,990 | $171 | 56 |
| 445 Lucky Ave | 0.40mi | 3/2.0 | 1,487 (+15%) | 2mo | $276,990 | $186 | 56 |
| 150 Tolo Dr | 0.41mi | 3/2.0 | 1,487 (+15%) | 1mo | $284,990 | $192 | 55 |
| 153 Tolo Dr | 0.44mi | 3/2.0 | 1,482 (+14%) | 2mo | $299,990 | $202 | 54 |
| 131 Tolo Dr | 0.41mi | 3/2.0 | 1,482 (+14%) | 3mo | $284,990 | $192 | 54 |
Match score weights: distance 35% · size 25% · config 20% · recency 20%. Top-matched comps best support the ARV.
Projected returns pro-forma
10.0% appreciation · 3.12% rent growth · sell at horizon
- IRR
- 19.5%
- Equity multiple
- 2.59×
- Total profit
- $133,333
- Equity at exit
- $270,174
- IRR
- 18.0%
- Equity multiple
- 5.97×
- Total profit
- $417,011
- Equity at exit
- $582,640
Cash invested: $83,972 (down + closing). Projections, not guarantees.
Landlord ↔ Tenant lean methodology
- Overall (STATE)
- 87 Strongly Landlord-Friendly
- State Texas
- 87 Strongly Landlord-Friendly · R+5
- County
- — inherits STATE
- City
- — inherits STATE
ZIP-level market 78621
- Home prices YoY
- 7.6%
- Rents YoY
- 3.1%
- Active inventory
- 807
- Price-to-rent
- 12.4×
Monthly cashflow live
- Estimated rent
- $2,022 high interval (Pro) →
- Mortgage (P&I)
- −$1,573
- Tax est. 1.5%
- −$375 /mo · $4,498/yr
- Insurance
- −$125
- HOA
- −$0
- Vacancy / Maint / Mgmt
- −$425
- Net cashflow
- $-475
Break-even live
UW: 25.0% down · 7.5% · 30yr · 1.5% tax · 5.0% vac · 8.0% maint · 8.0% mgmt
Financing live
Cash to close
- Down payment
- $74,975
- Closing costs
- $8,997
- Reserves months
- —
- Total cash needed
- —
Loan-product check · same deal, 3 products live
Conventional
25% down · 7.5% · 30yr
- Down + closing
- —
- Monthly P&I
- —
- Monthly cashflow
- —
- DSCR
- —
- Eligible?
- —
Personal DTI + credit; lowest rate.
DSCR
20% down · 8.5% · 30yr
- Down + closing
- —
- Monthly P&I
- —
- Monthly cashflow
- —
- DSCR
- —
- Eligible?
- —
No personal income docs; deal must DSCR.
Hard money
10% down · 12.0% · 12mo
- Down + closing
- —
- Monthly P&I
- —
- Monthly cashflow
- —
- DSCR
- —
- Eligible?
- —
Short-term bridge; refi at stabilization.
Rent comps 6 comps
| Address | Beds | Baths | Sqft | Rent | $/sqft | DOM | Units | Dist |
|---|---|---|---|---|---|---|---|---|
| 108 Bendecido Loop Elgin, TX | 3.0 | 2.0 | 1300 | $1,950 | $1.50 | 17d | 1 | 0.04mi |
| 110 S Main St #104 Elgin, TX | 3.0 | 2.0 | 1061 | $1,700 | $1.60 | 43d | 1 | 1.03mi |
| 120 Jim Dandy Dr Elgin, TX | 4.0 | 2.0 | 1650 | $1,923 | $1.17 | 4d | 1 | 1.07mi |
| 204 Hall St Unit A Elgin, TX | 2.0 | 1.0 | 910 | $1,195 | $1.31 | 1d | 1 | 1.14mi |
| 102 Schuylerville Dr Elgin, TX | 3.0 | 2.0 | 1479 | $1,800 | $1.22 | 43d | 1 | 1.23mi |
| 200 Maple Ln Elgin, TX | 2.0 | 2.0 | 891 | $1,400 | $1.57 | 43d | 1 | 1.31mi |
Listing history 16 events
-
2026-06-18days on market $299,900 Active 781 DOM
-
2026-06-17days on market $299,900 Active 780 DOM
-
2026-06-16days on market $299,900 Active 779 DOM
-
2026-06-15days on market $299,900 Active 778 DOM
-
2026-06-13days on market $299,900 Active 776 DOM
-
2026-06-09days on market $299,900 Active 772 DOM
-
2026-06-08days on market $299,900 Active 771 DOM
-
2026-06-07days on market $299,900 Active 770 DOM
-
2026-06-04days on market $299,900 Active 767 DOM
-
2026-06-03days on market $299,900 Active 766 DOM
-
2026-06-02days on market $299,900 Active 765 DOM
-
2026-06-01days on market $299,900 Active 764 DOM
-
2026-05-31days on market $299,900 Active 763 DOM
-
2024-05-14price $299,900 650-char remark
Show marketing remark (650 chars)
The birch tree represents new beginnings and what better place to start anew than with a floor plan bearing the same name? Invite new neighbors over for a housewarming party featuring stuffed mushrooms. The secret ingredient is the gourmet kitchen you used to make them in. There's plenty of room to entertain in the airy great room, but with the patio door open, guests can enjoy fresh air. When conversation turns to work, take them to see the bedroom you converted into a home office. The spacious closet is perfect for storing supplies. After the party, snuggle with your spouse in the lovely primary suite. You made some great new friends today.
-
2024-04-30historical 650-char remark
Show marketing remark (650 chars)
The birch tree represents new beginnings and what better place to start anew than with a floor plan bearing the same name? Invite new neighbors over for a housewarming party featuring stuffed mushrooms. The secret ingredient is the gourmet kitchen you used to make them in. There's plenty of room to entertain in the airy great room, but with the patio door open, guests can enjoy fresh air. When conversation turns to work, take them to see the bedroom you converted into a home office. The spacious closet is perfect for storing supplies. After the party, snuggle with your spouse in the lovely primary suite. You made some great new friends today.
-
2024-04-29$301,900 Active 650-char remark
Show marketing remark (650 chars)
The birch tree represents new beginnings and what better place to start anew than with a floor plan bearing the same name? Invite new neighbors over for a housewarming party featuring stuffed mushrooms. The secret ingredient is the gourmet kitchen you used to make them in. There's plenty of room to entertain in the airy great room, but with the patio door open, guests can enjoy fresh air. When conversation turns to work, take them to see the bedroom you converted into a home office. The spacious closet is perfect for storing supplies. After the party, snuggle with your spouse in the lovely primary suite. You made some great new friends today.
ⓘ Source: listings_history table (triggers on properties + properties_extension) + one-shot
backfill from property_details.listing_events for pre-trigger history.
Nearby sold comps map
Loading sold comps map…
Walkable amenities ~0.75 mi
Loading nearby amenities…
Taxation est. · year 1
- Rental income
- $24,261
- − Mortgage interest
- −$16,799
- − Property taxes
- −$4,498
- − Insurance
- −$1,500
- − Repairs & maintenance
- −$1,941
- − Management
- −$1,941
- − Depreciation
- −$8,724
- Taxable loss
- −$11,142
- Est. tax savings @ 24.0%
- +$2,674
- After-tax cash flow
- $-3,030/yr
For passive investors: Depreciation is non-cash, so a rental often shows a tax loss while cash-flowing — sheltering income. Rental losses are passive: they offset passive income freely, and up to $25,000/yr can offset ordinary (W-2) income if you actively participate and your MAGI is under $100k (phasing out to $0 by $150k); unused losses carry forward. On sale, claimed depreciation is recaptured at up to 25%, and gains may owe capital-gains tax (a 1031 exchange can defer both). Figures are a year-1 estimate at your 24.0% rate — not tax advice; consult a CPA.
Schools (NCES district)
- District
- Elgin ISD
- NCES district ID
- 4818360
- Math proficiency
- 17% ▼ -9.00%
- Reading proficiency
- 26% ▼ -5.00%
- Median HH income
- $55,176
- Composite
- 19.62/100
- National rank
- #8749
- State rank
- #741 of 826 in TX
Livability — Elgin
- Score
- 74/100
- State rank
- #167
- US rank
- #4404
Category grades
Schools grade is shown separately in the Schools card above.
Census & demographics
- County
- Bastrop County · 68,601 people
- City population
- 27,860
- Metro
- Austin-Round Rock-Georgetown, TX
- Population (ZIP)
- 30,411
- Household income
- $98,534
- Rent vs Own
- Severe rent burden
- 235.0
Population outlook (Bastrop County) Hauer SSP2
- Today (2025)
- 94,260 people
- By 2030
- 101,355 · +7.5%
- By 2040
- 115,578 · +22.6%
- By 2050
- 129,464 · +37.3%
- By 2075
- 168,068 · +78.3%
- By 2100
- 194,857 · +106.7%
Race, ethnicity, and origin ACS 2023
- Neighborhood character
- Diverse neighborhood (Simpson 0.64)
- Race & ethnicity
- Hispanic / Latino 46% White 38% Two or more races 19% Black 11% Native American 1%
- Hispanic origin (detail)
- Mexican 38%
- Common ancestry
- Slovak 2% Italian 2% Romanian 1%
- Foreign-born
- 17% · Canada, Vietnam
- Languages at home
- 63% English-only · Spanish 36%
Political lean MEDSL · Bastrop
- 2024 margin
- R (+18.4) · D 40.2% · R 58.6% · Other 1.2%
- 2008→2024 swing
- -10.2pp toward R · 2008: -8.2pp · 2024: -18.4pp
- All cycles
- 2024: R+18.4 2020: R+13.8 2016: R+20.4 2012: R+17.0 2008: R+8.2
Not yet ingested
- Civics
- —
Market trends
- HPI YoY
- ▲ 29.47%
- Current HPI
- 416.87
- Rent YoY
- ▲ 3.12%
- Metro
- Austin-Round Rock-Georgetown, TX
- State GDP YoY
- ▲ 3.95%
- F500 in state
- 110
Industry mix (Fortune 500 HQ in TX)
| Industry | F500 HQs | Revenue |
|---|---|---|
| Energy | 16 | $1,198B |
|
||
| Technology | 5 | $198B |
|
||
| Engineering / Construction | 4 | $72B |
|
||
| Energy Services | 3 | $60B |
|
||
| Utilities | 3 | $41B |
|
||
| Healthcare | 2 | $330B |
|
||
Price history
-0.7% since first listed3 events — show timeline
- 2024-05-14 Price Changed $299,900 Zillow
- 2024-04-30 Delisted — Zillow
- 2024-04-29 Listed $301,900 Zillow
Cash-flow waterfall
monthlySold comps — $/sqft
last 12 mo · ≤1 miLoading sold comps…