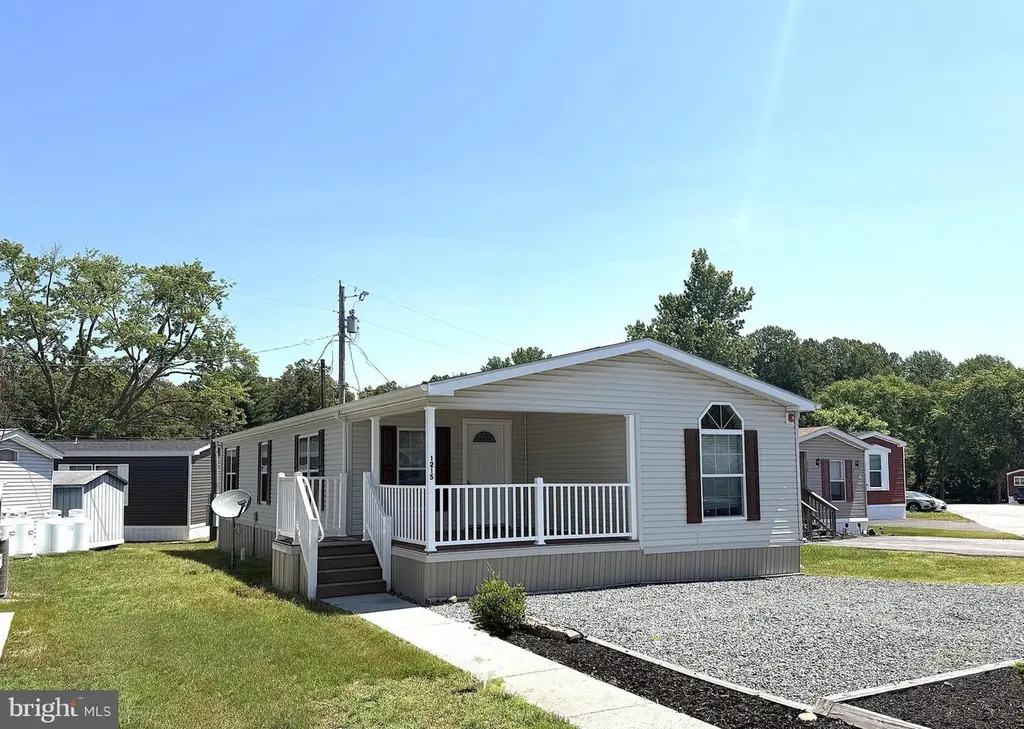
10505 Cedarville Rd Unit 12-15 · Cedarville, MD
Flood risk 1/10 · Minimal
- FEMA flood zone
- X (unshaded)
- Chance of flooding over 30 yrs
- 0.0%
- Est. flood insurance / yr
- $473 – $860
Fire risk 6/10 · Moderate
- Est. fire insurance / yr
- $755 – $1,403
Heat risk 7/10 · Major
- Hot days now (above 102°F)
- 7 days/yr
- Hot days in 30 yrs
- 16 days/yr
Wind risk 5/10 · Moderate
- Chance of severe wind over 30 yrs
- 25.0%
Air-quality risk 3/10 · Minor
- Unhealthy air days now
- 2 days/yr
- Unhealthy air days in 30 yrs
- 3 days/yr
Risk factors via First Street. Map © Google.
Why this score? — see what drove the C grade
The composite is a weighted blend of 9 inputs, each scored 0–100. Each bar is that input's sub-score; the figure is the points it added to the 100-point composite (weight × sub-score).
- Cash flow +30.0/30.0
- 1% rule +10.0/10.0
- DSCR +10.0/10.0
- Livability +2.9/5.0
- Rent growth +2.5/5.0
- Condition / age +2.5/5.0
- Schools +1.7/10.0
- ARV discount +0.0/15.0
- Appreciation +0.0/10.0
$99,900
🖨 Deal sheet (PDF) 📄 Offer letter ✓ Due diligence
Listing remarks
Very Nice 3 Bedroom, 2 Full Bath Doublewide in Sought After Cedarville Woods Mobile Home Community! Enjoy Affordable Living with this home featuring a Large Living Room, Kitchen Featuring a New Refrigerator, Plenty of Cabinets, Counter Space, a Mini Breakfast Bar and a Separate Dining Area. All Bedrooms are Nice Sized with a Big Primary Suite that has a Private Bathroom, Garden Soaking Tub, Separate Showe, His and Her Vanity Sinks, and a Walkin Closet. Other nice features of this home are Six Panel Doors Throughout and Blinds on all Windows. Outside Enjoy Relaxing on your Big Covered Front Porch and the Convenience of your two-car Driveway. Community Amenities Include a Clubhouse and Picnic
Key facts
- Mini breakfast bar
- Big primary suite
- Large living room
Tags
Property features AI
Finance
- Other: Pets allowed with size/weight and breed restrictions
- HOA & community: Land lease: $1,158 monthly; Land lease years remaining: 100
Exterior
- Parking: Driveway parking; 2 driveway spaces (2 total garage/parking spaces)
- Utilities: Community water; Community septic tank; Electric heating fuel; Electric hot water; Electric cooling
- Home design: Manufactured home (double wide); Estimated year built; Estimated 1,200 finished square feet; Land lease ownership (monthly land lease)
- Construction: Vinyl siding; Shingle roof; Above-grade structure
- Exterior features: Porch(es); Sidewalks
Interior
- Kitchen: Refrigerator; Dishwasher; Electric range/oven; Built-in microwave
- Bedrooms: 3 bedrooms on the main level
- Flooring: Carpet; Vinyl
- Bathrooms: 2 full bathrooms on the main level
- Heating & cooling: Heat pump(s); Central air (electric)
- Interior features: Soaking tub; Stall shower; Tub/shower combination; Crown molding; Recessed lighting; Walk-in closet(s); Traditional floor plan; Formal separate dining room; Country-style kitchen; Six-panel doors; Cathedral ceilings
Neighborhood map
What this means for you Summary
Snapshot
- This is a 3-bed/2.0-bath single-family listed at $100k.
Deal economics
- At list price, monthly cash flow is $2k ($18k/yr) — positive.
- The deal already cash-flows at list — no discount required.
- Meets the 1% rule at list price ($3k rent vs $100k).
Location & tenants
- Location reads 57/100 on livability (#399 in MD) — a working-class tenant base; expect higher turnover. Strengths: employment A+, crime A, cost of living B; Watch: amenities F, commute F, health & safety F.
- Prince George'S County Public Schools (suburban): math 8% / reading 24% proficiency, ranked #21 of 24 in MD (top 88%) — low school quality limits family demand, transient renter base, plan for 1-2y turnover.
- Zoned schools: Brandywine Elementary (math 8% / reading 12%, grade F, #614 of 860 statewide, top 75%, 526 students, 56% FRL); Gwynn Park Middle (math 3% / reading 26%, grade F, #195 of 225 statewide, top 87%, 711 students, 57% FRL); Gwynn Park High (math 14% / reading 46%, grade F, #153 of 222 statewide, top 69%, 1,140 students, 51% FRL) — zoned schools at 55% FRL track the district average.
- Market conditions: 222 active listings in the ZIP; high-income renter base; 1,481 units permitted in Prince George's County in 2024 (0 in 5+ unit buildings).
Forward outlook
- Local home prices are declining (-3.0%/yr); year-one equity from $691 of loan paydown is wiped out by about $3k of value loss. Plan a longer hold.
- Prince George's County population projected at +18% by 2050 — long-run rental-demand tailwind backs the buy-and-hold thesis.
- At projected returns (-3.0% appreciation + 3.0% rent growth), your $28k cash investment doubles in ~2 years — after that, you're playing with house money.
Negotiation context
- Only 9 days on market — expect competitive offers; lowballing is unlikely to land.
- 2 sale attempts since 6y ago with the ask held roughly flat each time — persistent listings suggest the price (not the market) is what's stuck; bring a comps-based counter.
Risks & watch-outs
- Climate carrying-cost: moderate wind risk, 25% chance of damaging wind over 30y; major wildfire risk; extreme-heat days projected 7→16/yr by 2055 (HVAC capex compounding) — expect insurance premiums to compound above CPI over the hold.
Questions for the listing agent
- Is there a deadline driving the sale (1031 exchange, divorce, estate, relocation)? That informs how much negotiation room exists.
- Schools are F-rated, which usually means shorter tenancies and higher turnover. Who's the typical renter profile here, and what's been the actual vacancy rate?
- What's the average days-on-market for RENTAL listings here right now (not sales)? A rising rental-DOM trend means longer vacancies and softer asking-rent achievability than the comps imply.
- What's the recent tenant-quality profile in this submarket — average credit score on applications, eviction rate, late-payment / NSF rate, and stable-employment percentage? A property-management company in the area should have these aggregated.
- How much new for-sale + rental construction is in the pipeline within 1–3 miles? Heavy new supply typically softens prices + rents 12–24 months out; constrained supply supports both.
Investment metrics
- 1% rule
- 2.81% ✓
- Cap rate
- 24.59%
- Cash-on-cash
- 65.36%
- DSCR
- 3.91
- GRM
- 3.0
CMA / ARV
- ARV (on-the-fly)
- $85,200
- Comps found
- 3
Show comp detail 3 sales within ~0.75 mi
| Address | Dist | Beds/Ba | Sqft | Sold | Price | $/sf | Match |
|---|---|---|---|---|---|---|---|
| 10505 Cedarville Dr Unit 5-2 | 0.00mi | 2/2.0 (-1) | 1,271 (+6%) | 0mo | $90,000 | $71 | 85 |
| 10505 Cedarville Rd Unit 3-9 | 0.00mi | 2/2.0 (-1) | 1,272 (+6%) | 9mo | $100,000 | $79 | 77 |
| 10505 Cedarville Rd Unit 9-16 | 0.00mi | 2/2.0 (-1) | 1,272 (+6%) | 21mo | $80,000 | $63 | 67 |
Match score weights: distance 35% · size 25% · config 20% · recency 20%. Top-matched comps best support the ARV.
Projected returns pro-forma
-3.0% appreciation · 3.0% rent growth · sell at horizon
- IRR
- 64.6%
- Equity multiple
- 3.89×
- Total profit
- $80,887
- Equity at exit
- $14,895
- IRR
- 68.9%
- Equity multiple
- 7.99×
- Total profit
- $195,553
- Equity at exit
- $8,638
Cash invested: $27,972 (down + closing). Projections, not guarantees.
Landlord ↔ Tenant lean methodology
- Overall (STATE)
- 27 Tenant-Leaning
- State Maryland
- 27 Tenant-Leaning · D+14
- County
- — inherits STATE
- City
- — inherits STATE
ZIP-level market 20613
- Home prices YoY
- -29.0%
- Active inventory
- 222
- Price-to-rent
- 3.0×
Monthly cashflow live
- Estimated rent
- $2,802 medium interval (Pro) →
- Mortgage (P&I)
- −$524
- Tax est. 1.5%
- −$125 /mo · $1,498/yr
- Insurance
- −$42
- HOA
- −$0
- Vacancy / Maint / Mgmt
- −$589
- Net cashflow
- $1,524
Break-even live
Sensitivity live
| Price | -10% $1,593 | -5% $1,558 | +0% $1,524 | +5% $1,489 | +10% $1,454 |
|---|---|---|---|---|---|
| Rent | -10% $1,302 | -5% $1,413 | +0% $1,524 | +5% $1,634 | +10% $1,745 |
| Rate | -1.0pp $1,574 | -0.5pp $1,549 | base $1,524 | +0.5pp $1,498 | +1.0pp $1,471 |
UW: 25.0% down · 7.5% · 30yr · 1.5% tax · 5.0% vac · 8.0% maint · 8.0% mgmt
Financing live
Cash to close
- Down payment
- $24,975
- Closing costs
- $2,997
- Reserves months
- —
- Total cash needed
- —
Loan-product check · same deal, 3 products live
Conventional
25% down · 7.5% · 30yr
- Down + closing
- —
- Monthly P&I
- —
- Monthly cashflow
- —
- DSCR
- —
- Eligible?
- —
Personal DTI + credit; lowest rate.
DSCR
20% down · 8.5% · 30yr
- Down + closing
- —
- Monthly P&I
- —
- Monthly cashflow
- —
- DSCR
- —
- Eligible?
- —
No personal income docs; deal must DSCR.
Hard money
10% down · 12.0% · 12mo
- Down + closing
- —
- Monthly P&I
- —
- Monthly cashflow
- —
- DSCR
- —
- Eligible?
- —
Short-term bridge; refi at stabilization.
Listing history 7 events
-
2026-06-21days on market $99,900 Active 9 DOM
-
2026-06-18days on market $99,900 Active 6 DOM
-
2026-06-17days on market $99,900 Active 5 DOM
-
2026-06-16days on market $99,900 Active 4 DOM
-
2026-06-15days on market $99,900 Active 3 DOM
-
2026-06-13remarks 699-char remark
-
2026-06-13$99,900 Active 1 DOM
ⓘ Source: listings_history table (triggers on properties + properties_extension) + one-shot
backfill from property_details.listing_events for pre-trigger history.
Climate risk First Street
- Flood 1/10 Low FEMA zone X (unshaded) · 0% chance over 30 yrs
- Wildfire 6/10 Major
- Heat 7/10 Severe 7 d/yr ≥102°F today · 16 d/yr by 30 yrs out
- Wind 5/10 Major 25% chance of damaging wind over 30 yrs
- Air quality 3/10 Moderate 2 unhealthy d/yr today · 3 by 30 yrs out
Nearby sold comps map
Loading sold comps map…
Walkable amenities ~0.75 mi
Loading nearby amenities…
Taxation est. · year 1
- Rental income
- $33,629
- − Mortgage interest
- −$5,596
- − Property taxes
- −$1,498
- − Insurance
- −$500
- − Repairs & maintenance
- −$2,690
- − Management
- −$2,690
- − Depreciation
- −$2,906
- Taxable income
- $17,748
- Est. tax owed @ 24.0%
- −$4,260
- After-tax cash flow
- $14,023/yr
For passive investors: Depreciation is non-cash, so a rental often shows a tax loss while cash-flowing — sheltering income. Rental losses are passive: they offset passive income freely, and up to $25,000/yr can offset ordinary (W-2) income if you actively participate and your MAGI is under $100k (phasing out to $0 by $150k); unused losses carry forward. On sale, claimed depreciation is recaptured at up to 25%, and gains may owe capital-gains tax (a 1031 exchange can defer both). Figures are a year-1 estimate at your 24.0% rate — not tax advice; consult a CPA.
Schools (NCES district)
- District
- Prince George'S County Public Schools
- NCES district ID
- 2400510
- Math proficiency
- 8% ▼ -11.00%
- Reading proficiency
- 24% ▼ -9.00%
- Median HH income
- $73,967
- Composite
- 16.82/100
- National rank
- #9151
- State rank
- #21 of 24 in MD
Livability — Cedarville
- Score
- 57/100
- State rank
- #399
- US rank
- #21965
Category grades
Schools grade is shown separately in the Schools card above.
Census & demographics
- Census place
- Cedarville, MD
- County
- Prince Georges County · 919,866 people
- City population
- 15,923
- Metro
- Washington-Arlington-Alexandria, DC-VA-MD-WV
- Population (ZIP)
- 17,590
- Household income
- $151,422
- Rent vs Own
Population outlook (Prince George's County) Hauer SSP2
- Today (2025)
- 1,005,426 people
- By 2030
- 1,048,416 · +4.3%
- By 2040
- 1,123,425 · +11.7%
- By 2050
- 1,183,220 · +17.7%
- By 2075
- 1,306,202 · +29.9%
- By 2100
- 1,408,179 · +40.1%
Race, ethnicity, and origin ACS 2023
- Neighborhood character
- Predominantly Black (66%)
- Race & ethnicity
- Black 66% White 20% Hispanic / Latino 7% Two or more races 7% Asian 2%
- Hispanic origin (detail)
- Puerto Rican 2%
- Common ancestry
- Lithuanian 1% Iranian 1% Italian 1%
- Foreign-born
- 7% · Canada, Vietnam, United Kingdom
- Languages at home
- 91% English-only · Spanish 3% French/Haitian/Cajun 2%
Political lean MEDSL · Prince George's
- 2024 margin
- Solid D (+75.2) · D 86.3% · R 11.2% · Other 2.5%
- 2008→2024 swing
- -3.3pp toward R · 2008: 78.5pp · 2024: 75.2pp
- All cycles
- 2024: D+75.2 2020: D+80.5 2016: D+81.0 2012: D+80.9 2008: D+78.5
Not yet ingested
- Civics
- —
Market trends
- HPI YoY
- ▼ -101.19%
- Current HPI
- 247.5504
- Rent YoY
- —
- Metro
- Washington-Arlington-Alexandria, DC-VA-MD-WV
- State GDP YoY
- ▲ 2.97%
- F500 in state
- 12
Industry mix (Fortune 500 HQ in MD)
| Industry | F500 HQs | Revenue |
|---|---|---|
| Aerospace / Defense | 1 | $71B |
|
||
| Utilities | 1 | $25B |
|
||
| Hotels | 1 | $24B |
|
||
| Consumer Goods | 1 | $7B |
|
||
| Real Estate | 1 | $6B |
|
||
| Chemicals | 1 | $2B |
|
||
Price history
+5.2% since first listed3 events — show timeline
- 2026-06-12 Listed $99,900 BRIGHT MLS
- 2020-10-27 Listing Removed — BRIGHT MLS
- 2020-07-10 Listed $95,000 BRIGHT MLS
Cash-flow waterfall
monthlySold comps — $/sqft
last 12 mo · ≤1 miLoading sold comps…