224 Glencrest Dr · Gaston, SC
Flood risk 1/10 · Minimal
- FEMA flood zone
- X (unshaded)
- Chance of flooding over 30 yrs
- 0.0%
- Est. flood insurance / yr
- $507 – $1,088
Fire risk 6/10 · Moderate
- Est. fire insurance / yr
- $783 – $1,453
Heat risk 6/10 · Moderate
- Hot days now (above 107°F)
- 7 days/yr
- Hot days in 30 yrs
- 16 days/yr
Wind risk 6/10 · Moderate
- Chance of severe wind over 30 yrs
- 73.0%
Air-quality risk 3/10 · Minor
- Unhealthy air days now
- 2 days/yr
- Unhealthy air days in 30 yrs
- 2 days/yr
Risk factors via First Street. Map © Google.
Why this score? — see what drove the C grade
The composite is a weighted blend of 9 inputs, each scored 0–100. Each bar is that input's sub-score; the figure is the points it added to the 100-point composite (weight × sub-score).
- Cash flow +24.7/30.0
- DSCR +8.0/10.0
- ARV discount +7.5/15.0
- 1% rule +5.8/10.0
- Livability +3.2/5.0
- Condition / age +2.8/5.0
- Rent growth +2.5/5.0
- Schools +1.6/10.0
- Appreciation +0.9/10.0
$124,900
🖨 Deal sheet 📄 Offer letter ✓ Due diligence
Listing remarks
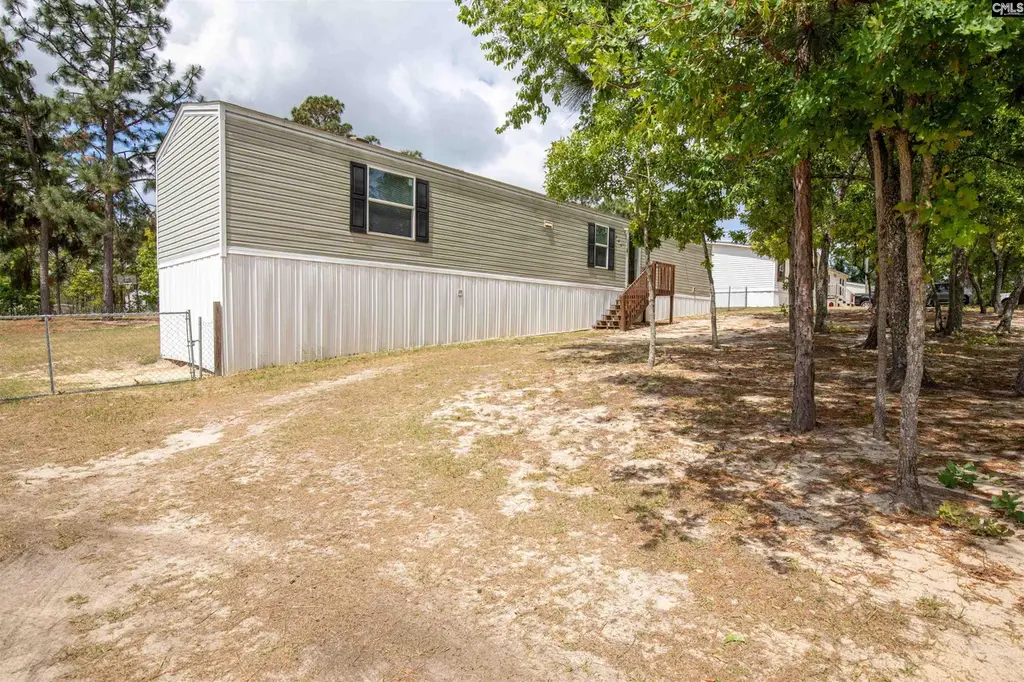
Looking for affordable country living without sacrificing convenience? Welcome to 224 Glencrest Dr where space, privacy, and value come together. Built in 2017, this 3-bedroom, 2-bath home sits on nearly half an acre, offering the perfect blend of privacy and affordability. Inside, you’ll find a functional layout with an open living area, eat-in kitchen, and split-bedroom floor plan for added comfort and convenience. Step outside to enjoy a covered back deck overlooking a fenced backyard—ideal for pets, entertaining, or simply relaxing in a peaceful setting. With no HOA and plenty of yard space, this property gives you the freedom to truly make it your own. Located just minutes
Key facts
- Covered back deck
- Open living area
- Eat-in kitchen
Tags
Property features AI
Exterior
- Utilities: Public water; Septic sewer
- Home design: Single-family property; Main-level living areas
- Construction: Crawlspace foundation
- Exterior features: Covered back porch; Vinyl exterior finish; Rear chain-link fencing
Interior
- Kitchen: Vinyl-floor kitchen; Dishwasher; Refrigerator; Free-standing range
- Bedrooms: Master bedroom on the main level with carpeted floors; Second bedroom on the main level with carpeted floors; Third bedroom on the main level with carpeted floors
- Flooring: Carpet in bedrooms and living areas; Vinyl in kitchen
- Bathrooms: Two full bathrooms (including two full baths on the main level)
- Heating & cooling: Central heating; Central air conditioning
- Interior features: Carpeted living areas; Vinyl flooring in the kitchen; Dishwasher; Refrigerator; Free-standing range; Central heating; Central cooling
- Laundry & utility: Washer/dryer location on the main level
Neighborhood map
What this means for you Summary
Snapshot
- This is a 3-bed/2.0-bath other listed at $125k. Condition is rated average.
Deal economics
- At list price, monthly cash flow is $260 ($3k/yr) — positive.
- The deal already cash-flows at list — no discount required.
- Meets the 1% rule at list price ($1k rent vs $125k).
- Recommended offer: $123k (1.5% below list) — sets the bar for market timing.
Location & tenants
- Location reads 65/100 on livability (#142 in SC) — a middle-class / working-renter tenant base. Strengths: cost of living A+, housing A+, health & safety B; Watch: crime F, amenities F, commute F.
- Lexington 04 (rural): math 14% / reading 25% proficiency, ranked #70 of 80 in SC (top 88%) — low school quality limits family demand, transient renter base, plan for 1-2y turnover; 69% free/reduced lunch — lower-income household profile, screen leases tightly.
- Zoned schools: Sandhills Primary (506 students, 100% FRL); Swansea High (math 10% / reading 72%, grade F, #177 of 196 statewide, top 91%, 683 students, 100% FRL) — zoned schools average 100% FRL vs 69% district-wide (31 pts higher); higher-poverty schools than district average — tighter screening recommended.
- Zoned-school proficiency averages 41% at this address vs 20% district-wide (+22 pts) — the actual schools serving this property are materially stronger than the Lexington 04 average implies; a family-tenant draw the district grade alone would hide.
- Market conditions: 137 active listings in the ZIP; 1,712 units permitted in Lexington County in 2024 (0 in 5+ unit buildings).
Forward outlook
- Local home prices are declining (-3.0%/yr); year-one equity from $864 of loan paydown is wiped out by about $4k of value loss. Plan a longer hold.
- Lexington County population projected at +26% by 2050 — long-run rental-demand tailwind backs the buy-and-hold thesis.
Negotiation context
- It's been on market 23 days — a 2% lower offer ($123k) is reasonable based on typical stale-listing flexibility.
- 4 sale attempts since 2y ago with the ask held roughly flat each time — persistent listings suggest the price (not the market) is what's stuck; bring a comps-based counter.
Risks & watch-outs
- Climate carrying-cost: major wind risk, 73% chance of damaging wind over 30y; major wildfire risk; extreme-heat days projected 7→16/yr by 2055 (HVAC capex compounding) — expect insurance premiums to compound above CPI over the hold.
Questions for the listing agent
- Is there a deadline driving the sale (1031 exchange, divorce, estate, relocation)? That informs how much negotiation room exists.
- Schools are F-rated, which usually means shorter tenancies and higher turnover. Who's the typical renter profile here, and what's been the actual vacancy rate?
- Crime grade is F in this area — have there been break-ins, vandalism, or insurance claims at this property in the last 3 years? What carrier currently insures it and at what premium?
- What's the average days-on-market for RENTAL listings here right now (not sales)? A rising rental-DOM trend means longer vacancies and softer asking-rent achievability than the comps imply.
- What's the recent tenant-quality profile in this submarket — average credit score on applications, eviction rate, late-payment / NSF rate, and stable-employment percentage? A property-management company in the area should have these aggregated.
- How much new for-sale + rental construction is in the pipeline within 1–3 miles? Heavy new supply typically softens prices + rents 12–24 months out; constrained supply supports both.
Investment metrics
- 1% rule
- 1.08% ✓
- Cap rate
- 8.79%
- Cash-on-cash
- 8.91%
- DSCR
- 1.40
- GRM
- 7.7
CMA / ARV
No comps found within radius.
Projected returns pro-forma
-3.0% appreciation · 3.0% rent growth · sell at horizon
- IRR
- -2.8%
- Equity multiple
- 0.89×
- Total profit
- $-3,720
- Equity at exit
- $18,623
- IRR
- 6.9%
- Equity multiple
- 1.51×
- Total profit
- $17,996
- Equity at exit
- $10,799
Cash invested: $34,972 (down + closing). Projections, not guarantees.
Landlord ↔ Tenant lean methodology
- Overall (STATE)
- 90 Strongly Landlord-Friendly
- State South Carolina
- 90 Strongly Landlord-Friendly · R+6
- County
- — inherits STATE
- City
- — inherits STATE
ZIP-level market 29053
- Home prices YoY
- -2.9%
- Active inventory
- 137
- Price-to-rent
- 7.7×
Monthly cashflow live
- Estimated rent
- $1,353 medium interval (Pro) →
- Mortgage (P&I)
- −$655
- Tax from tax record
- −$102 /mo · $1,223/yr
- Insurance
- −$52
- HOA
- −$0
- Vacancy / Maint / Mgmt
- −$284
- Net cashflow
- $260
Break-even live
UW: 25.0% down · 7.5% · 30yr · 1.5% tax · 5.0% vac · 8.0% maint · 8.0% mgmt
Financing live
Cash to close
- Down payment
- $31,225
- Closing costs
- $3,747
- Reserves months
- —
- Total cash needed
- —
Loan-product check · same deal, 3 products live
Conventional
25% down · 7.5% · 30yr
- Down + closing
- —
- Monthly P&I
- —
- Monthly cashflow
- —
- DSCR
- —
- Eligible?
- —
Personal DTI + credit; lowest rate.
DSCR
20% down · 8.5% · 30yr
- Down + closing
- —
- Monthly P&I
- —
- Monthly cashflow
- —
- DSCR
- —
- Eligible?
- —
No personal income docs; deal must DSCR.
Hard money
10% down · 12.0% · 12mo
- Down + closing
- —
- Monthly P&I
- —
- Monthly cashflow
- —
- DSCR
- —
- Eligible?
- —
Short-term bridge; refi at stabilization.
Listing history 12 events
-
2026-05-21status Pending
-
2026-04-28$124,900 Active
-
2025-08-01historical
-
2025-07-06price $125,000
-
2025-03-31status Active
-
2025-03-09status Pending
-
2025-02-23historical Active - Contingent
-
2025-02-03$129,999 Active
-
2025-02-01historical
-
2024-09-26price $129,999
-
2024-08-27price $139,999
-
2024-07-27$150,000 Active
ⓘ Source: listings_history table (triggers on properties + properties_extension) + one-shot
backfill from property_details.listing_events for pre-trigger history.
Tax reassessment forecast SC · Resets to sale price
- Current annual tax
- $1,223 · $102/mo
- Projected year-2 tax
- $1,223 · $102/mo
- Expected delta
- $0/yr ($0/mo · 0.0%)
ⓘ Screening estimate from a state-policy table — verify with the county assessor before closing.
Climate risk First Street
- Flood 1/10 Low FEMA zone X (unshaded) · 0% chance over 30 yrs
- Wildfire 6/10 Major
- Heat 6/10 Major 7 d/yr ≥107°F today · 16 d/yr by 30 yrs out
- Wind 6/10 Major 73% chance of damaging wind over 30 yrs
- Air quality 3/10 Moderate 2 unhealthy d/yr today · 2 by 30 yrs out
Nearby sold comps map
Loading sold comps map…
Walkable amenities ~0.75 mi
Loading nearby amenities…
Taxation est. · year 1
- Rental income
- $16,231
- − Mortgage interest
- −$6,996
- − Property taxes
- −$1,223
- − Insurance
- −$624
- − Repairs & maintenance
- −$1,298
- − Management
- −$1,298
- − Depreciation
- −$3,633
- Taxable income
- $1,156
- Est. tax owed @ 24.0%
- −$278
- After-tax cash flow
- $2,837/yr
For passive investors: Depreciation is non-cash, so a rental often shows a tax loss while cash-flowing — sheltering income. Rental losses are passive: they offset passive income freely, and up to $25,000/yr can offset ordinary (W-2) income if you actively participate and your MAGI is under $100k (phasing out to $0 by $150k); unused losses carry forward. On sale, claimed depreciation is recaptured at up to 25%, and gains may owe capital-gains tax (a 1031 exchange can defer both). Figures are a year-1 estimate at your 24.0% rate — not tax advice; consult a CPA.
Condition & rehab AI · 12 photos
This mobile home requires moderate repairs and maintenance, with updates to the exterior and interior paint, landscaping, and siding to significantly increase its resale and rental value.
Repairs flagged
- Minor exterior siding — slight wear
- Minor interior paint — light discoloration
- Minor landscaping — bare yard
Value-add opportunities
- Both paint interior walls — enhances curb appeal and interior aesthetics
- Both landscaping — improves curb appeal and adds value
- Both update exterior siding — enhances curb appeal and adds value
Renovation cost estimate screening
| Repair item | Severity | Est. cost |
|---|---|---|
| exterior siding · slight wear | Minor | $500–3,000 |
| interior paint · light discoloration | Minor | $500–3,000 |
| landscaping · bare yard | Minor | $500–3,000 |
| Total estimated repair cost · 3 items | $1,500–9,000 |
Value-add ROI direction
- Both paint interior walls — enhances curb appeal and interior aesthetics ↑
- Both landscaping — improves curb appeal and adds value ↑
- Both update exterior siding — enhances curb appeal and adds value ↑
ⓘ Cost ranges are severity-bucket heuristics (US national rule-of-thumb). Get contractor quotes + a written scope before underwriting a rehab budget.
Schools (NCES district)
- District
- Lexington 04
- NCES district ID
- 4502790
- Math proficiency
- 14% ▼ -2.00%
- Reading proficiency
- 25% ▼ -1.00%
- Median HH income
- $38,722
- Composite
- 16.38/100
- National rank
- #9198
- State rank
- #70 of 80 in SC
Livability — Gaston
- Score
- 65/100
- State rank
- #142
- US rank
- #13451
Category grades
Schools grade is shown separately in the Schools card above.
Census & demographics
- City population
- 20,818
- Population (ZIP)
- 20,818
Population outlook (Lexington County) Hauer SSP2
- Today (2025)
- 322,999 people
- By 2030
- 342,356 · +6.0%
- By 2040
- 377,715 · +16.9%
- By 2050
- 406,984 · +26.0%
- By 2075
- 465,447 · +44.1%
- By 2100
- 485,674 · +50.4%
Race, ethnicity, and origin ACS 2023
- Neighborhood character
- Diverse neighborhood (Simpson 0.63)
- Race & ethnicity
- White 53% Black 21% Hispanic / Latino 21% Two or more races 11%
- Hispanic origin (detail)
- Mexican 14% Puerto Rican 3%
- Common ancestry
- Slovak 2% Serbian 2% Lithuanian 1%
- Foreign-born
- 9% · Canada, Dominican Republic
- Languages at home
- 81% English-only · Spanish 18%
Political lean MEDSL · Lexington
- 2024 margin
- Solid R (+33.5) · D 32.5% · R 66.0% · Other 1.4%
- 2008→2024 swing
- +4.6pp toward D · 2008: -38.0pp · 2024: -33.5pp
- All cycles
- 2024: R+33.5 2020: R+30.1 2016: R+36.7 2012: R+37.8 2008: R+38.0
Not yet ingested
- Civics
- —
Market trends
- HPI YoY
- ▼ -8.19%
- Current HPI
- 272.1711
- Rent YoY
- —
- Metro
- —
- State GDP YoY
- ▲ 4.51%
- F500 in state
- 2
Industry mix (Fortune 500 HQ in SC)
| Industry | F500 HQs | Revenue |
|---|---|---|
| Packaging | 1 | $7B |
|
||
Price history
-16.7% since first listed12 events — show timeline
- 2026-05-21 Pending — Consolidated MLS
- 2026-04-28 Listed $124,900 Consolidated MLS
- 2025-08-01 Delisted — Consolidated MLS
- 2025-07-06 Price Changed $125,000 Consolidated MLS
- 2025-03-31 Relisted — Consolidated MLS
- 2025-03-09 Pending — Consolidated MLS
- 2025-02-23 Contingent — Consolidated MLS
- 2025-02-03 Listed $129,999 Consolidated MLS
- 2025-02-01 Delisted — Consolidated MLS
- 2024-09-26 Price Changed $129,999 Consolidated MLS
- 2024-08-27 Price Changed $139,999 Consolidated MLS
- 2024-07-27 Listed $150,000 Consolidated MLS
Property tax history
-0.3%/yrLatest (2024): $1,223 · +2.0% YoY. Source: county tax records.
Cash-flow waterfall
monthlySold comps — $/sqft
last 12 mo · ≤1 miLoading sold comps…