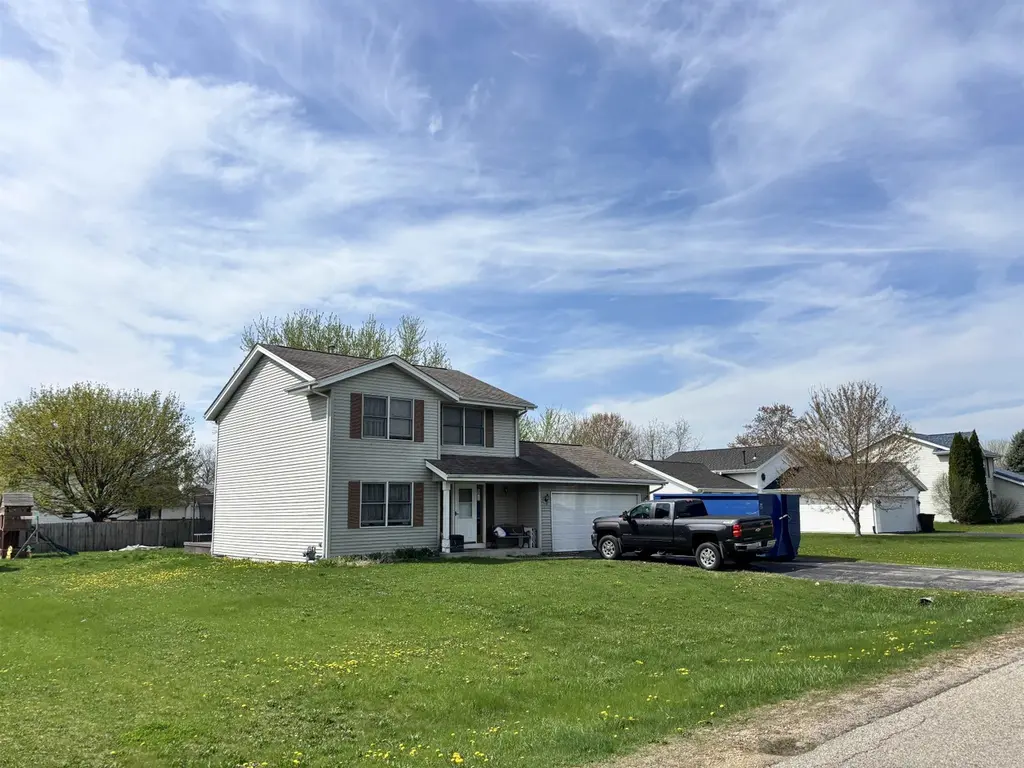
5900 Longest Dr · South Beloit, IL
Flood risk 1/10 · Minimal
- FEMA flood zone
- X (unshaded)
- Chance of flooding over 30 yrs
- 0.0%
- Est. flood insurance / yr
- $473 – $860
Fire risk 1/10 · Minimal
- Est. fire insurance / yr
- $804 – $1,492
Heat risk 3/10 · Minor
- Hot days now (above 101°F)
- 7 days/yr
- Hot days in 30 yrs
- 15 days/yr
Wind risk 2/10 · Minimal
- Chance of severe wind over 30 yrs
- —
Air-quality risk 3/10 · Minor
- Unhealthy air days now
- 2 days/yr
- Unhealthy air days in 30 yrs
- 3 days/yr
Risk factors via First Street. Map © Google.
Why this score? — see what drove the C grade
The composite is a weighted blend of 9 inputs, each scored 0–100. Each bar is that input's sub-score; the figure is the points it added to the 100-point composite (weight × sub-score).
- Cash flow +17.3/30.0
- ARV discount +15.0/15.0
- 1% rule +5.5/10.0
- DSCR +5.4/10.0
- Schools +4.4/10.0
- Livability +3.7/5.0
- Rent growth +2.5/5.0
- Condition / age +2.5/5.0
- Appreciation +0.0/10.0
$209,900
🖨 Deal sheet 📄 Offer letter ✓ Due diligence
Listing remarks MLS
SBR
Key facts
- 0.27 acre lot
- 2 garage spots
- Built 1998
Neighborhood map
What this means for you Summary
Snapshot
- This is a 3-bed/2.0-bath single-family listed at $210k.
Deal economics
- At list price, monthly cash flow is $155 ($2k/yr) — positive.
- The deal already cash-flows at list — no discount required.
- Meets the 1% rule at list price ($2k rent vs $210k).
- Cap rate 7.2% vs local median 4.0% in South Beloit — top-decile yield for the area; either an underpriced asset or a hidden risk that comps aren't pricing in. Stress-test before assuming the spread holds.
Location & tenants
- Location reads 74/100 on livability (#260 in IL, #4,831 nationally) — a middle-class / working-renter tenant base. Strengths: cost of living A+, housing A+, crime A; Watch: schools D, amenities D-, commute F.
- Hononegah Chd 207 (suburban): math 46% / reading 53% proficiency, ranked #55 of 620 in IL (top 9%) — families likely to look elsewhere, expect single-tenant / working-renter base with shorter leases.
- Market conditions: 32 active listings in the ZIP; 1 comparable units currently listed for rent nearby; 285 units permitted in Winnebago County in 2024 (0 in 5+ unit buildings).
Forward outlook
- Local home prices are declining (-3.0%/yr); year-one equity from $1k of loan paydown is wiped out by about $6k of value loss. Plan a longer hold.
- Winnebago County population projected at -20% by 2050 — secular population decline; favor cash flow + early exit over multi-decade hold.
Negotiation context
- Only 0 days on market — expect competitive offers; lowballing is unlikely to land.
- 2 sale attempts with the ask held roughly flat each time — persistent listings suggest the price (not the market) is what's stuck; bring a comps-based counter.
Questions for the listing agent
- Is there a deadline driving the sale (1031 exchange, divorce, estate, relocation)? That informs how much negotiation room exists.
- Schools are D-rated, which usually means shorter tenancies and higher turnover. Who's the typical renter profile here, and what's been the actual vacancy rate?
- What's the average days-on-market for RENTAL listings here right now (not sales)? A rising rental-DOM trend means longer vacancies and softer asking-rent achievability than the comps imply.
- What's the recent tenant-quality profile in this submarket — average credit score on applications, eviction rate, late-payment / NSF rate, and stable-employment percentage? A property-management company in the area should have these aggregated.
- How much new for-sale + rental construction is in the pipeline within 1–3 miles? Heavy new supply typically softens prices + rents 12–24 months out; constrained supply supports both.
Investment metrics
- 1% rule
- 1.05% ✓
- Cap rate
- 7.18%
- Cash-on-cash
- 3.17%
- DSCR
- 1.14
- GRM
- 8.0
CMA / ARV
- ARV (on-the-fly)
- $295,568
- Comps found
- 12
Show comp detail 12 sales within ~0.75 mi
| Address | Dist | Beds/Ba | Sqft | Sold | Price | $/sf | Match |
|---|---|---|---|---|---|---|---|
| 5900 Longest Dr | 0.00mi | 3/2.0 | 1,508 (0%) | 1mo | $209,900 | $139 | 99 |
| 5836 Longest Dr | 0.07mi | 3/2.0 | 1,300 (-14%) | 2mo | $260,000 | $200 | 72 |
| 15044 Yellowstone Dr | 0.54mi | 3/2.0 | 1,564 (+4%) | 1mo | $306,000 | $196 | 68 |
| 5476 Bastian Blvd | 0.47mi | 3/2.0 | 1,495 (-1%) | 11mo | $199,000 | $133 | 67 |
| 5757 Reidenbach Rd | 0.22mi | 3/2.0 | 1,343 (-11%) | 8mo | $270,000 | $201 | 65 |
| 5709 Pierce Ln | 0.23mi | 3/2.0 | 1,665 (+10%) | 11mo | $280,000 | $168 | 63 |
| 5637 Longest Dr | 0.27mi | 3/2.0 | 1,329 (-12%) | 8mo | $256,000 | $193 | 60 |
| 5604 Longest Dr | 0.31mi | 3/3.0 | 1,304 (-14%) | 10mo | $275,000 | $211 | 50 |
| 15557 Finley Way | 0.39mi | 3/2.0 | 1,716 (+14%) | 11mo | $359,900 | $210 | 49 |
| 15059 Yellowstone Dr | 0.50mi | 4/2.0 (+1) | 1,580 (+5%) | 18mo | $285,000 | $180 | 49 |
| 5505 Wynmere Dr | 0.71mi | 3/2.0 | 1,423 (-6%) | 15mo | $275,000 | $193 | 45 |
| 5623 Daniel Dr | 0.73mi | 3/2.0 | 1,299 (-14%) | 8mo | $295,000 | $227 | 36 |
Match score weights: distance 35% · size 25% · config 20% · recency 20%. Top-matched comps best support the ARV.
Projected returns pro-forma
-3.0% appreciation · 3.0% rent growth · sell at horizon
- IRR
- -11.2%
- Equity multiple
- 0.59×
- Total profit
- $-23,999
- Equity at exit
- $31,297
- IRR
- -1.9%
- Equity multiple
- 0.87×
- Total profit
- $-7,686
- Equity at exit
- $18,148
Cash invested: $58,772 (down + closing). Projections, not guarantees.
Landlord ↔ Tenant lean methodology
- Overall (STATE)
- 43 Moderately Tenant-Leaning
- State Illinois
- 43 Moderately Tenant-Leaning · D+7
- County
- — inherits STATE
- City
- — inherits STATE
ZIP-level market 61080
- Home prices YoY
- -8.9%
- Active inventory
- 32
- Price-to-rent
- 8.0×
Monthly cashflow live
- Estimated rent
- $2,200 medium interval (Pro) →
- Mortgage (P&I)
- −$1,101
- Tax from tax record
- −$394 /mo · $4,732/yr
- Insurance
- −$87
- HOA
- −$0
- Vacancy / Maint / Mgmt
- −$462
- Net cashflow
- $155
Break-even live
UW: 25.0% down · 7.5% · 30yr · 1.5% tax · 5.0% vac · 8.0% maint · 8.0% mgmt
Financing live
Cash to close
- Down payment
- $52,475
- Closing costs
- $6,297
- Reserves months
- —
- Total cash needed
- —
Loan-product check · same deal, 3 products live
Conventional
25% down · 7.5% · 30yr
- Down + closing
- —
- Monthly P&I
- —
- Monthly cashflow
- —
- DSCR
- —
- Eligible?
- —
Personal DTI + credit; lowest rate.
DSCR
20% down · 8.5% · 30yr
- Down + closing
- —
- Monthly P&I
- —
- Monthly cashflow
- —
- DSCR
- —
- Eligible?
- —
No personal income docs; deal must DSCR.
Hard money
10% down · 12.0% · 12mo
- Down + closing
- —
- Monthly P&I
- —
- Monthly cashflow
- —
- DSCR
- —
- Eligible?
- —
Short-term bridge; refi at stabilization.
Rent comps 1 comps
| Address | Beds | Baths | Sqft | Rent | $/sqft | DOM | Units | Dist |
|---|---|---|---|---|---|---|---|---|
| 15581 Finley Way South Beloit, IL | 3.0 | 2.0 | 1450 | $2,200 | $1.52 | 13d | 1 | 0.40mi |
Listing history 7 events
-
2026-04-17$209,900 3-char remark
Show marketing remark (3 chars)
SBR
-
2026-04-17historical 3-char remark
Show marketing remark (3 chars)
SBR
-
2026-04-17$209,900
Show marketing remark (3 chars)
SBR
-
2026-04-17historical
Show marketing remark (3 chars)
SBR
-
1996-06-26soldstatus $539,500
-
1989-11-02soldstatus $67,000
-
1989-11-02soldstatus $67,000
ⓘ Source: listings_history table (triggers on properties + properties_extension) + one-shot
backfill from property_details.listing_events for pre-trigger history.
Tax reassessment forecast IL · Partial reset (capped growth)
- Current annual tax
- $4,732 · $394/mo
- Projected year-2 tax
- $4,749 · $396/mo
- Expected delta
- +$16/yr (+$1/mo · 0.3%)
ⓘ Screening estimate from a state-policy table — verify with the county assessor before closing.
Climate risk First Street
- Flood 1/10 Low FEMA zone X (unshaded) · 0% chance over 30 yrs
- Wildfire 1/10 Low
- Heat 3/10 Moderate 7 d/yr ≥101°F today · 15 d/yr by 30 yrs out
- Wind 2/10 Low
- Air quality 3/10 Moderate 2 unhealthy d/yr today · 3 by 30 yrs out
Nearby sold comps map
Loading sold comps map…
Walkable amenities ~0.75 mi
Loading nearby amenities…
Taxation est. · year 1
- Rental income
- $26,400
- − Mortgage interest
- −$11,758
- − Property taxes
- −$4,732
- − Insurance
- −$1,050
- − Repairs & maintenance
- −$2,112
- − Management
- −$2,112
- − Depreciation
- −$6,106
- Taxable loss
- −$1,470
- Est. tax savings @ 24.0%
- +$353
- After-tax cash flow
- $2,218/yr
For passive investors: Depreciation is non-cash, so a rental often shows a tax loss while cash-flowing — sheltering income. Rental losses are passive: they offset passive income freely, and up to $25,000/yr can offset ordinary (W-2) income if you actively participate and your MAGI is under $100k (phasing out to $0 by $150k); unused losses carry forward. On sale, claimed depreciation is recaptured at up to 25%, and gains may owe capital-gains tax (a 1031 exchange can defer both). Figures are a year-1 estimate at your 24.0% rate — not tax advice; consult a CPA.
Schools (NCES district)
- District
- Hononegah Chd 207
- NCES district ID
- 1719620
- Math proficiency
- 46% ▼ -4.00%
- Reading proficiency
- 53% ▼ -2.00%
- Median HH income
- $70,776
- Composite
- 44.33/100
- National rank
- #2824
- State rank
- #55 of 620 in IL
Livability — South Beloit
- Score
- 74/100
- State rank
- #260
- US rank
- #4831
Category grades
Schools grade is shown separately in the Schools card above.
Census & demographics
- Census place
- South Beloit, IL
- Population (ZIP)
- 11,062
Population outlook (Winnebago County) Hauer SSP2
- Today (2025)
- 271,080 people
- By 2030
- 260,684 · -3.8%
- By 2040
- 238,405 · -12.1%
- By 2050
- 216,129 · -20.3%
- By 2075
- 172,882 · -36.2%
- By 2100
- 135,336 · -50.1%
Race, ethnicity, and origin ACS 2023
- Neighborhood character
- Predominantly White (78%)
- Race & ethnicity
- White 78% Hispanic / Latino 12% Two or more races 8% Black 3% Asian 2%
- Hispanic origin (detail)
- Mexican 10%
- Common ancestry
- Portuguese 4% Lithuanian 3% Slovak 2%
- Foreign-born
- 5% · Canada, China
- Languages at home
- 88% English-only · Spanish 10% Chinese 1% Other Asian/Pacific 1%
Political lean MEDSL · Winnebago
- 2024 margin
- Toss-up / Even · D 49.5% · R 49.0% · Other 1.5%
- 2008→2024 swing
- -12.2pp toward R · 2008: 12.8pp · 2024: 0.6pp
- All cycles
- 2024: D+0.6 2020: D+2.5 2016: R+1.2 2012: D+5.7 2008: D+12.8
Not yet ingested
- Civics
- —
Market trends
- HPI YoY
- ▼ -29.89%
- Current HPI
- 304.4624
- Rent YoY
- —
- Metro
- —
- State GDP YoY
- ▲ 1.59%
- F500 in state
- 60
Industry mix (Fortune 500 HQ in IL)
| Industry | F500 HQs | Revenue |
|---|---|---|
| Insurance | 4 | $201B |
|
||
| Consumer Goods | 4 | $87B |
|
||
| Industrial Machinery | 3 | $64B |
|
||
| Healthcare | 2 | $55B |
|
||
| Retail / Pharmacy | 1 | $148B |
|
||
| Agriculture / Food | 1 | $86B |
|
||
Price history
+213.3% since first listed7 events — show timeline
- 2026-04-17 Listing Removed — MRED as Distributed by MLS Grid
- 2026-04-17 Listed $209,900 MRED as Distributed by MLS Grid
- 2026-04-17 Delisted — NWIAR
- 2026-04-17 Listed $209,900 NWIAR
- 1996-06-26 Sold (Public Records) $539,500 Public Records
- 1989-11-02 Sold (Public Records) $67,000 Public Records
- 1989-11-02 Sold (Public Records) $67,000 Public Records
Property tax history
+2.3%/yrLatest (2024): $4,732 · +3.6% YoY. Source: county tax records.
Cash-flow waterfall
monthlySold comps — $/sqft
last 12 mo · ≤1 miLoading sold comps…