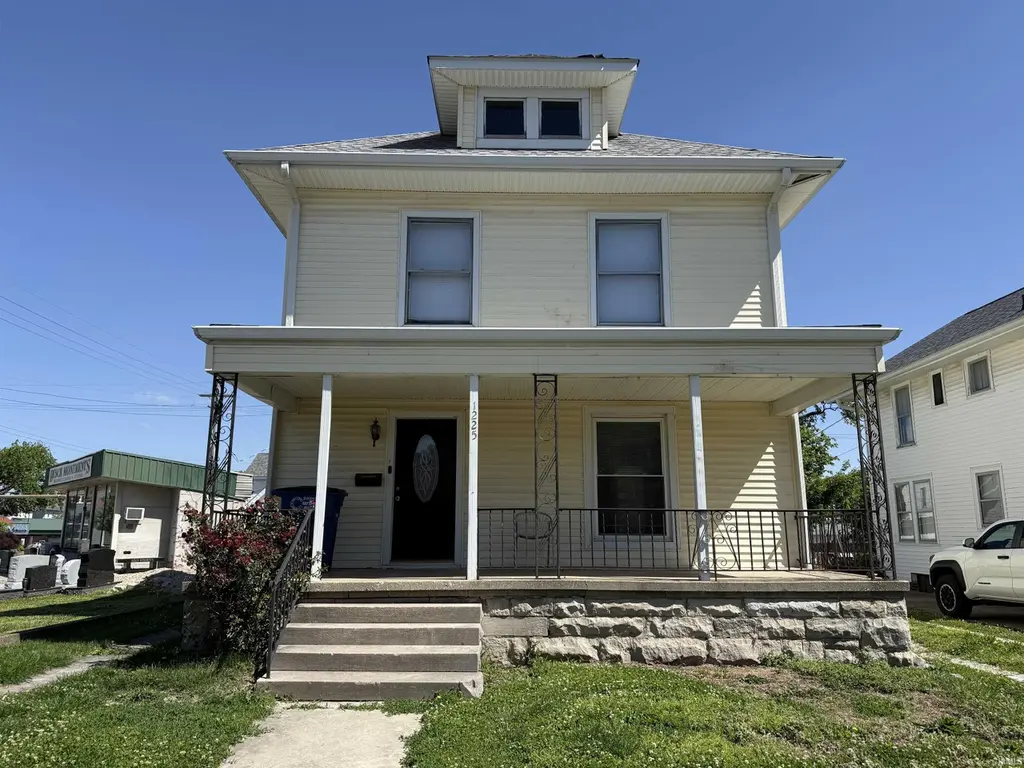
1225 17th Street St · Bedford, IN
Flood risk 1/10 · Minimal
- FEMA flood zone
- X (unshaded)
- Chance of flooding over 30 yrs
- 0.0%
- Est. flood insurance / yr
- $473 – $860
Fire risk 1/10 · Minimal
- Est. fire insurance / yr
- $717 – $1,331
Heat risk 5/10 · Moderate
- Hot days now (above 104°F)
- 7 days/yr
- Hot days in 30 yrs
- 19 days/yr
Wind risk 2/10 · Minimal
- Chance of severe wind over 30 yrs
- 1.0%
Air-quality risk 2/10 · Minimal
- Unhealthy air days now
- 0 days/yr
- Unhealthy air days in 30 yrs
- 1 days/yr
Risk factors via First Street. Map © Google.
Why this score? — see what drove the D+ grade
The composite is a weighted blend of 9 inputs, each scored 0–100. Each bar is that input's sub-score; the figure is the points it added to the 100-point composite (weight × sub-score).
- ARV discount +15.0/15.0
- Cash flow +14.5/30.0
- DSCR +4.4/10.0
- Livability +4.0/5.0
- 1% rule +3.8/10.0
- Schools +3.2/10.0
- Rent growth +2.5/5.0
- Condition / age +2.5/5.0
- Appreciation +0.0/10.0
$169,900
🖨 Deal sheet (PDF) 📄 Offer letter ✓ Due diligence
Listing remarks
Charming two story home with a spacious front porch in a convenient location. This inviting property offers three bedrooms and two full bathrooms, along with fresh paint and beautiful new flooring in the living and dining rooms. Recent updates include the refrigerator, dishwasher, and water heater, giving you added peace of mind. A wonderful place to call home, featuring comfort, character, and updates already in place.
Key facts
- Recent updates
- Fresh paint
- New flooring
Tags
Property features AI
Finance
- HOA & community: Sidewalks
Exterior
- Parking: Gravel parking
- Security: Smoke detectors; Carbon monoxide detectors
- Utilities: Public water; Public sewer; Cable available
- Home design: Single-family residence (site-built); Two stories
- Construction: Vinyl siding; Stone foundation; Shingle roof; Built above grade finished area: 1,344
- Exterior features: Covered porch; Porch; Level lot; Lot dimensions approximately 47 x 80
Interior
- Kitchen: Disposal, Dishwasher, Refrigerator, Electric Range
- Flooring: Carpet; Laminate
- Bathrooms: Two full bathrooms; One main-level bathroom
- Heating & cooling: Natural gas forced-air heating; Central air conditioning
- Interior features: Disposal, Dishwasher, Refrigerator, Electric Range; One fireplace; Unfinished basement; Six total rooms
- Laundry & utility: Laundry on main level
Neighborhood map
What this means for you Summary
Snapshot
- This is a 3-bed/1.0-bath single-family listed at $170k.
Deal economics
- At list price, monthly cash flow is $38 ($458/yr) — positive.
- The deal already cash-flows at list — no discount required.
- To meet the 1% rule (rent ≥ 1% of price), the offer needs to be $149k (12.0% below list).
- Recommended offer: $149k (12.0% below list) — sets the bar for 1% rule.
- Cap rate 6.6% vs local median 4.2% in Bedford — top-decile yield for the area; either an underpriced asset or a hidden risk that comps aren't pricing in. Stress-test before assuming the spread holds.
Location & tenants
- Location reads 80/100 on livability (#23 in IN, #1,958 nationally) — a professional / high-income tenant draw. Strengths: crime A+, cost of living A+, housing A+; Watch: employment D, commute F.
- North Lawrence Community Schools (rural): math 35% / reading 40% proficiency, ranked #170 of 301 in IN (top 56%) — families likely to look elsewhere, expect single-tenant / working-renter base with shorter leases.
- Zoned schools: Lincoln Elementary School (math 31% / reading 35%, grade F, #639 of 994 statewide, top 65%, 322 students, 64% FRL); Bedford Middle School (math 23% / reading 36%, grade F, #212 of 330 statewide, top 67%, 562 students, 54% FRL); Bedford-North Lawrence High School (math 38% / reading 63%, grade D+, #117 of 369 statewide, top 32%, 1,303 students, 46% FRL) — zoned schools average 55% FRL vs 40% district-wide (15 pts higher); higher-poverty schools than district average — tighter screening recommended.
- Market conditions: 158 active listings in the ZIP; 2 comparable units currently listed for rent nearby; 8 units permitted in Lawrence County in 2024 (0 in 5+ unit buildings).
Forward outlook
- Local home prices are declining (-3.0%/yr); year-one equity from $1k of loan paydown is wiped out by about $5k of value loss. Plan a longer hold.
- Lawrence County population projected at -14% by 2050 — secular population decline; favor cash flow + early exit over multi-decade hold.
Negotiation context
- It's been on market 24 days — a 2% lower offer ($167k) is reasonable based on typical stale-listing flexibility.
- Current owner paid $50k; list at $170k implies a 240% gain — meaningful room to come down on a strong offer.
Risks & watch-outs
- Watch-outs: built in 1900 — expect roof / HVAC / electrical / plumbing capex.
- Climate carrying-cost: extreme-heat days projected 7→19/yr by 2055 (HVAC capex compounding) — expect insurance premiums to compound above CPI over the hold.
Questions for the listing agent
- Built in 1900 — when were the roof, HVAC, electrical panel, plumbing, and water heater last replaced?
- Is there a deadline driving the sale (1031 exchange, divorce, estate, relocation)? That informs how much negotiation room exists.
- The area grade is low — what's the realistic commute time and amenity access for the typical tenant pool here? Any planned neighborhood developments (good or bad) we should know about?
- What's the average days-on-market for RENTAL listings here right now (not sales)? A rising rental-DOM trend means longer vacancies and softer asking-rent achievability than the comps imply.
- What's the recent tenant-quality profile in this submarket — average credit score on applications, eviction rate, late-payment / NSF rate, and stable-employment percentage? A property-management company in the area should have these aggregated.
- How much new for-sale + rental construction is in the pipeline within 1–3 miles? Heavy new supply typically softens prices + rents 12–24 months out; constrained supply supports both.
Investment metrics
- 1% rule
- 0.88% ✗
- Cap rate
- 6.56%
- Cash-on-cash
- 0.96%
- DSCR
- 1.04
- GRM
- 9.5
CMA / ARV
- ARV (on-the-fly)
- $216,384
- Comps found
- 12
Show comp detail 12 sales within ~0.75 mi
| Address | Dist | Beds/Ba | Sqft | Sold | Price | $/sf | Match |
|---|---|---|---|---|---|---|---|
| 610 18th St | 0.52mi | 3/1.5 | 1,312 (-2%) | 2mo | $40,000 | $30 | 68 |
| 1414 R St | 0.40mi | 3/1.5 | 1,248 (-7%) | 0mo | $205,900 | $165 | 67 |
| 1922 J St | 0.32mi | 3/1.0 | 1,200 (-11%) | 2mo | $47,500 | $40 | 65 |
| 810 13th St | 0.45mi | 2/1.0 (-1) | 1,230 (-8%) | 1mo | $15,000 | $12 | 59 |
| 1022 Lincoln Ave | 0.51mi | 2/2.0 (-1) | 1,400 (+4%) | 2mo | $105,000 | $75 | 59 |
| 1824 14th St | 0.49mi | 3/2.0 | 1,248 (-7%) | 4mo | $175,000 | $140 | 58 |
| 1509 Q St | 0.34mi | 3/2.0 | 1,192 (-11%) | 5mo | $143,000 | $120 | 57 |
| 1511 11th Street St | 0.51mi | 3/2.0 | 1,190 (-12%) | 1mo | $192,000 | $161 | 52 |
| 2503 Aruba Ct | 0.64mi | 3/2.0 | 1,451 (+8%) | 2mo | $375,633 | $259 | 51 |
| 1208 T St | 0.62mi | 3/2.0 | 1,200 (-11%) | 1mo | $205,000 | $171 | 48 |
| 812 24th Street St | 0.65mi | 2/1.0 (-1) | 1,186 (-12%) | 4mo | $215,000 | $181 | 42 |
| 2435 I St | 0.69mi | 3/3.0 | 1,512 (+12%) | 3mo | $258,000 | $171 | 36 |
Match score weights: distance 35% · size 25% · config 20% · recency 20%. Top-matched comps best support the ARV.
Projected returns pro-forma
-3.0% appreciation · 3.0% rent growth · sell at horizon
- IRR
- -14.8%
- Equity multiple
- 0.47×
- Total profit
- $-25,095
- Equity at exit
- $25,333
- IRR
- -6.1%
- Equity multiple
- 0.61×
- Total profit
- $-18,707
- Equity at exit
- $14,690
Cash invested: $47,572 (down + closing). Projections, not guarantees.
Landlord ↔ Tenant lean methodology
- Overall (STATE)
- 90 Strongly Landlord-Friendly
- State Indiana
- 90 Strongly Landlord-Friendly · R+11
- County
- — inherits STATE
- City
- — inherits STATE
ZIP-level market 47421
- Home prices YoY
- -25.2%
- Active inventory
- 158
- Price-to-rent
- 9.5×
Monthly cashflow live
- Estimated rent
- $1,494 medium interval (Pro) →
- Mortgage (P&I)
- −$891
- Tax from tax record
- −$181 /mo · $2,168/yr
- Insurance
- −$71
- HOA
- −$0
- Vacancy / Maint / Mgmt
- −$314
- Net cashflow
- $38
Break-even live
Sensitivity live
| Price | -10% $134 | -5% $86 | +0% $38 | +5% $-10 | +10% $-58 |
|---|---|---|---|---|---|
| Rent | -10% $-80 | -5% $-21 | +0% $38 | +5% $97 | +10% $156 |
| Rate | -1.0pp $124 | -0.5pp $81 | base $38 | +0.5pp $-6 | +1.0pp $-51 |
UW: 25.0% down · 7.5% · 30yr · 1.5% tax · 5.0% vac · 8.0% maint · 8.0% mgmt
Financing live
Cash to close
- Down payment
- $42,475
- Closing costs
- $5,097
- Reserves months
- —
- Total cash needed
- —
Loan-product check · same deal, 3 products live
Conventional
25% down · 7.5% · 30yr
- Down + closing
- —
- Monthly P&I
- —
- Monthly cashflow
- —
- DSCR
- —
- Eligible?
- —
Personal DTI + credit; lowest rate.
DSCR
20% down · 8.5% · 30yr
- Down + closing
- —
- Monthly P&I
- —
- Monthly cashflow
- —
- DSCR
- —
- Eligible?
- —
No personal income docs; deal must DSCR.
Hard money
10% down · 12.0% · 12mo
- Down + closing
- —
- Monthly P&I
- —
- Monthly cashflow
- —
- DSCR
- —
- Eligible?
- —
Short-term bridge; refi at stabilization.
Rent comps 2 comps
| Address | Beds | Baths | Sqft | Rent | $/sqft | DOM | Units | Dist |
|---|---|---|---|---|---|---|---|---|
| 2115 G St Bedford, IN | 3.0 | 2.0 | 1500 | $1,750 | $1.17 | 21d | 1 | 0.56mi |
| 100 Shawnee Dr Bedford, IN | 1.0–3.0 | 1.0–2.0 | 553 | $1,268 | $2.29 | 21d | 6 | 1.44mi |
Listing history 19 events
-
2026-06-19days on market $169,900 Active 24 DOM
-
2026-06-18days on market $169,900 Active 23 DOM
-
2026-06-17days on market $169,900 Active 22 DOM
-
2026-06-16days on market $169,900 Active 21 DOM
-
2026-06-15days on market $169,900 Active 20 DOM
-
2026-06-14days on market $169,900 Active 18 DOM
-
2026-06-13days on market $169,900 Active 17 DOM
-
2026-06-10days on market $169,900 Active 15 DOM
-
2026-06-09days on market $169,900 Active 14 DOM
-
2026-06-08days on market $169,900 Active 13 DOM
-
2026-06-07days on market $169,900 Active 12 DOM
-
2026-06-05days on market $169,900 Active 9 DOM
-
2026-06-03days on market $169,900 Active 8 DOM
-
2026-06-02days on market $169,900 Active 7 DOM
-
2026-06-01days on market $169,900 Active 6 DOM
-
2026-05-31days on market $169,900 Active 5 DOM
-
2026-05-30days on market $169,900 Active 4 DOM
-
2026-05-26$169,900 Active
-
2017-02-23soldstatus $50,000
ⓘ Source: listings_history table (triggers on properties + properties_extension) + one-shot
backfill from property_details.listing_events for pre-trigger history.
Tax reassessment forecast IN · Partial reset (capped growth)
- Current annual tax
- $2,168 · $181/mo
- Projected year-2 tax
- $2,168 · $181/mo
- Expected delta
- $0/yr ($0/mo · 0.0%)
ⓘ Screening estimate from a state-policy table — verify with the county assessor before closing.
Climate risk First Street
- Flood 1/10 Low FEMA zone X (unshaded) · 0% chance over 30 yrs
- Wildfire 1/10 Low
- Heat 5/10 Major 7 d/yr ≥104°F today · 19 d/yr by 30 yrs out
- Wind 2/10 Low 100% chance of damaging wind over 30 yrs
- Air quality 2/10 Low 0 unhealthy d/yr today · 1 by 30 yrs out
Nearby sold comps map
Loading sold comps map…
Walkable amenities ~0.75 mi
Loading nearby amenities…
Taxation est. · year 1
- Rental income
- $17,934
- − Mortgage interest
- −$9,517
- − Property taxes
- −$2,168
- − Insurance
- −$850
- − Repairs & maintenance
- −$1,435
- − Management
- −$1,435
- − Depreciation
- −$4,943
- Taxable loss
- −$2,413
- Est. tax savings @ 24.0%
- +$579
- After-tax cash flow
- $1,037/yr
For passive investors: Depreciation is non-cash, so a rental often shows a tax loss while cash-flowing — sheltering income. Rental losses are passive: they offset passive income freely, and up to $25,000/yr can offset ordinary (W-2) income if you actively participate and your MAGI is under $100k (phasing out to $0 by $150k); unused losses carry forward. On sale, claimed depreciation is recaptured at up to 25%, and gains may owe capital-gains tax (a 1031 exchange can defer both). Figures are a year-1 estimate at your 24.0% rate — not tax advice; consult a CPA.
Schools (NCES district)
- District
- North Lawrence Community Schools
- NCES district ID
- 1807860
- Math proficiency
- 35% ▼ -2.00%
- Reading proficiency
- 40% ▼ -3.00%
- Median HH income
- $44,566
- Composite
- 31.88/100
- National rank
- #5864
- State rank
- #170 of 301 in IN
Livability — Bedford
- Score
- 80/100
- State rank
- #23
- US rank
- #1958
Category grades
Schools grade is shown separately in the Schools card above.
Census & demographics
- Census place
- Bedford, IN
- County
- Lawrence County · 27,599 people
- City population
- 27,599
- Metro
- Bedford, IN
- Population (ZIP)
- 27,599
- Household income
- $68,108
- Rent vs Own
- Severe rent burden
- 507.0
Population outlook (Lawrence County) Hauer SSP2
- Today (2025)
- 44,347 people
- By 2030
- 43,331 · -2.3%
- By 2040
- 40,887 · -7.8%
- By 2050
- 38,297 · -13.6%
- By 2075
- 32,479 · -26.8%
- By 2100
- 26,051 · -41.3%
Race, ethnicity, and origin ACS 2023
- Neighborhood character
- Predominantly White (94%)
- Race & ethnicity
- White 94% Two or more races 4% Hispanic / Latino 2%
- Common ancestry
- Slovak 3% Italian 2% Scotch-Irish 1%
- Foreign-born
- 1% · Canada
- Languages at home
- 99% English-only · Spanish 1%
Political lean MEDSL · Lawrence
- 2024 margin
- Solid R (+51.0) · D 23.6% · R 74.6% · Other 1.7%
- 2008→2024 swing
- -30.5pp toward R · 2008: -20.6pp · 2024: -51.0pp
- All cycles
- 2024: R+51.0 2020: R+50.6 2016: R+51.5 2012: R+32.8 2008: R+20.6
Not yet ingested
- Civics
- —
Market trends
- HPI YoY
- ▼ -81.32%
- Current HPI
- 240.959
- Rent YoY
- —
- Metro
- Bedford, IN
- State GDP YoY
- ▲ 2.90%
- F500 in state
- 18
Industry mix (Fortune 500 HQ in IN)
| Industry | F500 HQs | Revenue |
|---|---|---|
| Industrial Machinery | 2 | $37B |
|
||
| Healthcare | 1 | $177B |
|
||
| Pharmaceuticals | 1 | $45B |
|
||
| Metals / Steel | 1 | $18B |
|
||
| Agriculture | 1 | $17B |
|
||
| Packaging | 1 | $12B |
|
||
Price history
+239.8% since first listed2 events — show timeline
- 2026-05-26 Listed $169,900 IRMLS
- 2017-02-23 Sold (Public Records) $50,000 Public Records
Property tax history
+0.2%/yrLatest (2025): $2,168 · +3.9% YoY. Source: county tax records.
Cash-flow waterfall
monthlySold comps — $/sqft
last 12 mo · ≤1 miLoading sold comps…