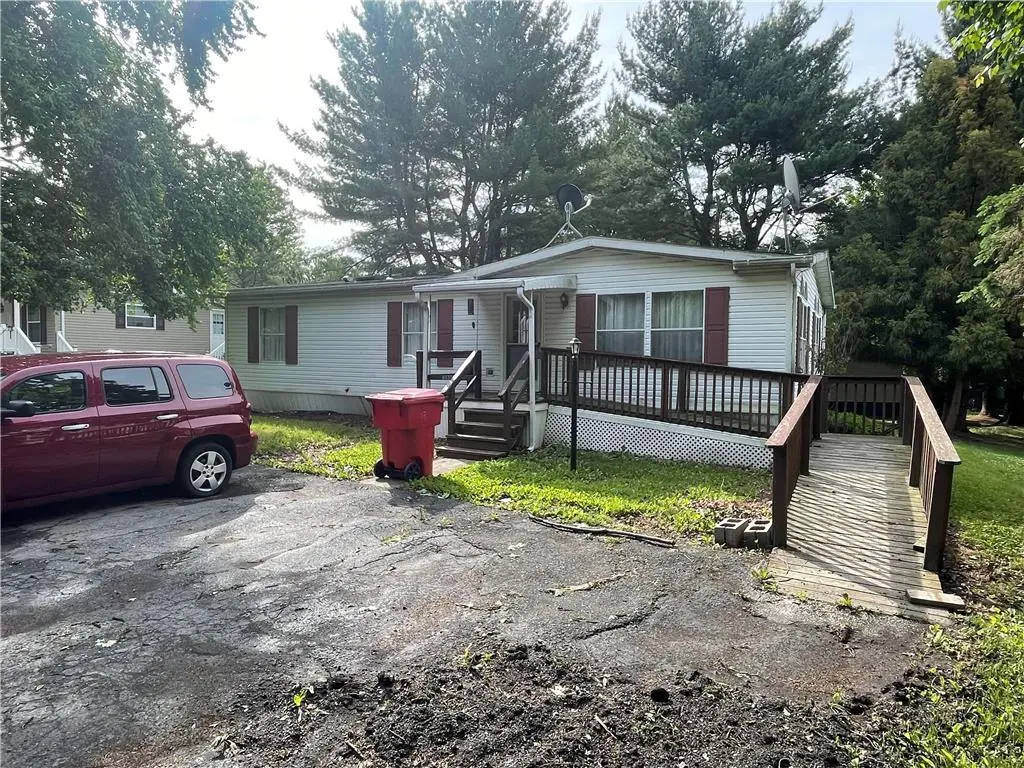
8836 Max Way · Breinigsville, PA
Flood risk 8/10 · Major
- FEMA flood zone
- X (unshaded)
- Chance of flooding over 30 yrs
- 0.99%
- Est. flood insurance / yr
- $507 – $1,088
Fire risk 1/10 · Minimal
- Est. fire insurance / yr
- $511 – $949
Heat risk 4/10 · Minor
- Hot days now (above 100°F)
- 7 days/yr
- Hot days in 30 yrs
- 15 days/yr
Wind risk 4/10 · Minor
- Chance of severe wind over 30 yrs
- 17.0%
Air-quality risk 3/10 · Minor
- Unhealthy air days now
- 2 days/yr
- Unhealthy air days in 30 yrs
- 3 days/yr
Risk factors via First Street. Map © Google.
Why this score? — see what drove the C- grade
The composite is a weighted blend of 9 inputs, each scored 0–100. Each bar is that input's sub-score; the figure is the points it added to the 100-point composite (weight × sub-score).
- Cash flow +15.0/30.0
- ARV discount +7.5/15.0
- Schools +5.7/10.0
- 1% rule +5.0/10.0
- DSCR +5.0/10.0
- Appreciation +4.6/10.0
- Livability +3.2/5.0
- Rent growth +3.0/5.0
- Condition / age +2.5/5.0
$25,000
🖨 Deal sheet (PDF) 📄 Offer letter ✓ Due diligence
Listing remarks
Bring your own contractor or put your own sweat equity into this 3 bedroom, 2 full bathroom double-wide manufactured home in Green Acres. The old flooring has been completely removed down to the subfloor (which is in great shape) and the walls have all been removed down to the studs. It's a blank canvas to really make this home your own! And as an added bonus the seller is leaving some of the new flooring with the home as well as brand new appliances for the kitchen and laundry area! What you see with the home is what you get with the home. Large storage shed out back, propane forced air heat, large rear wooden deck, front ramp, driveway parking for up to 4 vehicles. Monthly lot rent of $11
Key facts
- Brand new appliances
- New flooring
- Driveway parking
Tags
Property features AI
Finance
- Other: Zoning: R5
- HOA & community: Association fee: $1,134 monthly
Exterior
- Parking: Driveway
- Utilities: Community/Cooperative water; Community/Cooperative sewer; Electric service
- Home design: Single-story; Vinyl siding construction; Asphalt/fiberglass roof
- Construction: Vinyl siding; Asphalt and fiberglass roof
- Exterior features: Propane tank (leased); Mobile home on property
Interior
- Kitchen: Electric oven; Electric range; Dishwasher; Refrigerator
- Bathrooms: 2 full bathrooms
- Heating & cooling: Forced air heating; Propane heating
- Interior features: Dining area
- Laundry & utility: Washer; Dryer; Electric water heater
Neighborhood map
What this means for you Summary
Snapshot
- This is a 3-bed/2.0-bath manufactured listed at $25k.
Deal economics
- At list price, monthly cash flow is $490 ($6k/yr) — positive.
- The deal already cash-flows at list — no discount required.
- Meets the 1% rule at list price ($2k rent vs $25k).
- Cap rate 33.0% vs local median 2.9% in Breinigsville — top-decile yield for the area; either an underpriced asset or a hidden risk that comps aren't pricing in. Stress-test before assuming the spread holds.
Location & tenants
- Location reads 63/100 on livability (#1,251 in PA) — a middle-class / working-renter tenant base. Strengths: schools A+, crime A+, housing A+; Watch: amenities F, commute F, health & safety F.
- Parkland SD (suburban): math 59% / reading 70% proficiency, ranked #40 of 539 in PA (top 7%) — acceptable for families but not a draw, mixed tenant base, ~2y average lease; only 15% free/reduced lunch — higher-income household profile.
- Market conditions: Rents rising (+1.9%/yr); 123 active listings in the ZIP; 11 comparable units currently listed for rent nearby; rentals at typical pace (median 15d on market — plan ~3-4 weeks tenant-placement turnaround); high-income renter base; 765 units permitted in Lehigh County in 2024 (286 in 5+ unit buildings).
Forward outlook
- Local home prices are declining (-0.7%/yr); year-one equity from $173 of loan paydown is wiped out by about $179 of value loss. Plan a longer hold.
- Lehigh County population projected at +21% by 2050 — long-run rental-demand tailwind backs the buy-and-hold thesis.
- At projected returns (-0.7% appreciation + 1.9% rent growth), your $7k cash investment doubles in ~2 years — after that, you're playing with house money.
Negotiation context
- Only 9 days on market — expect competitive offers; lowballing is unlikely to land.
Risks & watch-outs
- Watch-outs: flood insurance adds $66/mo; HOA is 48% of rent.
- Climate carrying-cost: severe flood risk — expect insurance premiums to compound above CPI over the hold.
Questions for the listing agent
- What's the actual annual flood-insurance premium (NFIP or private), and is the property in a SFHA with mandatory coverage?
- What does the HOA fee cover, when was the last increase, and are there any pending special assessments or reserve-fund shortfalls?
- Is there a deadline driving the sale (1031 exchange, divorce, estate, relocation)? That informs how much negotiation room exists.
- Schools are A-rated — typically a magnet for longer-tenancy family renters. What's the average tenant stay here, and is there a school-zone premium baked into asking?
- What's the average days-on-market for RENTAL listings here right now (not sales)? A rising rental-DOM trend means longer vacancies and softer asking-rent achievability than the comps imply.
- What's the recent tenant-quality profile in this submarket — average credit score on applications, eviction rate, late-payment / NSF rate, and stable-employment percentage? A property-management company in the area should have these aggregated.
- How much new for-sale + rental construction is in the pipeline within 1–3 miles? Heavy new supply typically softens prices + rents 12–24 months out; constrained supply supports both.
Investment metrics
- 1% rule
- 9.43% ✓
- Cap rate
- 33.01%
- Cash-on-cash
- 95.42%
- DSCR
- 5.25
- GRM
- 0.9
CMA / ARV
- ARV (on-the-fly)
- $68,992
- Comps found
- 12
Show comp detail 12 sales within ~0.75 mi
| Address | Dist | Beds/Ba | Sqft | Sold | Price | $/sf | Match |
|---|---|---|---|---|---|---|---|
| 1012 Spruce Ln | 0.17mi | 3/2.0 | 1,344 (+9%) | 3mo | $75,000 | $56 | 75 |
| 8865 Breinig Run Cir | 0.19mi | 3/2.0 | 1,344 (+9%) | 2mo | $92,500 | $69 | 74 |
| 8914 Breinig Run Cir | 0.28mi | 3/2.0 | 1,200 (-3%) | 13mo | $53,000 | $44 | 72 |
| 8727 Evergreen Cir | 0.16mi | 3/2.0 | 1,344 (+9%) | 10mo | $50,000 | $37 | 69 |
| 8902 Breinig Run Cir | 0.26mi | 2/2.0 (-1) | 1,152 (-6%) | 6mo | $75,000 | $65 | 67 |
| 1007 Redwood Dr | 0.08mi | 3/2.0 | 1,056 (-14%) | 8mo | $58,000 | $55 | 65 |
| 1016 Spruce Ln | 0.25mi | 3/2.0 | 1,056 (-14%) | 1mo | $59,000 | $56 | 64 |
| 8850 Turkey Ridge Rd | 0.27mi | 3/2.0 | 1,344 (+9%) | 11mo | $20,000 | $15 | 63 |
| 8726 Breinig Run Cir | 0.49mi | 3/2.0 | 1,152 (-6%) | 5mo | $77,000 | $67 | 62 |
| 8722 Evergreen Cir | 0.20mi | 2/2.0 (-1) | 1,080 (-12%) | 9mo | $57,000 | $53 | 58 |
| 8719 Turkey Ridge Rd | 0.64mi | 3/2.0 | 1,120 (-9%) | 6mo | $69,000 | $62 | 50 |
| 8711 Breinig Run Cir | 0.55mi | 2/2.0 (-1) | 1,056 (-14%) | 15mo | $46,500 | $44 | 33 |
Match score weights: distance 35% · size 25% · config 20% · recency 20%. Top-matched comps best support the ARV.
Projected returns pro-forma
-0.72% appreciation · 1.92% rent growth · sell at horizon
- IRR
- 83.5%
- Equity multiple
- 4.98×
- Total profit
- $27,894
- Equity at exit
- $6,375
- IRR
- 84.9%
- Equity multiple
- 9.55×
- Total profit
- $59,820
- Equity at exit
- $6,988
Cash invested: $7,000 (down + closing). Projections, not guarantees.
Landlord ↔ Tenant lean methodology
- Overall (STATE)
- 62 Landlord-Friendly
- State Pennsylvania
- 62 Landlord-Friendly · EVEN
- County
- — inherits STATE
- City
- — inherits STATE
ZIP-level market 18031
- Home prices YoY
- -0.3%
- Rents YoY
- 1.9%
- Active inventory
- 123
- Price-to-rent
- 0.9×
Monthly cashflow live
- Estimated rent
- $2,359 high interval (Pro) →
- Mortgage (P&I)
- −$131
- Tax est. 1.5%
- −$31 /mo · $375/yr
- Insurance
- −$10
- Flood insurance flood zone
- −$66 /mo · $798/yr
- HOA
- −$1,134
- Vacancy / Maint / Mgmt
- −$495
- Net cashflow
- $490
Break-even live
Sensitivity live
| Price | -10% $507 | -5% $499 | +0% $490 | +5% $482 | +10% $473 |
|---|---|---|---|---|---|
| Rent | -10% $304 | -5% $397 | +0% $490 | +5% $583 | +10% $677 |
| Rate | -1.0pp $503 | -0.5pp $497 | base $490 | +0.5pp $484 | +1.0pp $477 |
UW: 25.0% down · 7.5% · 30yr · 1.5% tax · 5.0% vac · 8.0% maint · 8.0% mgmt
Financing live
Cash to close
- Down payment
- $6,250
- Closing costs
- $750
- Reserves months
- —
- Total cash needed
- —
Loan-product check · same deal, 3 products live
Conventional
25% down · 7.5% · 30yr
- Down + closing
- —
- Monthly P&I
- —
- Monthly cashflow
- —
- DSCR
- —
- Eligible?
- —
Personal DTI + credit; lowest rate.
DSCR
20% down · 8.5% · 30yr
- Down + closing
- —
- Monthly P&I
- —
- Monthly cashflow
- —
- DSCR
- —
- Eligible?
- —
No personal income docs; deal must DSCR.
Hard money
10% down · 12.0% · 12mo
- Down + closing
- —
- Monthly P&I
- —
- Monthly cashflow
- —
- DSCR
- —
- Eligible?
- —
Short-term bridge; refi at stabilization.
Rent comps 11 comps
| Address | Beds | Baths | Sqft | Rent | $/sqft | DOM | Units | Dist |
|---|---|---|---|---|---|---|---|---|
| 8749 Breinig Run Cir Breinigsville, PA | 2.0 | 2.0 | 1029 | $1,695 | $1.65 | 3d | 1 | 0.43mi |
| 1145 Martin Rd Breinigsville, PA | 3.0 | 2.5 | 1500 | $2,500 | $1.67 | 3d | 1 | 0.91mi |
| 1208 Martin Rd Breinigsville, PA | 3.0 | 2.5 | 1500 | $2,450 | $1.63 | 44d | 1 | 0.91mi |
| 1175 Susan Cir Breinigsville, PA | 3.0 | 2.5 | 1500 | $2,600 | $1.73 | 44d | 1 | 0.95mi |
| 1177 Susan Cir Breinigsville, PA | 3.0 | 2.5 | 1500 | $2,500 | $1.67 | 44d | 1 | 0.95mi |
| 1273 Martin Rd Breinigsville, PA | 3.0 | 2.5 | 1500 | $2,550 | $1.70 | 44d | 1 | 0.97mi |
| 9751 Newtown Rd Unit B Breinigsville, PA | 2.0 | 1.0 | 1288 | $2,300 | $1.79 | 3d | 1 | 1.00mi |
| 8328 Fair Way Breinigsville, PA | 3.0 | 2.5 | 1500 | $2,600 | $1.73 | 24d | 1 | 1.02mi |
| 1055 Cetronia Rd Breinigsville, PA | 1.0–2.0 | 1.0–2.0 | 1094 | $2,355 | $2.15 | 3d | 8 | 1.18mi |
| 8395 Saylor Ct Breinigsville, PA | 3.0 | 1.5 | 1056 | $2,100 | $1.99 | 15d | 1 | 1.24mi |
| 1447 Artisan Ct Breinigsville, PA | 2.0 | 1.5 | 1056 | $2,150 | $2.04 | 15d | 1 | 1.25mi |
HOA detail
- Monthly dues
- $1,134 · $13,608/yr
Listing history 7 events
-
2026-06-14statusdays on market $25,000 Pending 9 DOM
-
2026-06-13days on market $25,000 Active 8 DOM
-
2026-06-10days on market $25,000 Active 6 DOM
-
2026-06-09days on market $25,000 Active 5 DOM
-
2026-06-08days on market $25,000 Active 4 DOM
-
2026-06-07remarks 699-char remark
-
2026-06-07$25,000 Active 3 DOM
ⓘ Source: listings_history table (triggers on properties + properties_extension) + one-shot
backfill from property_details.listing_events for pre-trigger history.
Climate risk First Street
- Flood 8/10 Severe FEMA zone X (unshaded) · 99% chance over 30 yrs
- Wildfire 1/10 Low
- Heat 4/10 Moderate 7 d/yr ≥100°F today · 15 d/yr by 30 yrs out
- Wind 4/10 Moderate 17% chance of damaging wind over 30 yrs
- Air quality 3/10 Moderate 2 unhealthy d/yr today · 3 by 30 yrs out
Nearby sold comps map
Loading sold comps map…
Walkable amenities ~0.75 mi
Loading nearby amenities…
Taxation est. · year 1
- Rental income
- $28,305
- − Mortgage interest
- −$1,400
- − Property taxes
- −$375
- − Insurance
- −$922
- − Repairs & maintenance
- −$2,264
- − Management
- −$2,264
- − HOA
- −$13,608
- − Depreciation
- −$727
- Taxable income
- $6,743
- Est. tax owed @ 24.0%
- −$1,618
- After-tax cash flow
- $4,264/yr
For passive investors: Depreciation is non-cash, so a rental often shows a tax loss while cash-flowing — sheltering income. Rental losses are passive: they offset passive income freely, and up to $25,000/yr can offset ordinary (W-2) income if you actively participate and your MAGI is under $100k (phasing out to $0 by $150k); unused losses carry forward. On sale, claimed depreciation is recaptured at up to 25%, and gains may owe capital-gains tax (a 1031 exchange can defer both). Figures are a year-1 estimate at your 24.0% rate — not tax advice; consult a CPA.
Schools (NCES district)
- District
- Parkland SD
- NCES district ID
- 4218510
- Math proficiency
- 59% ▼ -11.00%
- Reading proficiency
- 70% ▼ -12.00%
- Median HH income
- $77,976
- Composite
- 57.44/100
- National rank
- #1074
- State rank
- #40 of 539 in PA
Livability — Breinigsville
- Score
- 63/100
- State rank
- #1251
- US rank
- #15041
Category grades
Schools grade is shown separately in the Schools card above.
Census & demographics
- Census place
- Breinigsville, PA
- County
- Lehigh County · 333,019 people
- City population
- 11,570
- Metro
- Allentown-Bethlehem-Easton, PA-NJ
- Population (ZIP)
- 11,570
- Household income
- $113,625
- Rent vs Own
- Severe rent burden
- 52.0
Population outlook (Lehigh County) Hauer SSP2
- Today (2025)
- 392,957 people
- By 2030
- 408,319 · +3.9%
- By 2040
- 440,007 · +12.0%
- By 2050
- 475,940 · +21.1%
- By 2075
- 590,448 · +50.3%
- By 2100
- 690,314 · +75.7%
Race, ethnicity, and origin ACS 2023
- Neighborhood character
- Diverse neighborhood (Simpson 0.58)
- Race & ethnicity
- White 61% Hispanic / Latino 19% Two or more races 17% Asian 12% Black 5%
- Hispanic origin (detail)
- Mexican 6% Puerto Rican 7% Dominican 3%
- Common ancestry
- Polish 4% Lithuanian 3% Scandinavian 3%
- Foreign-born
- 19% · Canada, United Kingdom, China
- Languages at home
- 76% English-only · Spanish 10% Other Indo-European 8% Other Asian/Pacific 2%
Political lean MEDSL · Lehigh
- 2024 margin
- Toss-up / Even · D 50.7% · R 48.0% · Other 1.2%
- 2008→2024 swing
- -12.9pp toward R · 2008: 15.6pp · 2024: 2.7pp
- All cycles
- 2024: D+2.7 2020: D+7.6 2016: D+4.4 2012: D+7.5 2008: D+15.6
Not yet ingested
- Civics
- —
Market trends
- HPI YoY
- ▼ -0.72%
- Current HPI
- 267.8218
- Rent YoY
- ▲ 1.92%
- Metro
- Allentown-Bethlehem-Easton, PA-NJ
- State GDP YoY
- ▲ 1.68%
- F500 in state
- 34
Industry mix (Fortune 500 HQ in PA)
| Industry | F500 HQs | Revenue |
|---|---|---|
| Healthcare | 2 | $309B |
|
||
| Insurance | 2 | $27B |
|
||
| Telecommunications / Media | 1 | $124B |
|
||
| Industrial Distribution | 1 | $22B |
|
||
| Financial Services | 1 | $20B |
|
||
| Chemicals / Materials | 1 | $18B |
|
||
Price history
1 event — show timeline
- 2026-06-04 Listed $25,000 GLVRMLS
Cash-flow waterfall
monthlySold comps — $/sqft
last 12 mo · ≤1 miLoading sold comps…