766 William Ave · Appling, GA
Flood risk 1/10 · Minimal
- FEMA flood zone
- X (unshaded)
- Chance of flooding over 30 yrs
- 0.0%
- Est. flood insurance / yr
- $507 – $1,088
Fire risk 4/10 · Minor
- Est. fire insurance / yr
- $963 – $1,789
Heat risk 6/10 · Moderate
- Hot days now (above 106°F)
- 7 days/yr
- Hot days in 30 yrs
- 17 days/yr
Wind risk 6/10 · Moderate
- Chance of severe wind over 30 yrs
- 51.0%
Air-quality risk 2/10 · Minimal
- Unhealthy air days now
- 1 days/yr
- Unhealthy air days in 30 yrs
- 1 days/yr
Risk factors via First Street. Map © Google.
Why this score? — see what drove the D grade
The composite is a weighted blend of 9 inputs, each scored 0–100. Each bar is that input's sub-score; the figure is the points it added to the 100-point composite (weight × sub-score).
- ARV discount +15.0/15.0
- Appreciation +10.0/10.0
- Schools +4.5/10.0
- Cash flow +3.3/30.0
- Livability +2.9/5.0
- Rent growth +2.5/5.0
- Condition / age +2.5/5.0
- 1% rule +0.0/10.0
- DSCR +0.0/10.0
$499,900
🖨 Deal sheet (PDF) 📄 Offer letter ✓ Due diligence
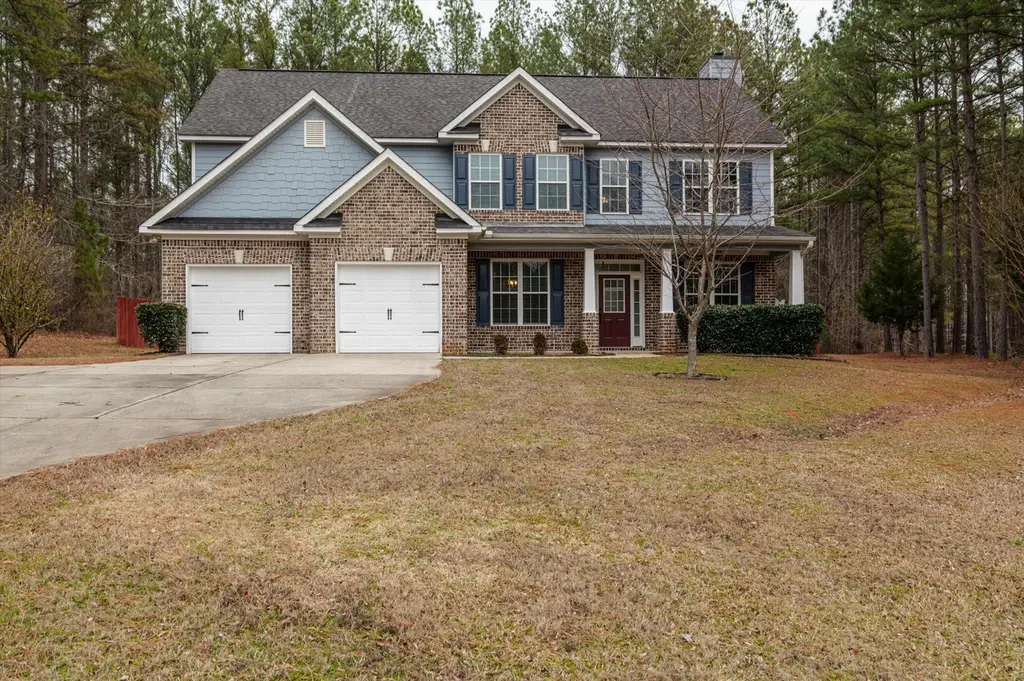
Listing remarks
Set on over 2.5 acres, this five-bedroom home delivers space, scale, and quiet luxury in a neighborhood designed for breathing room. From the moment you arrive, the welcoming front porch with Craftsman-style columns sets the tone for a home that blends classic design with modern comfort. Inside, a two-story foyer creates an immediate sense of arrival, flanked by a formal dining room with coffered ceilings and wainscoting -- ideal for hosting -- and a formal living room that easily doubles as a private home office or sitting room. The heart of the home opens into a spacious living area with a wood-burning fireplace that flows seamlessly into the kitchen, making everyday living and entertaini
Key facts
- Coffered ceilings
- Wainscoting
- Formal dining room
Tags
Property features AI
Finance
- Other: Zoning: R-A; Lot is approximately 2.56 acres; Subdivision: Mcconnell Run
Exterior
- Parking: Attached garage; Two garage spaces; Total of 2 parking spaces; Concrete driveway/parking pad
- Utilities: Water connected; Septic tank
- Home design: Single-family residence; Two stories; Entry level: 1; Residential property
- Construction: Brick, fiber cement and frame construction; Composition roof; Slab foundation; Built on two levels
- Exterior features: Covered patio; Porch with front porch; Privacy fencing around backyard; Outbuilding; Shaded/wooded lot; Landscaped yard; Front sprinklers; Paved road access; Has view
Interior
- Kitchen: Refrigerator; Range; Dishwasher; Microwave; Kitchen island; Pantry; Eat-in kitchen
- Bedrooms: Total of 9 rooms (bedroom count not specified separately)
- Flooring: Carpet; Ceramic tile
- Bathrooms: Three full bathrooms; Accessible full bath
- Heating & cooling: Central air; Ceiling fans; Forced air heating; Electric heating; Fireplace(s)
- Interior features: Walk-in closets; Tray ceilings; High ceilings; Entrance foyer; Kitchen island; Ceiling fans; Pantry; Eat-in kitchen; Window coverings
- Laundry & utility: Washer hookup; Dedicated laundry room; Electric water heater
Neighborhood map
What this means for you Summary
Snapshot
- This is a 4-bed/3.0-bath other listed at $500k.
Deal economics
- At list price, monthly cash flow is $-2k ($-19k/yr) — negative.
- To cash-flow at today's rent, offer at most $224k (55.1% below list).
- To meet the 1% rule (rent ≥ 1% of price), the offer needs to be $183k (63.4% below list).
- Recommended offer: $183k (63.4% below list) — sets the bar for 1% rule.
- Cap rate 2.5% vs local median 1.1% in Appling — top-decile yield for the area; either an underpriced asset or a hidden risk that comps aren't pricing in. Stress-test before assuming the spread holds.
Location & tenants
- Location reads 57/100 on livability (#457 in GA) — a working-class tenant base; expect higher turnover. Strengths: cost of living A; Watch: housing D+, amenities F, commute F.
- Columbia County (suburban): math 49% / reading 52% proficiency, ranked #13 of 174 in GA (top 8%) — acceptable for families but not a draw, mixed tenant base, ~2y average lease.
- Zoned schools: North Columbia Elementary School (math 67% / reading 67%, grade B+, #79 of 1,228 statewide, top 7%, 459 students, 22% FRL); Harlem Middle School (math 36% / reading 42%, grade F, #155 of 470 statewide, top 33%, 981 students, 39% FRL); Harlem High School (math 8% / reading 22%, grade F, #297 of 424 statewide, top 74%, 1,223 students, 33% FRL).
- Market conditions: 156 active listings in the ZIP; 1,213 units permitted in Columbia County in 2024 (0 in 5+ unit buildings).
Forward outlook
- In year one you build about $53k of equity ($3k loan paydown + $50k appreciation (10.0% local appreciation)).
- Columbia County population projected at +62% by 2050 — long-run rental-demand tailwind backs the buy-and-hold thesis.
- By year 2, paydown + projected appreciation supports a ~$86k cash-out refi (75% LTV) — recoverable capital for the next deal without selling this one.
Negotiation context
- It's been on market 41 days — a 3% lower offer ($485k) is reasonable based on typical stale-listing flexibility.
- 8 sale attempts since 16y ago; this cycle's ask has dropped $75k (13%) from the opening price — seller is motivated, your offer sets the floor, not the list.
- Current owner paid $359k; 39% above their basis — modest negotiation headroom, anchor on the comps not their cost.
Risks & watch-outs
- Climate carrying-cost: major wind risk, 51% chance of damaging wind over 30y; extreme-heat days projected 7→17/yr by 2055 (HVAC capex compounding) — expect insurance premiums to compound above CPI over the hold.
Questions for the listing agent
- What do current leases actually rent for vs. the listed asking? Can we see a recent rent roll and the last 12 months of T-12 income?
- It's been on market 41 days. Have you received any prior offers? Is the seller open to a 63% concession, seller financing, or rate buy-down credit?
- Is there a deadline driving the sale (1031 exchange, divorce, estate, relocation)? That informs how much negotiation room exists.
- The area grade is low — what's the realistic commute time and amenity access for the typical tenant pool here? Any planned neighborhood developments (good or bad) we should know about?
- What's the average days-on-market for RENTAL listings here right now (not sales)? A rising rental-DOM trend means longer vacancies and softer asking-rent achievability than the comps imply.
- What's the recent tenant-quality profile in this submarket — average credit score on applications, eviction rate, late-payment / NSF rate, and stable-employment percentage? A property-management company in the area should have these aggregated.
- How much new for-sale + rental construction is in the pipeline within 1–3 miles? Heavy new supply typically softens prices + rents 12–24 months out; constrained supply supports both.
Investment metrics
- 1% rule
- 0.37% ✗
- Cap rate
- 2.55%
- Cash-on-cash
- -13.38%
- DSCR
- 0.40
- GRM
- 22.8
CMA / ARV
- ARV (median comp)
- $649,224
- List price
- $499,900
- Delta
- -23.00%
- Verdict
- UNDERPRICED
- Comps
- 4 within 1.0 mi
Projected returns pro-forma
10.0% appreciation · 3.0% rent growth · sell at horizon
- IRR
- 14.9%
- Equity multiple
- 2.23×
- Total profit
- $172,643
- Equity at exit
- $450,350
- IRR
- 14.7%
- Equity multiple
- 5.19×
- Total profit
- $586,053
- Equity at exit
- $971,196
Cash invested: $139,972 (down + closing). Projections, not guarantees.
Landlord ↔ Tenant lean methodology
- Overall (STATE)
- 90 Strongly Landlord-Friendly
- State Georgia
- 90 Strongly Landlord-Friendly · R+3
- County
- — inherits STATE
- City
- — inherits STATE
ZIP-level market 30802
- Home prices YoY
- 4.8%
- Active inventory
- 156
- Price-to-rent
- 22.8×
Monthly cashflow live
- Estimated rent
- $1,830 medium interval (Pro) →
- Mortgage (P&I)
- −$2,622
- Tax from tax record
- −$176 /mo · $2,115/yr
- Insurance
- −$208
- HOA
- −$0
- Vacancy / Maint / Mgmt
- −$384
- Net cashflow
- $-1,560
Break-even live
Sensitivity live
| Price | -10% $-1,277 | -5% $-1,419 | +0% $-1,560 | +5% $-1,702 | +10% $-1,843 |
|---|---|---|---|---|---|
| Rent | -10% $-1,705 | -5% $-1,632 | +0% $-1,560 | +5% $-1,488 | +10% $-1,416 |
| Rate | -1.0pp $-1,308 | -0.5pp $-1,433 | base $-1,560 | +0.5pp $-1,690 | +1.0pp $-1,821 |
UW: 25.0% down · 7.5% · 30yr · 1.5% tax · 5.0% vac · 8.0% maint · 8.0% mgmt
Financing live
Cash to close
- Down payment
- $124,975
- Closing costs
- $14,997
- Reserves months
- —
- Total cash needed
- —
Loan-product check · same deal, 3 products live
Conventional
25% down · 7.5% · 30yr
- Down + closing
- —
- Monthly P&I
- —
- Monthly cashflow
- —
- DSCR
- —
- Eligible?
- —
Personal DTI + credit; lowest rate.
DSCR
20% down · 8.5% · 30yr
- Down + closing
- —
- Monthly P&I
- —
- Monthly cashflow
- —
- DSCR
- —
- Eligible?
- —
No personal income docs; deal must DSCR.
Hard money
10% down · 12.0% · 12mo
- Down + closing
- —
- Monthly P&I
- —
- Monthly cashflow
- —
- DSCR
- —
- Eligible?
- —
Short-term bridge; refi at stabilization.
Listing history 37 events
-
2026-06-22days on market $499,900 Active 41 DOM
-
2026-06-18days on market $499,900 Active 38 DOM
-
2026-06-17days on market $499,900 Active 37 DOM
-
2026-06-16days on market $499,900 Active 36 DOM
-
2026-06-15days on market $499,900 Active 35 DOM
-
2026-06-14days on market $499,900 Active 33 DOM
-
2026-06-13days on market $499,900 Active 32 DOM
-
2026-06-10days on market $499,900 Active 30 DOM
-
2026-06-09days on market $499,900 Active 29 DOM
-
2026-06-08days on market $499,900 Active 28 DOM
-
2026-06-07days on market $499,900 Active 27 DOM
-
2026-06-03days on market $499,900 Active 23 DOM
-
2026-06-02days on market $499,900 Active 22 DOM
-
2026-06-01days on market $499,900 Active 21 DOM
-
2026-05-31days on market $499,900 Active 20 DOM
-
2026-05-30days on market $499,900 Active 19 DOM
-
2026-05-11historical
-
2026-05-11historical
-
2026-05-07price $499,900
-
2026-04-13price $550,000
-
2026-02-22price $564,900
-
2026-01-26$575,000 Active
-
2026-01-26$499,900 Active
-
2025-08-26historical
-
2025-03-27$599,999
-
2025-03-27$599,999
-
2018-09-20soldstatus $359,000
-
2018-09-14soldstatus $359,000
-
2018-09-14soldstatus $359,000
-
2018-07-06$359,000
-
2018-07-06$359,000
-
2011-04-07soldstatus $41,500
-
2011-04-01soldstatus $41,500
-
2011-04-01soldstatus $41,500
-
2010-10-16$45,000
-
2010-10-16$45,000
-
2005-09-22soldstatus $1,250,000
ⓘ Source: listings_history table (triggers on properties + properties_extension) + one-shot
backfill from property_details.listing_events for pre-trigger history.
Tax reassessment forecast GA · Resets to sale price
- Current annual tax
- $2,115 · $176/mo
- Projected year-2 tax
- $4,599 · $383/mo
- Expected delta
- +$2,484/yr (+$207/mo · 117.4%)
ⓘ Screening estimate from a state-policy table — verify with the county assessor before closing.
Climate risk First Street
- Flood 1/10 Low FEMA zone X (unshaded) · 0% chance over 30 yrs
- Wildfire 4/10 Moderate
- Heat 6/10 Major 7 d/yr ≥106°F today · 17 d/yr by 30 yrs out
- Wind 6/10 Major 51% chance of damaging wind over 30 yrs
- Air quality 2/10 Low 1 unhealthy d/yr today · 1 by 30 yrs out
Nearby sold comps map
Loading sold comps map…
Walkable amenities ~0.75 mi
Loading nearby amenities…
Taxation est. · year 1
- Rental income
- $21,964
- − Mortgage interest
- −$28,002
- − Property taxes
- −$2,115
- − Insurance
- −$2,500
- − Repairs & maintenance
- −$1,757
- − Management
- −$1,757
- − Depreciation
- −$14,543
- Taxable loss
- −$28,710
- Est. tax savings @ 24.0%
- +$6,890
- After-tax cash flow
- $-11,832/yr
For passive investors: Depreciation is non-cash, so a rental often shows a tax loss while cash-flowing — sheltering income. Rental losses are passive: they offset passive income freely, and up to $25,000/yr can offset ordinary (W-2) income if you actively participate and your MAGI is under $100k (phasing out to $0 by $150k); unused losses carry forward. On sale, claimed depreciation is recaptured at up to 25%, and gains may owe capital-gains tax (a 1031 exchange can defer both). Figures are a year-1 estimate at your 24.0% rate — not tax advice; consult a CPA.
Schools (NCES district)
- District
- Columbia County
- NCES district ID
- 1301410
- Math proficiency
- 49% ▼ -6.00%
- Reading proficiency
- 52% ▼ -4.00%
- Median HH income
- $69,358
- Composite
- 45.04/100
- National rank
- #2695
- State rank
- #13 of 174 in GA
Livability — Appling
- Score
- 57/100
- State rank
- #457
- US rank
- #21719
Category grades
Schools grade is shown separately in the Schools card above.
Census & demographics
- Population (ZIP)
- 6,375
Population outlook (Columbia County) Hauer SSP2
- Today (2025)
- 189,073 people
- By 2030
- 212,277 · +12.3%
- By 2040
- 259,480 · +37.2%
- By 2050
- 306,991 · +62.4%
- By 2075
- 421,213 · +122.8%
- By 2100
- 496,722 · +162.7%
Race, ethnicity, and origin ACS 2023
- Neighborhood character
- Predominantly White (74%)
- Race & ethnicity
- White 74% Black 17% Two or more races 7% Hispanic / Latino 3%
- Common ancestry
- Serbian 3% Slovak 1% Italian 1%
- Foreign-born
- 1% · Canada
- Languages at home
- 97% English-only · Spanish 2%
Political lean MEDSL · Columbia
- 2024 margin
- Strong R (+25.6) · D 36.8% · R 62.5%
- 2008→2024 swing
- +17.0pp toward D · 2008: -42.7pp · 2024: -25.6pp
- All cycles
- 2024: R+25.6 2020: R+25.8 2016: R+37.7 2012: R+43.0 2008: R+42.7
Not yet ingested
- Civics
- —
Market trends
- HPI YoY
- ▲ 15.67%
- Current HPI
- 339.0061
- Rent YoY
- —
- Metro
- —
- State GDP YoY
- ▲ 2.66%
- F500 in state
- 28
Industry mix (Fortune 500 HQ in GA)
| Industry | F500 HQs | Revenue |
|---|---|---|
| Paper / Packaging | 2 | $29B |
|
||
| Retail | 1 | $160B |
|
||
| Transportation / Logistics | 1 | $91B |
|
||
| Airlines | 1 | $62B |
|
||
| Consumer Goods | 1 | $47B |
|
||
| Utilities | 1 | $25B |
|
||
Price history
-60.0% since first listed21 events — show timeline
- 2026-05-11 Listing Removed — Hive MLS
- 2026-05-11 Listing Removed — Hive MLS
- 2026-05-07 Price Changed $499,900 Hive MLS
- 2026-04-13 Price Changed $550,000 Hive MLS
- 2026-02-22 Price Changed $564,900 Hive MLS
- 2026-01-26 Listed $575,000 Hive MLS
- 2026-01-26 Listed $499,900 Hive MLS
- 2025-08-26 Listing Removed — Hive MLS
- 2025-03-27 Listed $599,999 Hive MLS
- 2025-03-27 Listed $599,999 Hive MLS
- 2018-09-20 Sold (Public Records) $359,000 Public Records
- 2018-09-14 Sold (MLS) $359,000 Hive MLS
- 2018-09-14 Sold (MLS) $359,000 Hive MLS
- 2018-07-06 Listed $359,000 Hive MLS
- 2018-07-06 Listed $359,000 Hive MLS
- 2011-04-07 Sold (Public Records) $41,500 Public Records
- 2011-04-01 Sold (MLS) $41,500 Hive MLS
- 2011-04-01 Sold (MLS) $41,500 Hive MLS
- 2010-10-16 Listed $45,000 Hive MLS
- 2010-10-16 Listed $45,000 Hive MLS
- 2005-09-22 Sold (Public Records) $1,250,000 Public Records
Property tax history
-2.1%/yrLatest (2025): $2,115 · +20.3% YoY. Source: county tax records.
Cash-flow waterfall
monthlySold comps — $/sqft
last 12 mo · ≤1 miLoading sold comps…