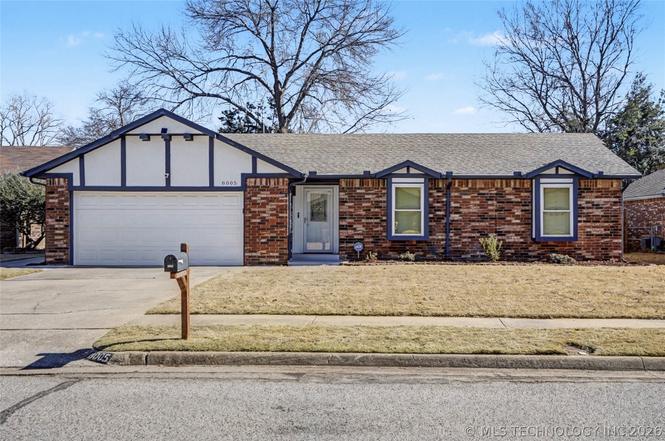
8005 S Date Ave · Broken Arrow, OK
Flood risk 1/10 · Minimal
- FEMA flood zone
- X (unshaded)
- Chance of flooding over 30 yrs
- 0.0%
- Est. flood insurance / yr
- $473 – $860
Fire risk 4/10 · Minor
- Est. fire insurance / yr
- $2,463 – $4,575
Heat risk 6/10 · Moderate
- Hot days now (above 111°F)
- 7 days/yr
- Hot days in 30 yrs
- 18 days/yr
Wind risk 3/10 · Minor
- Chance of severe wind over 30 yrs
- 5.0%
Air-quality risk 2/10 · Minimal
- Unhealthy air days now
- 1 days/yr
- Unhealthy air days in 30 yrs
- 1 days/yr
Risk factors via First Street. Map © Google.
Why this score? — see what drove the C grade
The composite is a weighted blend of 9 inputs, each scored 0–100. Each bar is that input's sub-score; the figure is the points it added to the 100-point composite (weight × sub-score).
- Cash flow +23.7/30.0
- DSCR +7.6/10.0
- ARV discount +7.2/15.0
- 1% rule +5.5/10.0
- Livability +3.9/5.0
- Rent growth +3.5/5.0
- Condition / age +2.5/5.0
- Schools +2.4/10.0
- Appreciation +0.0/10.0
$231,000
🖨 Deal sheet 📄 Offer letter ✓ Due diligence
Listing remarks MLS
Amazing energy efficient brick home offers upgraded low E windows & ceiling fans, vaulted living w/ fireplace & surround sound, master bath remodel, engineered hardwoods in bedroom, mature trees, gorgeous deck overlooking fully fenced back yard.
Key facts
- Covered patio
- Newer windows
- Updated bathrooms
Tags
Neighborhood map
What this means for you Summary
Snapshot
- This is a 3-bed/2.0-bath single-family listed at $231k.
Deal economics
- At list price, monthly cash flow is $440 ($5k/yr) — positive.
- The deal already cash-flows at list — no discount required.
- Meets the 1% rule at list price ($2k rent vs $231k).
- Cap rate 8.6% vs local median 4.0% in Broken Arrow — top-decile yield for the area; either an underpriced asset or a hidden risk that comps aren't pricing in. Stress-test before assuming the spread holds.
Location & tenants
- Location reads 78/100 on livability (#7 in OK, #2,691 nationally) — a middle-class / working-renter tenant base. Strengths: commute A+, cost of living A+, housing A+; Watch: schools D+, amenities F.
- Broken Arrow (suburban): math 23% / reading 28% proficiency, ranked #79 of 270 in OK (top 29%) — low school quality limits family demand, transient renter base, plan for 1-2y turnover.
- Market conditions: Rents rising fast (+4.1%/yr); 381 active listings in the ZIP; 6 comparable units currently listed for rent nearby; rentals leasing fast (median 3d on market — plan ~1-2 weeks tenant-placement turnaround); solid renter incomes; 2,818 units permitted in Tulsa County in 2024 (518 in 5+ unit buildings).
Forward outlook
- Local home prices are declining (-3.0%/yr); year-one equity from $2k of loan paydown is wiped out by about $7k of value loss. Plan a longer hold.
- Tulsa County population projected at +30% by 2050 — long-run rental-demand tailwind backs the buy-and-hold thesis.
Negotiation context
- Only 2 days on market — expect competitive offers; lowballing is unlikely to land.
- 7 sale attempts since 34y ago with the ask held roughly flat each time — persistent listings suggest the price (not the market) is what's stuck; bring a comps-based counter.
- Current owner paid $125k; list at $231k implies a 85% gain — meaningful room to come down on a strong offer.
Risks & watch-outs
- Climate carrying-cost: extreme-heat days projected 7→18/yr by 2055 (HVAC capex compounding) — expect insurance premiums to compound above CPI over the hold.
Questions for the listing agent
- Is there a deadline driving the sale (1031 exchange, divorce, estate, relocation)? That informs how much negotiation room exists.
- Schools are D-rated, which usually means shorter tenancies and higher turnover. Who's the typical renter profile here, and what's been the actual vacancy rate?
- What's the average days-on-market for RENTAL listings here right now (not sales)? A rising rental-DOM trend means longer vacancies and softer asking-rent achievability than the comps imply.
- What's the recent tenant-quality profile in this submarket — average credit score on applications, eviction rate, late-payment / NSF rate, and stable-employment percentage? A property-management company in the area should have these aggregated.
- How much new for-sale + rental construction is in the pipeline within 1–3 miles? Heavy new supply typically softens prices + rents 12–24 months out; constrained supply supports both.
Investment metrics
- 1% rule
- 1.05% ✓
- Cap rate
- 8.58%
- Cash-on-cash
- 8.16%
- DSCR
- 1.36
- GRM
- 8.0
CMA / ARV
- ARV (on-the-fly)
- $229,600
- Comps found
- 12
Show comp detail 12 sales within ~0.75 mi
| Address | Dist | Beds/Ba | Sqft | Sold | Price | $/sf | Match |
|---|---|---|---|---|---|---|---|
| 8005 S Date Ave | 0.00mi | 3/2.0 | 1,312 (0%) | 1mo | $230,000 | $175 | 99 |
| 8217 S Date Ave | 0.19mi | 3/2.0 | 1,326 (+1%) | 1mo | $235,500 | $178 | 88 |
| 8111 S Date Pl | 0.11mi | 3/1.5 | 1,259 (-4%) | 5mo | $208,000 | $165 | 82 |
| 8215 S Date St | 0.18mi | 3/2.0 | 1,266 (-4%) | 5mo | $210,000 | $166 | 82 |
| 809 W Glendale St | 0.35mi | 3/2.0 | 1,478 (+13%) | 4mo | $181,500 | $123 | 59 |
| 7508 S Lions Ave | 0.72mi | 3/2.0 | 1,252 (-5%) | 2mo | $185,000 | $148 | 57 |
| 7813 S Juniper Pl | 0.59mi | 3/2.0 | 1,342 (+2%) | 15mo | $250,000 | $186 | 56 |
| 1101 W Fredericksburg St | 0.62mi | 3/2.0 | 1,354 (+3%) | 18mo | $222,000 | $164 | 51 |
| 7208 S Lions Ave | 0.71mi | 3/2.0 | 1,446 (+10%) | 2mo | $277,144 | $192 | 48 |
| 1208 W Huntsville St | 0.70mi | 3/2.0 | 1,242 (-5%) | 13mo | $230,000 | $185 | 48 |
| 1117 W Fredericksburg St | 0.68mi | 3/2.0 | 1,241 (-5%) | 17mo | $207,500 | $167 | 45 |
| 7805 S Juniper Pl | 0.59mi | 3/2.0 | 1,188 (-10%) | 16mo | $211,000 | $178 | 43 |
Match score weights: distance 35% · size 25% · config 20% · recency 20%. Top-matched comps best support the ARV.
Projected returns pro-forma
-3.0% appreciation · 4.09% rent growth · sell at horizon
- IRR
- -2.8%
- Equity multiple
- 0.89×
- Total profit
- $-6,799
- Equity at exit
- $34,443
- IRR
- 8.0%
- Equity multiple
- 1.64×
- Total profit
- $41,189
- Equity at exit
- $19,973
Cash invested: $64,680 (down + closing). Projections, not guarantees.
Landlord ↔ Tenant lean methodology
- Overall (STATE)
- 83 Strongly Landlord-Friendly
- State Oklahoma
- 83 Strongly Landlord-Friendly · R+20
- County
- — inherits STATE
- City
- — inherits STATE
ZIP-level market 74011
- Rents YoY
- 4.1%
- Active inventory
- 381
- Price-to-rent
- 8.0×
Monthly cashflow live
- Estimated rent
- $2,414 high interval (Pro) →
- Mortgage (P&I)
- −$1,211
- Tax from tax record
- −$160 /mo · $1,922/yr
- Insurance
- −$96
- HOA
- −$0
- Vacancy / Maint / Mgmt
- −$507
- Net cashflow
- $440
Break-even live
UW: 25.0% down · 7.5% · 30yr · 1.5% tax · 5.0% vac · 8.0% maint · 8.0% mgmt
Financing live
Cash to close
- Down payment
- $57,750
- Closing costs
- $6,930
- Reserves months
- —
- Total cash needed
- —
Loan-product check · same deal, 3 products live
Conventional
25% down · 7.5% · 30yr
- Down + closing
- —
- Monthly P&I
- —
- Monthly cashflow
- —
- DSCR
- —
- Eligible?
- —
Personal DTI + credit; lowest rate.
DSCR
20% down · 8.5% · 30yr
- Down + closing
- —
- Monthly P&I
- —
- Monthly cashflow
- —
- DSCR
- —
- Eligible?
- —
No personal income docs; deal must DSCR.
Hard money
10% down · 12.0% · 12mo
- Down + closing
- —
- Monthly P&I
- —
- Monthly cashflow
- —
- DSCR
- —
- Eligible?
- —
Short-term bridge; refi at stabilization.
Rent comps 6 comps
| Address | Beds | Baths | Sqft | Rent | $/sqft | DOM | Units | Dist |
|---|---|---|---|---|---|---|---|---|
| 6308 S 1st Pl Broken Arrow, OK | 3.0 | 2.0 | 1600 | $3,400 | $2.12 | 16d | 1 | 0.92mi |
| 2008 W Huntsville Pl Broken Arrow, OK | 3.0 | 2.0 | 1568 | $2,100 | $1.34 | 3d | 1 | 1.17mi |
| 7313 S Walnut Ave Broken Arrow, OK | 3.0 | 2.0 | 1600 | $1,990 | $1.24 | 10d | 1 | 1.18mi |
| 2420 W Imperial Ct Broken Arrow, OK | 3.0 | 2.0 | 1726 | $2,415 | $1.40 | 2d | 1 | 1.44mi |
| 2421 W Imperial Ct Broken Arrow, OK | 3.0 | 2.0 | 1726 | $2,415 | $1.40 | 2d | 1 | 1.45mi |
| 2430 W Imperial Ct Broken Arrow, OK | 3.0 | 2.0 | 1726 | $2,415 | $1.40 | 2d | 1 | 1.46mi |
Listing history 19 events
-
2026-03-15status Pending
-
2026-03-15status Active
-
2026-03-15price $231,000
-
2026-03-15status Pending
-
2026-03-13$229,900 Active
-
2016-09-15soldstatus $125,000
-
2016-09-13historical 257-char remark
Show marketing remark (257 chars)
Amazing energy efficient brick home offers upgraded low E windows & ceiling fans, vaulted living w/ fireplace & surround sound, master bath remodel, engineered hardwoods in bedroom, mature trees, gorgeous deck overlooking fully fenced back yard.
-
2016-09-12soldstatus $125,000 Closed 257-char remark
Show marketing remark (257 chars)
Amazing energy efficient brick home offers upgraded low E windows & ceiling fans, vaulted living w/ fireplace & surround sound, master bath remodel, engineered hardwoods in bedroom, mature trees, gorgeous deck overlooking fully fenced back yard.
-
2016-07-21status Pending 257-char remark
Show marketing remark (257 chars)
Amazing energy efficient brick home offers upgraded low E windows & ceiling fans, vaulted living w/ fireplace & surround sound, master bath remodel, engineered hardwoods in bedroom, mature trees, gorgeous deck overlooking fully fenced back yard.
-
2016-07-16$124,500 Active 257-char remark
Show marketing remark (257 chars)
Amazing energy efficient brick home offers upgraded low E windows & ceiling fans, vaulted living w/ fireplace & surround sound, master bath remodel, engineered hardwoods in bedroom, mature trees, gorgeous deck overlooking fully fenced back yard.
-
2009-07-08soldstatus $92,000 113-char remark
Show marketing remark (113 chars)
Indian Springs Subdivision~~~3 bedrooms, 2 baths, 2 car garage, new roof & central H & A in March 2009.
-
2009-06-11historical 113-char remark
Show marketing remark (113 chars)
Indian Springs Subdivision~~~3 bedrooms, 2 baths, 2 car garage, new roof & central H & A in March 2009.
-
2009-04-28$104,900 113-char remark
Show marketing remark (113 chars)
Indian Springs Subdivision~~~3 bedrooms, 2 baths, 2 car garage, new roof & central H & A in March 2009.
-
2008-09-25historical
-
2008-08-29$83,000
-
1995-05-09soldstatus $63,000
-
1995-02-17$65,500
-
1993-02-11soldstatus $61,500
-
1992-08-09$64,950
ⓘ Source: listings_history table (triggers on properties + properties_extension) + one-shot
backfill from property_details.listing_events for pre-trigger history.
Tax reassessment forecast OK · Resets to sale price
- Current annual tax
- $1,922 · $160/mo
- Projected year-2 tax
- $2,079 · $173/mo
- Expected delta
- +$157/yr (+$13/mo · 8.2%)
ⓘ Screening estimate from a state-policy table — verify with the county assessor before closing.
Climate risk First Street
- Flood 1/10 Low FEMA zone X (unshaded) · 0% chance over 30 yrs
- Wildfire 4/10 Moderate
- Heat 6/10 Major 7 d/yr ≥111°F today · 18 d/yr by 30 yrs out
- Wind 3/10 Moderate 5% chance of damaging wind over 30 yrs
- Air quality 2/10 Low 1 unhealthy d/yr today · 1 by 30 yrs out
Nearby sold comps map
Loading sold comps map…
Walkable amenities ~0.75 mi
Loading nearby amenities…
Taxation est. · year 1
- Rental income
- $28,973
- − Mortgage interest
- −$12,940
- − Property taxes
- −$1,922
- − Insurance
- −$1,155
- − Repairs & maintenance
- −$2,318
- − Management
- −$2,318
- − Depreciation
- −$6,720
- Taxable income
- $1,601
- Est. tax owed @ 24.0%
- −$384
- After-tax cash flow
- $4,891/yr
For passive investors: Depreciation is non-cash, so a rental often shows a tax loss while cash-flowing — sheltering income. Rental losses are passive: they offset passive income freely, and up to $25,000/yr can offset ordinary (W-2) income if you actively participate and your MAGI is under $100k (phasing out to $0 by $150k); unused losses carry forward. On sale, claimed depreciation is recaptured at up to 25%, and gains may owe capital-gains tax (a 1031 exchange can defer both). Figures are a year-1 estimate at your 24.0% rate — not tax advice; consult a CPA.
Schools (NCES district)
- District
- Broken Arrow
- NCES district ID
- 4005490
- Math proficiency
- 23% ▼ -9.00%
- Reading proficiency
- 28% ▼ -9.00%
- Median HH income
- $64,646
- Composite
- 23.86/100
- National rank
- #7801
- State rank
- #79 of 270 in OK
Livability — Broken Arrow
- Score
- 78/100
- State rank
- #7
- US rank
- #2691
Category grades
Schools grade is shown separately in the Schools card above.
Census & demographics
- Census place
- Broken Arrow, OK
- County
- Tulsa County · 640,811 people
- City population
- 144,172
- Metro
- Tulsa, OK
- Population (ZIP)
- 33,900
- Household income
- $99,157
- Rent vs Own
- Severe rent burden
- 389.0
Population outlook (Tulsa County) Hauer SSP2
- Today (2025)
- 723,846 people
- By 2030
- 766,033 · +5.8%
- By 2040
- 851,386 · +17.6%
- By 2050
- 938,389 · +29.6%
- By 2075
- 1,166,011 · +61.1%
- By 2100
- 1,350,277 · +86.5%
Race, ethnicity, and origin ACS 2023
- Neighborhood character
- Predominantly White (68%)
- Race & ethnicity
- White 68% Two or more races 15% Hispanic / Latino 10% Native American 4% Black 4% Asian 3%
- Hispanic origin (detail)
- Mexican 7%
- Common ancestry
- Lithuanian 3% Serbian 2% Slovak 2%
- Foreign-born
- 5% · Canada
- Languages at home
- 93% English-only · Spanish 5% Other Asian/Pacific 1%
Political lean MEDSL · Tulsa
- 2024 margin
- R (+15.2) · D 41.3% · R 56.5% · Other 2.2%
- 2008→2024 swing
- +9.2pp toward D · 2008: -24.5pp · 2024: -15.2pp
- All cycles
- 2024: R+15.2 2020: R+15.6 2016: R+22.9 2012: R+27.4 2008: R+24.5
Not yet ingested
- Civics
- —
Market trends
- HPI YoY
- ▼ -180.15%
- Current HPI
- 210.8302
- Rent YoY
- ▲ 4.09%
- Metro
- Tulsa, OK
- State GDP YoY
- ▲ 1.55%
- F500 in state
- 6
Industry mix (Fortune 500 HQ in OK)
| Industry | F500 HQs | Revenue |
|---|---|---|
| Energy | 3 | $48B |
|
||
Price history
+255.7% since first listed19 events — show timeline
- 2026-03-15 Pending — MLS Technology, Inc.
- 2026-03-15 Relisted — MLS Technology, Inc.
- 2026-03-15 Price Changed $231,000 MLS Technology, Inc.
- 2026-03-15 Pending — MLS Technology, Inc.
- 2026-03-13 Listed $229,900 MLS Technology, Inc.
- 2016-09-15 Sold (Public Records) $125,000 Public Records
- 2016-09-13 Listing Removed — MLS Technology, Inc.
- 2016-09-12 Sold (MLS) $125,000 MLS Technology, Inc.
- 2016-07-21 Pending — MLS Technology, Inc.
- 2016-07-16 Listed $124,500 MLS Technology, Inc.
- 2009-07-08 Sold (MLS) $92,000 MLS Technology, Inc.
- 2009-06-11 Listing Removed — MLS Technology, Inc.
- 2009-04-28 Listed $104,900 MLS Technology, Inc.
- 2008-09-25 Listing Removed — MLS Technology, Inc.
- 2008-08-29 Listed $83,000 MLS Technology, Inc.
- 1995-05-09 Sold (Public Records) $63,000 Public Records
- 1995-02-17 Listed $65,500 MLS Technology, Inc.
- 1993-02-11 Sold (Public Records) $61,500 Public Records
- 1992-08-09 Listed $64,950 MLS Technology, Inc.
Property tax history
+3.4%/yrLatest (2025): $1,922 · +3.1% YoY. Source: county tax records.
Cash-flow waterfall
monthlySold comps — $/sqft
last 12 mo · ≤1 miLoading sold comps…