 🏗️ New Construction
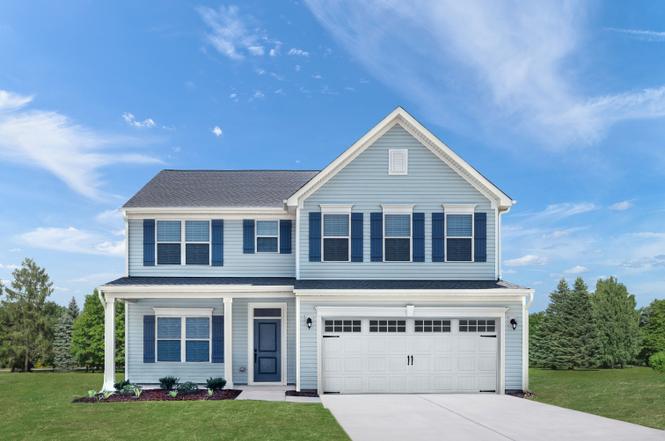
Hudson Plan · Charleston, SC
Flood risk No data
- FEMA flood zone
- —
- Chance of flooding over 30 yrs
- —
- Est. flood insurance / yr
- —
Fire risk No data
- Est. fire insurance / yr
- —
Heat risk No data
- Hot days now (above threshold)
- —
- Hot days in 30 yrs
- —
Wind risk No data
- Chance of severe wind over 30 yrs
- —
Air-quality risk No data
- Unhealthy air days now
- —
- Unhealthy air days in 30 yrs
- —
Risk factors via First Street. Map © Google.
Why this score? — see what drove the D+ grade
The composite is a weighted blend of 9 inputs, each scored 0–100. Each bar is that input's sub-score; the figure is the points it added to the 100-point composite (weight × sub-score).
- Cash flow +14.6/30.0
- ARV discount +7.5/15.0
- DSCR +4.4/10.0
- Appreciation +4.4/10.0
- 1% rule +4.0/10.0
- Livability +3.8/5.0
- Schools +3.6/10.0
- Rent growth +2.5/5.0
- Condition / age +2.5/5.0
$499,990
🖨 Deal sheet 📄 Offer letter ✓ Due diligence
Listing remarks
Welcome to Cainhoy Preserve by Ryan Homes, the only new homes 20 minutes to Mount Pleasant from the $400s. The Hudson single-family home fits the way you live. Flex space can be used as a playroom, a library and more. Gather in the spacious family room, which flows into the dining room and gourmet kitchen, separated by a convenient breakfast bar. Off the 2-car garage, a family entry controls clutter, while a quiet study is tucked away. Upstairs, 3 bedrooms offer abundant closet space and a full bath provides privacy. Your luxurious owner's bath will stun with its double bowl vanity and huge walk-in closet. Everyday life gets easier in the Hudson with quick access to Point Hope Commons, Moun
Key facts
- Double bowl vanity
- Quiet study
- Family entry
Tags
Property features AI
Finance
- Other: Listing status: Active; List price: $509,990
Exterior
- Parking: 2 parking spaces
- Utilities: Central air (cooling)
- Home design: Hudson plan (new construction plan)
Interior
- Bedrooms: 5 bedrooms
- Bathrooms: 3 full bathrooms
- Heating & cooling: Central air conditioning
- Interior features: Open living area of approximately 2718 total living space
Neighborhood map
What this means for you Summary
Snapshot
- This is a 4-bed/2.5-bath single-family listed at $500k.
Deal economics
- At list price, monthly cash flow is $133 ($2k/yr) — positive.
- The deal already cash-flows at list — no discount required.
- Meets the 1% rule at list price ($5k rent vs $500k).
- Recommended offer: $440k (12.0% below list) — sets the bar for market timing.
- Cap rate 6.6% vs local median 2.4% in Charleston — top-decile yield for the area; either an underpriced asset or a hidden risk that comps aren't pricing in. Stress-test before assuming the spread holds.
Location & tenants
- Location reads 76/100 on livability (#22 in SC, #3,336 nationally) — a middle-class / working-renter tenant base. Strengths: amenities A+, housing A+, health & safety A+; Watch: crime D+, commute F, cost of living D-.
- Berkeley 01 (suburban): math 35% / reading 48% proficiency, ranked #30 of 80 in SC (top 38%) — families likely to look elsewhere, expect single-tenant / working-renter base with shorter leases.
- Market conditions: 69 active listings in the ZIP; 3,183 units permitted in Berkeley County in 2024 (580 in 5+ unit buildings).
Forward outlook
- Local home prices are declining (-1.1%/yr); year-one equity from $4k of loan paydown is wiped out by about $6k of value loss. Plan a longer hold.
- Berkeley County population projected at +48% by 2050 — long-run rental-demand tailwind backs the buy-and-hold thesis.
Negotiation context
- It's been on market 134 days — a 12% lower offer ($440k) is reasonable based on typical stale-listing flexibility.
Questions for the listing agent
- It's been on market 134 days. Have you received any prior offers? Is the seller open to a 12% concession, seller financing, or rate buy-down credit?
- Why hasn't it sold? Are there any deal-killer items the seller is aware of (foundation, flood, title, zoning, code violations)?
- Is there a deadline driving the sale (1031 exchange, divorce, estate, relocation)? That informs how much negotiation room exists.
- Schools are A-rated — typically a magnet for longer-tenancy family renters. What's the average tenant stay here, and is there a school-zone premium baked into asking?
- Crime grade is D in this area — have there been break-ins, vandalism, or insurance claims at this property in the last 3 years? What carrier currently insures it and at what premium?
- The area grade is low — what's the realistic commute time and amenity access for the typical tenant pool here? Any planned neighborhood developments (good or bad) we should know about?
- What's the average days-on-market for RENTAL listings here right now (not sales)? A rising rental-DOM trend means longer vacancies and softer asking-rent achievability than the comps imply.
- What's the recent tenant-quality profile in this submarket — average credit score on applications, eviction rate, late-payment / NSF rate, and stable-employment percentage? A property-management company in the area should have these aggregated.
- How much new for-sale + rental construction is in the pipeline within 1–3 miles? Heavy new supply typically softens prices + rents 12–24 months out; constrained supply supports both.
Investment metrics
- 1% rule
- 0.90% ✗
- Cap rate
- 6.57%
- Cash-on-cash
- 1.01%
- DSCR
- 1.04
- GRM
- 9.2
CMA / ARV
- ARV (on-the-fly)
- $568,062
- Comps found
- 12
Show comp detail 12 sales within ~0.75 mi
| Address | Dist | Beds/Ba | Sqft | Sold | Price | $/sf | Match |
|---|---|---|---|---|---|---|---|
| 137 Royal Cainhoy Way | 0.49mi | 4/2.5 | 2,602 (-4%) | 10mo | $540,457 | $208 | 62 |
| 128 Royal Cainhoy Way | 0.42mi | 4/3.0 | 2,602 (-4%) | 13mo | $527,940 | $203 | 60 |
| 107 Royal Cainhoy Way | 0.40mi | 5/3.0 (+1) | 2,602 (-4%) | 9mo | $504,890 | $194 | 59 |
| 121 Royal Cainhoy Way | 0.44mi | 5/3.0 (+1) | 2,602 (-4%) | 9mo | $474,690 | $182 | 58 |
| 104 Royal Cainhoy Way | 0.36mi | 4/3.5 | 2,394 (-12%) | 6mo | $524,990 | $219 | 54 |
| 106 Royal Cainhoy Way | 0.37mi | 4/3.5 | 2,394 (-12%) | 7mo | $499,890 | $209 | 53 |
| 154 Royal Cainhoy Way | 0.42mi | 4/3.5 | 2,394 (-12%) | 9mo | $453,687 | $190 | 49 |
| 163 Royal Cainhoy Way | 0.39mi | 4/3.5 | 2,394 (-12%) | 11mo | $534,890 | $223 | 49 |
| 125 Royal Cainhoy Way | 0.45mi | 3/2.5 (-1) | 2,394 (-12%) | 9mo | $489,990 | $205 | 47 |
| 118 Royal Cainhoy Way | 0.39mi | 3/2.5 (-1) | 2,394 (-12%) | 13mo | $520,415 | $217 | 46 |
| 147 Royal Cainhoy Way | 0.47mi | 4/3.5 | 2,394 (-12%) | 13mo | $499,615 | $209 | 44 |
| 132 Royal Cainhoy Way | 0.44mi | 3/2.5 (-1) | 2,394 (-12%) | 14mo | $514,790 | $215 | 43 |
Match score weights: distance 35% · size 25% · config 20% · recency 20%. Top-matched comps best support the ARV.
Projected returns pro-forma
-1.12% appreciation · 3.0% rent growth · sell at horizon
- IRR
- -5.4%
- Equity multiple
- 0.77×
- Total profit
- $-37,176
- Equity at exit
- $133,960
- IRR
- 1.5%
- Equity multiple
- 1.14×
- Total profit
- $22,099
- Equity at exit
- $137,991
Cash invested: $159,057 (down + closing). Projections, not guarantees.
Landlord ↔ Tenant lean methodology
- Overall (STATE)
- 90 Strongly Landlord-Friendly
- State South Carolina
- 90 Strongly Landlord-Friendly · R+6
- County
- — inherits STATE
- City
- — inherits STATE
ZIP-level market 29450
- Home prices YoY
- -0.2%
- Active inventory
- 69
- Price-to-rent
- 8.1×
Monthly cashflow live
- Estimated rent
- $5,138 medium interval (Pro) →
- Mortgage (P&I)
- −$2,979
- Tax est. 1.5%
- −$710 /mo · $8,521/yr
- Insurance
- −$237
- HOA
- −$0
- Vacancy / Maint / Mgmt
- −$1,079
- Net cashflow
- $133
Break-even live
UW: 25.0% down · 7.5% · 30yr · 1.5% tax · 5.0% vac · 8.0% maint · 8.0% mgmt
Financing live
Cash to close
- Down payment
- $142,016
- Closing costs
- $17,042
- Reserves months
- —
- Total cash needed
- —
Loan-product check · same deal, 3 products live
Conventional
25% down · 7.5% · 30yr
- Down + closing
- —
- Monthly P&I
- —
- Monthly cashflow
- —
- DSCR
- —
- Eligible?
- —
Personal DTI + credit; lowest rate.
DSCR
20% down · 8.5% · 30yr
- Down + closing
- —
- Monthly P&I
- —
- Monthly cashflow
- —
- DSCR
- —
- Eligible?
- —
No personal income docs; deal must DSCR.
Hard money
10% down · 12.0% · 12mo
- Down + closing
- —
- Monthly P&I
- —
- Monthly cashflow
- —
- DSCR
- —
- Eligible?
- —
Short-term bridge; refi at stabilization.
Listing history 15 events
-
2026-06-18days on market $499,990 Active 134 DOM
-
2026-06-17days on market $499,990 Active 133 DOM
-
2026-06-16days on market $499,990 Active 132 DOM
-
2026-06-15days on market $499,990 Active 131 DOM
-
2026-06-13days on market $499,990 Active 129 DOM
-
2026-06-13days on market $499,990 Active 128 DOM
-
2026-06-10days on market $499,990 Active 126 DOM
-
2026-06-09days on market $499,990 Active 125 DOM
-
2026-06-08days on market $499,990 Active 124 DOM
-
2026-06-07days on market $499,990 Active 123 DOM
-
2026-06-05days on market $499,990 Active 120 DOM
-
2026-06-03pricedays on market $499,990 Active 119 DOM
-
2026-06-03days on market $509,990 Active 118 DOM
-
2026-06-01days on market $509,990 Active 117 DOM
-
2026-05-31days on market $509,990 Active 116 DOM
ⓘ Source: listings_history table (triggers on properties + properties_extension) + one-shot
backfill from property_details.listing_events for pre-trigger history.
Nearby sold comps map
Loading sold comps map…
Walkable amenities ~0.75 mi
Loading nearby amenities…
Taxation est. · year 1
- Rental income
- $61,657
- − Mortgage interest
- −$31,820
- − Property taxes
- −$8,521
- − Insurance
- −$2,840
- − Repairs & maintenance
- −$4,933
- − Management
- −$4,933
- − Depreciation
- −$16,525
- Taxable loss
- −$7,915
- Est. tax savings @ 24.0%
- +$1,900
- After-tax cash flow
- $3,500/yr
For passive investors: Depreciation is non-cash, so a rental often shows a tax loss while cash-flowing — sheltering income. Rental losses are passive: they offset passive income freely, and up to $25,000/yr can offset ordinary (W-2) income if you actively participate and your MAGI is under $100k (phasing out to $0 by $150k); unused losses carry forward. On sale, claimed depreciation is recaptured at up to 25%, and gains may owe capital-gains tax (a 1031 exchange can defer both). Figures are a year-1 estimate at your 24.0% rate — not tax advice; consult a CPA.
Schools (NCES district)
- District
- Berkeley 01
- NCES district ID
- 4501170
- Math proficiency
- 35% ▼ -8.00%
- Reading proficiency
- 48% ▼ -2.00%
- Median HH income
- $52,724
- Composite
- 35.95/100
- National rank
- #4799
- State rank
- #30 of 80 in SC
Livability — Charleston
- Score
- 76/100
- State rank
- #22
- US rank
- #3336
Category grades
Schools grade is shown separately in the Schools card above.
Census & demographics
- City population
- 200,573
- Population (ZIP)
- 3,124
Population outlook (Berkeley County) Hauer SSP2
- Today (2025)
- 254,184 people
- By 2030
- 279,677 · +10.0%
- By 2040
- 329,379 · +29.6%
- By 2050
- 375,557 · +47.8%
- By 2075
- 476,740 · +87.6%
- By 2100
- 535,945 · +110.8%
Race, ethnicity, and origin ACS 2023
- Neighborhood character
- Majority Black (64%)
- Race & ethnicity
- Black 64% White 25% Hispanic / Latino 9% Two or more races 4%
- Hispanic origin (detail)
- Mexican 6% Dominican 2%
- Common ancestry
- Serbian 7% Italian 1% Lithuanian 1%
- Foreign-born
- 2% · Canada
- Languages at home
- 96% English-only · Spanish 3%
Political lean MEDSL · Berkeley
- 2024 margin
- R (+16.3) · D 41.1% · R 57.4% · Other 1.4%
- 2008→2024 swing
- -3.2pp toward R · 2008: -13.1pp · 2024: -16.3pp
- All cycles
- 2024: R+16.3 2020: R+11.7 2016: R+17.4 2012: R+18.9 2008: R+13.1
Not yet ingested
- Civics
- —
Market trends
- HPI YoY
- ▼ -1.12%
- Current HPI
- 462.4619
- Rent YoY
- —
- Metro
- —
- State GDP YoY
- ▲ 4.51%
- F500 in state
- 2
Industry mix (Fortune 500 HQ in SC)
| Industry | F500 HQs | Revenue |
|---|---|---|
| Packaging | 1 | $7B |
|
||
Cash-flow waterfall
monthlySold comps — $/sqft
last 12 mo · ≤1 miLoading sold comps…