 Multi-family
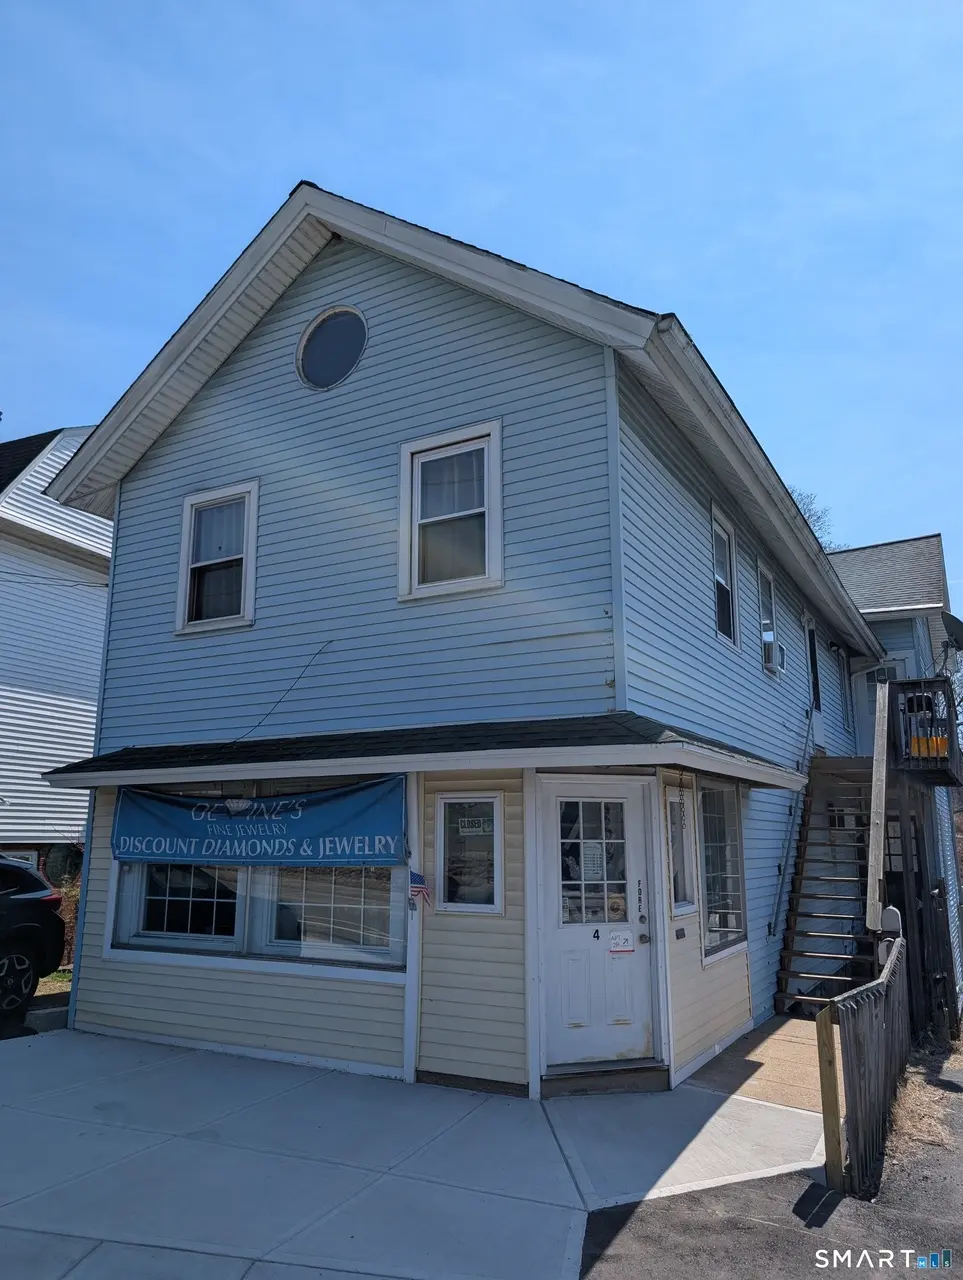
4 Summit St · East Hampton, CT
Flood risk No data
- FEMA flood zone
- —
- Chance of flooding over 30 yrs
- —
- Est. flood insurance / yr
- —
Fire risk No data
- Est. fire insurance / yr
- —
Heat risk No data
- Hot days now (above threshold)
- —
- Hot days in 30 yrs
- —
Wind risk No data
- Chance of severe wind over 30 yrs
- —
Air-quality risk No data
- Unhealthy air days now
- —
- Unhealthy air days in 30 yrs
- —
Risk factors via First Street. Map © Google.
Why this score? — see what drove the D+ grade
The composite is a weighted blend of 9 inputs, each scored 0–100. Each bar is that input's sub-score; the figure is the points it added to the 100-point composite (weight × sub-score).
- Cash flow +18.0/30.0
- ARV discount +7.5/15.0
- DSCR +5.6/10.0
- 1% rule +4.8/10.0
- Schools +4.8/10.0
- Livability +4.1/5.0
- Rent growth +2.5/5.0
- Condition / age +2.2/5.0
- Appreciation +0.0/10.0
$550,000
🖨 Deal sheet (PDF) 📄 Offer letter ✓ Due diligence
Multi-family units
County records classify this as Multi-Family (2-4 Unit). Listing-text estimate: 1 unit. estimate disagrees with records
Listing remarks MLS
Investment opportunity in East Hampton Village Center. 4 units + 1 store front. Individual utilities and fully rented in month-to-month leases.
Key facts
- 4 units
- Individual utilities
- 1 store front
Tags
Neighborhood map
What this means for you Summary
Snapshot
- This is a 4-bed/4.0-bath multifamily listed at $550k. Condition is rated fair.
Deal economics
- At list price, monthly cash flow is $474 ($6k/yr) — positive.
- The deal already cash-flows at list — no discount required.
- To meet the 1% rule (rent ≥ 1% of price), the offer needs to be $541k (1.6% below list).
- Recommended offer: $517k (6.0% below list) — sets the bar for market timing.
- Cap rate 7.3% vs local median 2.0% in East Hampton — top-decile yield for the area; either an underpriced asset or a hidden risk that comps aren't pricing in. Stress-test before assuming the spread holds.
Location & tenants
- Location reads 82/100 on livability (#13 in CT, #1,301 nationally) — a professional / high-income tenant draw. Strengths: crime A+, employment A+, housing A+; Watch: amenities C-, commute F.
- East Hampton School District (town): math 43% / reading 59% proficiency, ranked #70 of 153 in CT (top 46%) — acceptable for families but not a draw, mixed tenant base, ~2y average lease; only 10% free/reduced lunch — higher-income household profile.
- Market conditions: 60 active listings in the ZIP; 278 units permitted in Lower Connecticut River Valley Planning Region in 2024 (89 in 5+ unit buildings).
Forward outlook
- Local home prices are declining (-3.0%/yr); year-one equity from $4k of loan paydown is wiped out by about $16k of value loss. Plan a longer hold.
Negotiation context
- It's been on market 65 days — a 6% lower offer ($517k) is reasonable based on typical stale-listing flexibility.
Risks & watch-outs
- Watch-outs: built in 1890 — expect roof / HVAC / electrical / plumbing capex.
Questions for the listing agent
- It's been on market 65 days. Have you received any prior offers? Is the seller open to a 6% concession, seller financing, or rate buy-down credit?
- Have any recent inspections been done? Can we get a copy of the seller's disclosures and any deferred-maintenance estimates?
- Built in 1890 — when were the roof, HVAC, electrical panel, plumbing, and water heater last replaced?
- Why hasn't it sold? Are there any deal-killer items the seller is aware of (foundation, flood, title, zoning, code violations)?
- Is there a deadline driving the sale (1031 exchange, divorce, estate, relocation)? That informs how much negotiation room exists.
- Schools are B-rated — typically a magnet for longer-tenancy family renters. What's the average tenant stay here, and is there a school-zone premium baked into asking?
- The area grade is low — what's the realistic commute time and amenity access for the typical tenant pool here? Any planned neighborhood developments (good or bad) we should know about?
- What's the average days-on-market for RENTAL listings here right now (not sales)? A rising rental-DOM trend means longer vacancies and softer asking-rent achievability than the comps imply.
- What's the recent tenant-quality profile in this submarket — average credit score on applications, eviction rate, late-payment / NSF rate, and stable-employment percentage? A property-management company in the area should have these aggregated.
- How much new apartment / multifamily construction is in the pipeline within 1–3 miles? Heavy new supply (>2% of stock underway) typically softens rents 12–24 months out; light construction supports rent growth.
Investment metrics
- 1% rule
- 0.98% ✗
- Cap rate
- 7.33%
- Cash-on-cash
- 3.69%
- DSCR
- 1.16
- GRM
- 8.5
CMA / ARV
- ARV (median comp)
- $335,779
- List price
- $550,000
- Delta
- 63.80%
- Verdict
- OVERPRICED
- Comps
- 10 within 1.0 mi
Show comp detail 4 sales within ~0.75 mi
| Address | Dist | Beds/Ba | Sqft | Sold | Price | $/sf | Match |
|---|---|---|---|---|---|---|---|
| 7-A Barton Hill Rd | 0.15mi | 4/3.0 | 1,760 (+4%) | 24mo | $255,000 | $145 | 64 |
| 8 Skinner St | 0.21mi | 3/2.0 (-1) | 1,740 (+2%) | 12mo | $330,000 | $190 | 63 |
| 24 N Main St | 0.71mi | 4/2.0 | 1,794 (+6%) | 2mo | $380,000 | $212 | 48 |
| 7 Main St | 0.43mi | 4/3.0 | 1,955 (+15%) | 14mo | $350,000 | $179 | 40 |
Match score weights: distance 35% · size 25% · config 20% · recency 20%. Top-matched comps best support the ARV.
Projected returns pro-forma
-3.0% appreciation · 3.0% rent growth · sell at horizon
- IRR
- -10.5%
- Equity multiple
- 0.62×
- Total profit
- $-58,868
- Equity at exit
- $82,007
- IRR
- -1.1%
- Equity multiple
- 0.92×
- Total profit
- $-12,075
- Equity at exit
- $47,554
Cash invested: $154,000 (down + closing). Projections, not guarantees.
Landlord ↔ Tenant lean methodology
- Overall (STATE)
- 27 Tenant-Leaning
- State Connecticut
- 27 Tenant-Leaning · D+7
- County
- — inherits STATE
- City
- — inherits STATE
ZIP-level market 06424
- Home prices YoY
- -34.6%
- Active inventory
- 60
- Price-to-rent
- 33.9×
Monthly cashflow live
- Estimated rent
- $5,411 medium interval (Pro) →
- Mortgage (P&I)
- −$2,884
- Tax est. 1.5%
- −$688 /mo · $8,250/yr
- Insurance
- −$229
- HOA
- −$0
- Vacancy / Maint / Mgmt
- −$1,136
- Net cashflow
- $474
Break-even live
Sensitivity live
| Price | -10% $854 | -5% $664 | +0% $474 | +5% $284 | +10% $94 |
|---|---|---|---|---|---|
| Rent | -10% $46 | -5% $260 | +0% $474 | +5% $687 | +10% $901 |
| Rate | -1.0pp $751 | -0.5pp $614 | base $474 | +0.5pp $331 | +1.0pp $186 |
4-unit breakdown (identical units grouped — click to expand)
| Units | Beds | Baths | Est. rent |
|---|---|---|---|
| 4× units | 1 | 1 | $5,412 |
| #1 | 1 | 1 | $1,353 |
| #2 | 1 | 1 | $1,353 |
| #3 | 1 | 1 | $1,353 |
| #4 | 1 | 1 | $1,353 |
| Total (4 units) | $5,411 | ||
UW: 25.0% down · 7.5% · 30yr · 1.5% tax · 5.0% vac · 8.0% maint · 8.0% mgmt
Financing live
Cash to close
- Down payment
- $137,500
- Closing costs
- $16,500
- Reserves months
- —
- Total cash needed
- —
Loan-product check · same deal, 3 products live
Conventional
25% down · 7.5% · 30yr
- Down + closing
- —
- Monthly P&I
- —
- Monthly cashflow
- —
- DSCR
- —
- Eligible?
- —
Personal DTI + credit; lowest rate.
DSCR
20% down · 8.5% · 30yr
- Down + closing
- —
- Monthly P&I
- —
- Monthly cashflow
- —
- DSCR
- —
- Eligible?
- —
No personal income docs; deal must DSCR.
Hard money
10% down · 12.0% · 12mo
- Down + closing
- —
- Monthly P&I
- —
- Monthly cashflow
- —
- DSCR
- —
- Eligible?
- —
Short-term bridge; refi at stabilization.
Listing history 16 events
-
2026-06-18days on market $550,000 Active 65 DOM
-
2026-06-17days on market $550,000 Active 64 DOM
-
2026-06-16days on market $550,000 Active 63 DOM
-
2026-06-15days on market $550,000 Active 62 DOM
-
2026-06-13days on market $550,000 Active 60 DOM
-
2026-06-12days on market $550,000 Active 59 DOM
-
2026-06-09days on market $550,000 Active 56 DOM
-
2026-06-08days on market $550,000 Active 55 DOM
-
2026-06-07days on market $550,000 Active 54 DOM
-
2026-06-07days on market $550,000 Active 53 DOM
-
2026-06-04days on market $550,000 Active 50 DOM
-
2026-06-02days on market $550,000 Active 49 DOM
-
2026-06-01days on market $550,000 Active 48 DOM
-
2026-05-31days on market $550,000 Active 47 DOM
-
2026-05-31days on market $550,000 Active 46 DOM
-
2026-04-13$550,000 Active 143-char remark
Show marketing remark (143 chars)
Investment opportunity in East Hampton Village Center. 4 units + 1 store front. Individual utilities and fully rented in month-to-month leases.
ⓘ Source: listings_history table (triggers on properties + properties_extension) + one-shot
backfill from property_details.listing_events for pre-trigger history.
Nearby sold comps map
Loading sold comps map…
Walkable amenities ~0.75 mi
Loading nearby amenities…
Taxation est. · year 1
- Rental income
- $64,932
- − Mortgage interest
- −$30,809
- − Property taxes
- −$8,250
- − Insurance
- −$2,750
- − Repairs & maintenance
- −$5,195
- − Management
- −$5,195
- − Depreciation
- −$16,000
- Taxable loss
- −$3,266
- Est. tax savings @ 24.0%
- +$784
- After-tax cash flow
- $6,469/yr
For passive investors: Depreciation is non-cash, so a rental often shows a tax loss while cash-flowing — sheltering income. Rental losses are passive: they offset passive income freely, and up to $25,000/yr can offset ordinary (W-2) income if you actively participate and your MAGI is under $100k (phasing out to $0 by $150k); unused losses carry forward. On sale, claimed depreciation is recaptured at up to 25%, and gains may owe capital-gains tax (a 1031 exchange can defer both). Figures are a year-1 estimate at your 24.0% rate — not tax advice; consult a CPA.
Condition & rehab AI · 6 photos
This multi-family property requires significant exterior repairs and maintenance, including a new roof and exterior painting, to improve its condition and value.
Repairs flagged
- Major siding — Significant wear and tear on the siding.
- Major roof — Aged roof with visible signs of wear.
- Major fencing — Fencing is in poor condition and may need repair or replacement.
Value-add opportunities
- Both repair and replace roof — A new roof will significantly improve the home's appearance and value.
- Both repair and paint exterior — A fresh coat of paint will enhance the home's curb appeal and value.
- Both landscape and maintain yard — A well-maintained yard and landscaping will improve the home's curb appeal and rental value.
Renovation cost estimate screening
| Repair item | Severity | Est. cost |
|---|---|---|
| siding · Significant wear and tear on the siding. | Major | $15,000–50,000 |
| roof · Aged roof with visible signs of wear. | Major | $15,000–50,000 |
| fencing · Fencing is in poor condition and may need repair or replacement. | Major | $15,000–50,000 |
| Total estimated repair cost · 3 items | $45,000–150,000 |
Value-add ROI direction
- Both repair and replace roof — A new roof will significantly improve the home's appearance and value. ↑
- Both repair and paint exterior — A fresh coat of paint will enhance the home's curb appeal and value. ↑
- Both landscape and maintain yard — A well-maintained yard and landscaping will improve the home's curb appeal and rental value. ↑
ⓘ Cost ranges are severity-bucket heuristics (US national rule-of-thumb). Get contractor quotes + a written scope before underwriting a rehab budget.
Schools (NCES district)
- District
- East Hampton School District
- NCES district ID
- 0901230
- Math proficiency
- 43% ▼ -13.00%
- Reading proficiency
- 59% ▼ -8.00%
- Median HH income
- $91,846
- Composite
- 47.55/100
- National rank
- #2265
- State rank
- #70 of 153 in CT
Livability — East Hampton
- Score
- 82/100
- State rank
- #13
- US rank
- #1301
Category grades
Schools grade is shown separately in the Schools card above.
Census & demographics
- Census place
- East Hampton, CT
- Population (ZIP)
- 12,401
Population outlook (Lower Connecticut River Valley County) Hauer SSP2
- By 2040
- 188,651
Race, ethnicity, and origin ACS 2023
- Neighborhood character
- Predominantly White (87%)
- Race & ethnicity
- White 87% Two or more races 6% Hispanic / Latino 6% Asian 3%
- Hispanic origin (detail)
- Puerto Rican 4%
- Common ancestry
- Romanian 11% Lithuanian 4% Italian 4%
- Foreign-born
- 5% · Canada
- Languages at home
- 93% English-only · Other Indo-European 2% Spanish 2% French/Haitian/Cajun 1%
Political lean MEDSL · Lower Connecticut River Valley
- 2024 margin
- D (+13.4) · D 55.9% · R 42.4% · Other 1.7%
- All cycles
- 2024: D+13.4
Not yet ingested
- Civics
- —
Market trends
- HPI YoY
- ▼ -100.67%
- Current HPI
- 190.1694
- Rent YoY
- —
- Metro
- —
- State GDP YoY
- ▲ 1.06%
- F500 in state
- 38
Industry mix (Fortune 500 HQ in CT)
| Industry | F500 HQs | Revenue |
|---|---|---|
| Industrial Machinery | 4 | $38B |
|
||
| Insurance | 3 | $71B |
|
||
| Financial Services | 2 | $25B |
|
||
| Transportation / Logistics | 2 | $18B |
|
||
| Healthcare | 1 | $247B |
|
||
| Telecommunications | 1 | $55B |
|
||
Price history
1 event — show timeline
- 2026-04-13 Listed $550,000 Smart MLS
Cash-flow waterfall
monthlySold comps — $/sqft
last 12 mo · ≤1 miLoading sold comps…