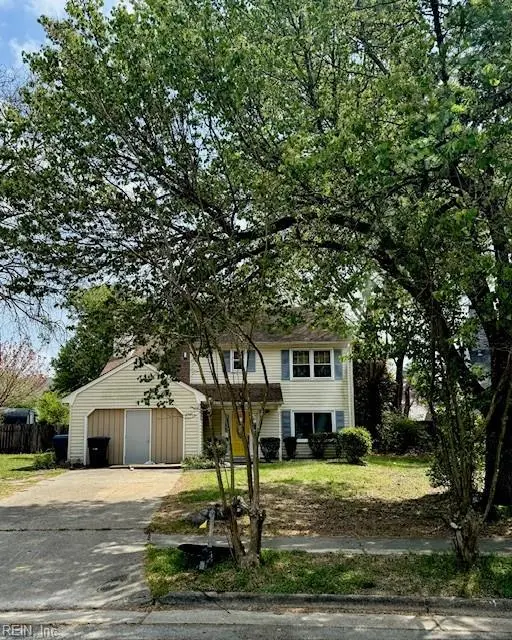
2048 Trumbull Ct · Virginia Beach, VA
Flood risk 3/10 · Minor
- FEMA flood zone
- X (unshaded)
- Chance of flooding over 30 yrs
- 0.2%
- Est. flood insurance / yr
- $507 – $1,088
Fire risk 3/10 · Minor
- Est. fire insurance / yr
- $666 – $1,236
Heat risk 9/10 · Severe
- Hot days now (above 105°F)
- 7 days/yr
- Hot days in 30 yrs
- 16 days/yr
Wind risk 8/10 · Major
- Chance of severe wind over 30 yrs
- 80.0%
Air-quality risk 3/10 · Minor
- Unhealthy air days now
- 2 days/yr
- Unhealthy air days in 30 yrs
- 4 days/yr
Risk factors via First Street. Map © Google.
Why this score? — see what drove the D+ grade
The composite is a weighted blend of 9 inputs, each scored 0–100. Each bar is that input's sub-score; the figure is the points it added to the 100-point composite (weight × sub-score).
- ARV discount +15.0/15.0
- Cash flow +11.3/30.0
- Schools +6.4/10.0
- Livability +4.2/5.0
- Rent growth +4.1/5.0
- DSCR +3.3/10.0
- 1% rule +2.8/10.0
- Condition / age +2.5/5.0
- Appreciation +0.0/10.0
$340,000
🖨 Deal sheet (PDF) 📄 Offer letter ✓ Due diligence
Listing remarks
This property is being sold As-Is, Where-Is. Spacious home in the sought after area of Pleasant Valley and Salem. Boasting to have one of the biggest lots in the neighborhood and the biggest lot in the cul-de-sac. In need of some TLC. But Be ready to walk into a beautiful area, neighborhood and plenty of equity.
Key facts
- 0.23 acre lot
- Garage
- Built 1986
Property features AI
Finance
- HOA & community: No HOA fees (N/A / none)
Exterior
- Parking: Driveway parking; Garage (approx. 318 sq ft)
- Utilities: City/County water; City/County sewer; Electric power
- Home design: Detached traditional home; Two stories; Slab foundation; Simple ownership
- Construction: Vinyl exterior; Asphalt shingle roof; Slab foundation
- Exterior features: Vinyl siding; Back fenced yard; Asphalt shingle roof
Interior
- Kitchen: Electric range; Microwave; Dishwasher; Disposal; Refrigerator
- Bedrooms: One bedroom with ensuite
- Flooring: Carpet; Ceramic; Laminate
- Bathrooms: Two full bathrooms and one half bathroom
- Heating & cooling: Electric heating; Central air conditioning
- Interior features: One fireplace; Carpet, ceramic, and laminate flooring; 8 total rooms; No bedroom with full bathroom on first floor
- Laundry & utility: Washer hookup; Dryer hookup; Electric water heater
Neighborhood map
What this means for you Summary
Snapshot
- This is a 4-bed/2.5-bath single-family listed at $340k.
Deal economics
- At list price, monthly cash flow is $-127 ($-2k/yr) — negative.
- To cash-flow at today's rent, offer at most $318k (6.6% below list).
- To meet the 1% rule (rent ≥ 1% of price), the offer needs to be $265k (22.1% below list).
- Recommended offer: $265k (22.1% below list) — sets the bar for 1% rule.
- Cap rate 5.8% vs local median 3.5% in Virginia Beach — top-decile yield for the area; either an underpriced asset or a hidden risk that comps aren't pricing in. Stress-test before assuming the spread holds.
Location & tenants
- Location reads 83/100 on livability (#38 in VA, #880 nationally) — a professional / high-income tenant draw. Strengths: amenities A+, employment A+, housing A+; Watch: cost of living C-, commute F.
- Va Beach City Public School District (urban): math 69% / reading 78% proficiency, ranked #10 of 131 in VA (top 8%) — strong family-tenant draw, lease renewals of 3-5y typical.
- Zoned schools: Glenwood Elementary (math 72% / reading 81%, grade A, #195 of 1,108 statewide, top 18%, 986 students, 44% FRL); Salem Middle (math 70% / reading 82%, grade A, #42 of 342 statewide, top 13%, 1,073 students, 39% FRL); Salem High (math 79% / reading 90%, grade A, #23 of 319 statewide, top 8%, 1,650 students, 36% FRL).
- Market conditions: Rents rising fast (+6.4%/yr); 234 active listings in the ZIP; 18 comparable units currently listed for rent nearby; rentals at typical pace (median 19d on market — plan ~3-4 weeks tenant-placement turnaround); solid renter incomes; 666 units permitted in Virginia Beach city in 2024 (347 in 5+ unit buildings).
- This rent runs 34% of the median local income ($92k/yr) — at the standard rent-burdened threshold; future hikes will face affordability resistance.
Forward outlook
- Local home prices are declining (-3.0%/yr); year-one equity from $2k of loan paydown is wiped out by about $10k of value loss. Plan a longer hold.
- Virginia Beach County population projected at +6% by 2050 — modest demand growth; plan on rents tracking national, not racing it.
Negotiation context
- Only 8 days on market — expect competitive offers; lowballing is unlikely to land.
- 2 sale attempts with the ask held roughly flat each time — persistent listings suggest the price (not the market) is what's stuck; bring a comps-based counter.
Risks & watch-outs
- Climate carrying-cost: severe wind risk, 80% chance of damaging wind over 30y; extreme-heat days projected 7→16/yr by 2055 (HVAC capex compounding) — expect insurance premiums to compound above CPI over the hold.
Questions for the listing agent
- What do current leases actually rent for vs. the listed asking? Can we see a recent rent roll and the last 12 months of T-12 income?
- Is there a deadline driving the sale (1031 exchange, divorce, estate, relocation)? That informs how much negotiation room exists.
- Schools are A-rated — typically a magnet for longer-tenancy family renters. What's the average tenant stay here, and is there a school-zone premium baked into asking?
- The area grade is low — what's the realistic commute time and amenity access for the typical tenant pool here? Any planned neighborhood developments (good or bad) we should know about?
- What's the average days-on-market for RENTAL listings here right now (not sales)? A rising rental-DOM trend means longer vacancies and softer asking-rent achievability than the comps imply.
- What's the recent tenant-quality profile in this submarket — average credit score on applications, eviction rate, late-payment / NSF rate, and stable-employment percentage? A property-management company in the area should have these aggregated.
- How much new for-sale + rental construction is in the pipeline within 1–3 miles? Heavy new supply typically softens prices + rents 12–24 months out; constrained supply supports both.
Investment metrics
- 1% rule
- 0.78% ✗
- Cap rate
- 5.84%
- Cash-on-cash
- -1.60%
- DSCR
- 0.93
- GRM
- 10.7
CMA / ARV
- ARV (on-the-fly)
- $480,480
- Comps found
- 12
Show comp detail 12 sales within ~0.75 mi
| Address | Dist | Beds/Ba | Sqft | Sold | Price | $/sf | Match |
|---|---|---|---|---|---|---|---|
| 1184 Beaver Falls Ct | 0.33mi | 4/2.5 | 2,078 (-0%) | 0mo | $530,000 | $255 | 84 |
| 2116 Beaver Pond Ct | 0.34mi | 3/2.5 (-1) | 2,180 (+5%) | 4mo | $435,000 | $200 | 68 |
| 1912 Bunnell Ct | 0.60mi | 4/2.5 | 2,076 (-0%) | 6mo | $480,000 | $231 | 67 |
| 1912 Eastover Ct | 0.34mi | 4/2.5 | 1,891 (-9%) | 4mo | $410,000 | $217 | 66 |
| 1292 Raynor Dr | 0.43mi | 4/2.5 | 2,222 (+7%) | 7mo | $495,000 | $223 | 63 |
| 2029 Southaven Dr | 0.27mi | 4/2.5 | 1,813 (-13%) | 4mo | $450,000 | $248 | 63 |
| 2017 Southaven Dr | 0.23mi | 4/2.5 | 1,813 (-13%) | 6mo | $420,000 | $232 | 62 |
| 2004 Springside Ct | 0.67mi | 4/2.5 | 2,012 (-3%) | 2mo | $457,500 | $227 | 62 |
| 1801 Gravenhurst Dr | 0.40mi | 4/2.5 | 1,869 (-10%) | 6mo | $425,000 | $227 | 60 |
| 2525 Archdale Dr | 0.73mi | 4/2.5 | 2,020 (-3%) | 3mo | $495,000 | $245 | 58 |
| 1900 Bunnell Ct | 0.57mi | 4/2.5 | 2,271 (+9%) | 4mo | $500,000 | $220 | 54 |
| 985 Penhook Ct | 0.74mi | 3/3.0 (-1) | 1,854 (-11%) | 4mo | $449,000 | $242 | 37 |
Match score weights: distance 35% · size 25% · config 20% · recency 20%. Top-matched comps best support the ARV.
Projected returns pro-forma
-3.0% appreciation · 6.36% rent growth · sell at horizon
- IRR
- -15.5%
- Equity multiple
- 0.43×
- Total profit
- $-53,993
- Equity at exit
- $50,695
- IRR
- -2.3%
- Equity multiple
- 0.82×
- Total profit
- $-16,947
- Equity at exit
- $29,397
Cash invested: $95,200 (down + closing). Projections, not guarantees.
Landlord ↔ Tenant lean methodology
- Overall (STATE)
- 55 Moderately Landlord-Leaning
- State Virginia
- 55 Moderately Landlord-Leaning · D+2
- County
- — inherits STATE
- City
- — inherits STATE
ZIP-level market 23464
- Rents YoY
- 6.4%
- Active inventory
- 234
- Price-to-rent
- 10.7×
Monthly cashflow live
- Estimated rent
- $2,647 high interval (Pro) →
- Mortgage (P&I)
- −$1,783
- Tax from tax record
- −$294 /mo · $3,526/yr
- Insurance
- −$142
- HOA
- −$0
- Vacancy / Maint / Mgmt
- −$556
- Net cashflow
- $-127
Break-even live
Sensitivity live
| Price | -10% $65 | -5% $-31 | +0% $-127 | +5% $-224 | +10% $-320 |
|---|---|---|---|---|---|
| Rent | -10% $-336 | -5% $-232 | +0% $-127 | +5% $-23 | +10% $82 |
| Rate | -1.0pp $44 | -0.5pp $-41 | base $-127 | +0.5pp $-215 | +1.0pp $-305 |
UW: 25.0% down · 7.5% · 30yr · 1.5% tax · 5.0% vac · 8.0% maint · 8.0% mgmt
Financing live
Cash to close
- Down payment
- $85,000
- Closing costs
- $10,200
- Reserves months
- —
- Total cash needed
- —
Loan-product check · same deal, 3 products live
Conventional
25% down · 7.5% · 30yr
- Down + closing
- —
- Monthly P&I
- —
- Monthly cashflow
- —
- DSCR
- —
- Eligible?
- —
Personal DTI + credit; lowest rate.
DSCR
20% down · 8.5% · 30yr
- Down + closing
- —
- Monthly P&I
- —
- Monthly cashflow
- —
- DSCR
- —
- Eligible?
- —
No personal income docs; deal must DSCR.
Hard money
10% down · 12.0% · 12mo
- Down + closing
- —
- Monthly P&I
- —
- Monthly cashflow
- —
- DSCR
- —
- Eligible?
- —
Short-term bridge; refi at stabilization.
Rent comps 18 comps
| Address | Beds | Baths | Sqft | Rent | $/sqft | DOM | Units | Dist |
|---|---|---|---|---|---|---|---|---|
| 1332 Gravenhurst Cir Virginia Beach, VA | 3.0 | 2.5 | 1505 | $2,295 | $1.52 | 3d | 1 | 0.32mi |
| 1547 Heritage Ave Virginia Beach, VA | 3.0 | 2.5 | 1665 | $2,295 | $1.38 | 25d | 1 | 0.61mi |
| 3813 Sterncroft Dr Virginia Beach, VA | 4.0 | 2.5 | 2124 | $2,789 | $1.31 | 25d | 1 | 0.75mi |
| 1573 Devon Way Virginia Beach, VA | 4.0 | 2.5 | 2000 | $2,650 | $1.32 | 4d | 1 | 0.82mi |
| 5140 Glenwood Way Virginia Beach, VA | 3.0 | 2.5 | 1450 | $2,195 | $1.51 | 23d | 1 | 0.92mi |
| 5125 Middlebrook Ct Virginia Beach, VA | 4.0 | 2.5 | 2395 | $3,195 | $1.33 | 23d | 1 | 0.93mi |
| 4244 Spruce Knob Rd Virginia Beach, VA | 3.0 | 3.0 | 1710 | $2,700 | $1.58 | 16d | 1 | 0.93mi |
| 4501 Van Dyck Dr Virginia Beach, VA | 5.0 | 2.5 | 2867 | $3,700 | $1.29 | 18d | 1 | 0.93mi |
| 5104 Settlers Park Dr Virginia Beach, VA | 3.0 | 2.5 | 1540 | $2,200 | $1.43 | 16d | 1 | 0.97mi |
| 5036 Glenwood Way Virginia Beach, VA | 3.0 | 2.5 | 1455 | $2,495 | $1.71 | 9d | 1 | 1.03mi |
| 1521 Jameson Dr Virginia Beach, VA | 3.0 | 2.5 | 1496 | $1,895 | $1.27 | 25d | 1 | 1.16mi |
| 1328 Fernside Ct Virginia Beach, VA | 4.0 | 2.5 | 2088 | $2,700 | $1.29 | 16d | 1 | 1.18mi |
| 4708 Glencoe Ln Virginia Beach, VA | 3.0 | 2.5 | 1760 | $2,400 | $1.36 | 25d | 1 | 1.24mi |
| 4718 Greenlaw Dr Virginia Beach, VA | 3.0 | 2.5 | 1760 | $2,150 | $1.22 | 19d | 1 | 1.28mi |
| 5181 Eagle Run Rd Virginia Beach, VA | 5.0 | 2.5 | 2500 | $3,300 | $1.32 | 25d | 1 | 1.35mi |
| 4353 Cattail Ln #28 Virginia Beach, VA | 3.0 | 2.5 | 1695 | $2,600 | $1.53 | 12d | 1 | 1.36mi |
| 4220 Derby Wharf Dr Virginia Beach, VA | 3.0 | 2.0 | 1503 | $2,395 | $1.59 | 25d | 1 | 1.36mi |
| 5112 Edon Hall Ln Virginia Beach, VA | 3.0 | 2.5 | 1445 | $2,295 | $1.59 | 16d | 1 | 1.39mi |
Listing history 6 events
-
2026-05-09status Under Contract
-
2026-05-02historical Active Under Contract
-
2026-05-01$340,000 Active
-
2026-04-09historical
-
2026-03-29status Under Contract
-
2026-03-27$340,000 Active
ⓘ Source: listings_history table (triggers on properties + properties_extension) + one-shot
backfill from property_details.listing_events for pre-trigger history.
Tax reassessment forecast VA · Resets to sale price
- Current annual tax
- $3,526 · $294/mo
- Projected year-2 tax
- $3,526 · $294/mo
- Expected delta
- $0/yr ($0/mo · -0.0%)
ⓘ Screening estimate from a state-policy table — verify with the county assessor before closing.
Climate risk First Street
- Flood 3/10 Moderate FEMA zone X (unshaded) · 20% chance over 30 yrs
- Wildfire 3/10 Moderate
- Heat 9/10 Extreme 7 d/yr ≥105°F today · 16 d/yr by 30 yrs out
- Wind 8/10 Severe 80% chance of damaging wind over 30 yrs
- Air quality 3/10 Moderate 2 unhealthy d/yr today · 4 by 30 yrs out
Nearby sold comps map
Loading sold comps map…
Walkable amenities ~0.75 mi
Loading nearby amenities…
Taxation est. · year 1
- Rental income
- $31,765
- − Mortgage interest
- −$19,045
- − Property taxes
- −$3,526
- − Insurance
- −$1,700
- − Repairs & maintenance
- −$2,541
- − Management
- −$2,541
- − Depreciation
- −$9,891
- Taxable loss
- −$7,480
- Est. tax savings @ 24.0%
- +$1,795
- After-tax cash flow
- $267/yr
For passive investors: Depreciation is non-cash, so a rental often shows a tax loss while cash-flowing — sheltering income. Rental losses are passive: they offset passive income freely, and up to $25,000/yr can offset ordinary (W-2) income if you actively participate and your MAGI is under $100k (phasing out to $0 by $150k); unused losses carry forward. On sale, claimed depreciation is recaptured at up to 25%, and gains may owe capital-gains tax (a 1031 exchange can defer both). Figures are a year-1 estimate at your 24.0% rate — not tax advice; consult a CPA.
Schools (NCES district)
- District
- Va Beach City Public School District
- NCES district ID
- 5103840
- Math proficiency
- 69% ▼ -19.00%
- Reading proficiency
- 78% ▼ -7.00%
- Median HH income
- $66,452
- Composite
- 63.81/100
- National rank
- #594
- State rank
- #10 of 131 in VA
Livability — Virginia Beach
- Score
- 83/100
- State rank
- #38
- US rank
- #880
Category grades
Schools grade is shown separately in the Schools card above.
Census & demographics
- Census place
- Virginia Beach, VA
- County
- Virginia Beach City · 448,227 people
- City population
- 448,227
- Metro
- Virginia Beach-Norfolk-Newport News, VA-NC
- Population (ZIP)
- 75,061
- Household income
- $92,468
- Rent vs Own
- Severe rent burden
- 1929.0
Population outlook (Virginia Beach County) Hauer SSP2
- Today (2025)
- 480,401 people
- By 2030
- 491,221 · +2.3%
- By 2040
- 504,882 · +5.1%
- By 2050
- 508,847 · +5.9%
- By 2075
- 504,831 · +5.1%
- By 2100
- 465,867 · -3.0%
Race, ethnicity, and origin ACS 2023
- Neighborhood character
- Diverse neighborhood (Simpson 0.68)
- Race & ethnicity
- White 50% Black 23% Asian 10% Two or more races 9% Hispanic / Latino 9%
- Hispanic origin (detail)
- Mexican 2% Puerto Rican 3%
- Common ancestry
- Slovak 2% Lithuanian 2% Italian 2%
- Foreign-born
- 11% · Canada, Vietnam, China
- Languages at home
- 85% English-only · Tagalog/Filipino 5% Spanish 5% Other Asian/Pacific 1%
Political lean MEDSL · Virginia Beach
- 2024 margin
- Toss-up / Even · D 50.7% · R 48.0% · Other 1.3%
- 2008→2024 swing
- +3.4pp toward D · 2008: -0.7pp · 2024: 2.6pp
- All cycles
- 2024: D+2.6 2020: D+5.4 2016: R+4.5 2012: R+2.5 2008: R+0.7
Not yet ingested
- Civics
- —
Market trends
- HPI YoY
- ▼ -271.27%
- Current HPI
- 324.1854
- Rent YoY
- ▲ 6.36%
- Metro
- Virginia Beach-Norfolk-Newport News, VA-NC
- State GDP YoY
- ▲ 2.40%
- F500 in state
- 50
Industry mix (Fortune 500 HQ in VA)
| Industry | F500 HQs | Revenue |
|---|---|---|
| Aerospace / Defense | 4 | $236B |
|
||
| Technology / Defense | 3 | $32B |
|
||
| Financial Services | 2 | $176B |
|
||
| Utilities | 2 | $27B |
|
||
| Insurance | 2 | $25B |
|
||
| Technology | 2 | $15B |
|
||
Price history
+0.0% since first listed6 events — show timeline
- 2026-05-09 Pending — REINMLS
- 2026-05-02 Contingent — REINMLS
- 2026-05-01 Listed $340,000 REINMLS
- 2026-04-09 Listing Removed — REINMLS
- 2026-03-29 Pending — REINMLS
- 2026-03-27 Listed $340,000 REINMLS
Property tax history
+4.1%/yrLatest (2025): $3,526 · +1.8% YoY. Source: county tax records.
Cash-flow waterfall
monthlySold comps — $/sqft
last 12 mo · ≤1 miLoading sold comps…