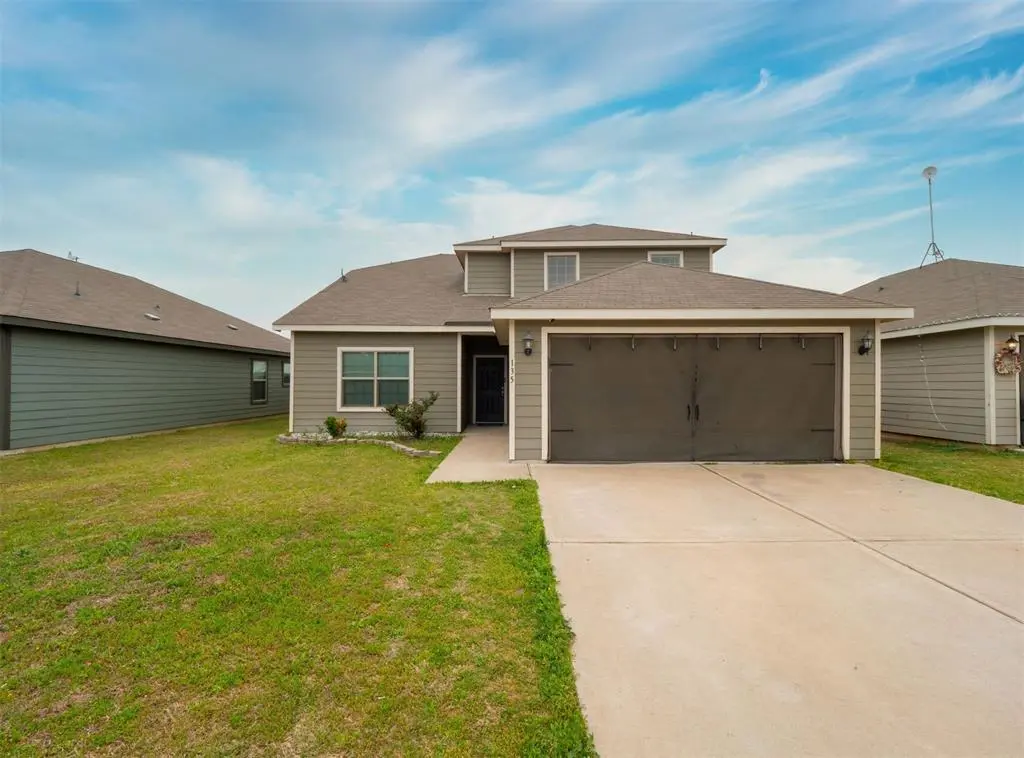
135 Bush Dr · Venus, TX
Flood risk 1/10 · Minimal
- FEMA flood zone
- X (unshaded)
- Chance of flooding over 30 yrs
- 0.0%
- Est. flood insurance / yr
- $507 – $1,088
Fire risk 4/10 · Minor
- Est. fire insurance / yr
- $1,222 – $2,270
Heat risk 7/10 · Major
- Hot days now (above 110°F)
- 7 days/yr
- Hot days in 30 yrs
- 24 days/yr
Wind risk 6/10 · Moderate
- Chance of severe wind over 30 yrs
- 27.0%
Air-quality risk 2/10 · Minimal
- Unhealthy air days now
- 2 days/yr
- Unhealthy air days in 30 yrs
- 2 days/yr
Risk factors via First Street. Map © Google.
Why this score? — see what drove the D grade
The composite is a weighted blend of 9 inputs, each scored 0–100. Each bar is that input's sub-score; the figure is the points it added to the 100-point composite (weight × sub-score).
- ARV discount +13.6/15.0
- Appreciation +8.7/10.0
- Cash flow +6.3/30.0
- Livability +3.5/5.0
- Rent growth +3.1/5.0
- 1% rule +3.0/10.0
- Schools +2.5/10.0
- Condition / age +2.5/5.0
- DSCR +0.6/10.0
$299,990
🖨 Deal sheet (PDF) 📄 Offer letter ✓ Due diligence
Listing remarks MLS
Accepting CASH Offers Only for Quick Close - Recent construction built 2021, 2-story, 4bdrm, 2.5 baths with open floor plan, with new grey LVP flooring (luxury vinyl plank) and new grey carpet. Master bedrm large enough for sitting area to watch the morning sun rise with your favorite tea or coffee. Relax in your master bathroom garden tub and the walk-in-closet is large enough to be used as a dressing room. When it's time to entertain there's a choice of living rm, breakfast rm or breakfast counter - just take your choice of open spaces. Kitchen with granite counters, large walk-in pantry and the stainless steel REFRIGERATOR STAYS. Upstairs has 3 amazing large bedrms each with walk-in closets. Able to have an office, playroom, study or guest room - this home is very versatile. When you're ready, just walkout to your large backyd with full open view. WASHER and DRYER BOTH STAY, REFRIGERATOR STAYS and Builder's warranty transfers to new owner.
Key facts
- Walk-in closet
- Open layout
- Granite countertops
Tags
Property features AI
Finance
- Financial info: Second mortgage reported
- HOA & community: Mandatory HOA; HOA managed by First Service Residential; HOA fee $185 semi-annually; HOA fees cover full use of facilities, insurance, and maintenance of grounds
Exterior
- Parking: Attached 2-car garage; Covered parking for 2 vehicles; On-street parking available
- Utilities: City water; City sewer; Sewer available; Not in a municipal utility district
- Home design: Single family residence; Two-story; Residential property; Smart home features
- Construction: Built in 2021; Composition roof; Slab foundation
- Exterior features: Wood fencing; Lot less than 0.5 acre; Subdivision: Patriot Estates Ph 7b
Interior
- Kitchen: Granite countertops; Breakfast bar; Built-in cabinets; Walk-in pantry; Dishwasher; Electric range; Microwave; Refrigerator; Disposal; Electric water heater
- Bedrooms: 4 bedrooms total; Primary bedroom on main level with walk-in closet; Additional bedrooms on second level with walk-in closets
- Flooring: Carpet; Luxury vinyl plank; Tile
- Bathrooms: 3 bathrooms (2 full, 1 half); Primary bathroom with dual sinks, separate shower, garden tub and linen closet; Ensuite bath for primary
- Heating & cooling: Central heating (electric); Central air (electric)
- Interior features: Open floorplan; Granite counters; Pantry; Cable TV available
- Laundry & utility: Washer and dryer excluded from sale
Neighborhood map
What this means for you Summary
Snapshot
- This is a 4-bed/3.0-bath single-family listed at $300k.
Deal economics
- At list price, monthly cash flow is $-538 ($-6k/yr) — negative.
- To cash-flow at today's rent, offer at most $205k (31.7% below list).
- To meet the 1% rule (rent ≥ 1% of price), the offer needs to be $240k (19.9% below list).
- Recommended offer: $205k (31.7% below list) — sets the bar for cash-flow.
- Cap rate 4.1% vs local median 3.0% in Venus — top-decile yield for the area; either an underpriced asset or a hidden risk that comps aren't pricing in. Stress-test before assuming the spread holds.
Location & tenants
- Location reads 70/100 on livability (#356 in TX) — a middle-class / working-renter tenant base. Strengths: crime A+, employment A+, cost of living A+; Watch: amenities F, commute F, health & safety F.
- Venus ISD (town): math 25% / reading 32% proficiency, ranked #646 of 826 in TX (top 78%) — low school quality limits family demand, transient renter base, plan for 1-2y turnover; 60% free/reduced lunch — lower-income household profile, screen leases tightly.
- Zoned schools: Venus El (math 27% / reading 30%, grade F, #2,706 of 4,322 statewide, top 63%, 658 students, 82% FRL) — zoned schools average 82% FRL vs 60% district-wide (22 pts higher); higher-poverty schools than district average — tighter screening recommended.
- Market conditions: Rents rising (+2.4%/yr); 426 active listings in the ZIP; 23 comparable units currently listed for rent nearby; rentals leasing fast (median 8d on market — plan ~1-2 weeks tenant-placement turnaround); solid renter incomes; 2,152 units permitted in Johnson County in 2024 (76 in 5+ unit buildings).
Forward outlook
- In year one you build about $24k of equity ($2k loan paydown + $22k appreciation (7.3% local appreciation)).
- Johnson County population projected at +24% by 2050 — long-run rental-demand tailwind backs the buy-and-hold thesis.
- By year 2, paydown + projected appreciation supports a ~$38k cash-out refi (75% LTV) — recoverable capital for the next deal without selling this one.
Negotiation context
- Only 7 days on market — expect competitive offers; lowballing is unlikely to land.
- 5 sale attempts since 6y ago with the ask held roughly flat each time — persistent listings suggest the price (not the market) is what's stuck; bring a comps-based counter.
Risks & watch-outs
- Watch-outs: property tax is 2.8% of price.
- Climate carrying-cost: major wind risk, 27% chance of damaging wind over 30y; extreme-heat days projected 7→24/yr by 2055 (HVAC capex compounding) — expect insurance premiums to compound above CPI over the hold.
Questions for the listing agent
- What do current leases actually rent for vs. the listed asking? Can we see a recent rent roll and the last 12 months of T-12 income?
- Property tax is high relative to price — has the assessment been appealed recently, and will the sale trigger a re-assessment?
- What does the HOA fee cover, when was the last increase, and are there any pending special assessments or reserve-fund shortfalls?
- Is there a deadline driving the sale (1031 exchange, divorce, estate, relocation)? That informs how much negotiation room exists.
- Schools are D-rated, which usually means shorter tenancies and higher turnover. Who's the typical renter profile here, and what's been the actual vacancy rate?
- The area grade is low — what's the realistic commute time and amenity access for the typical tenant pool here? Any planned neighborhood developments (good or bad) we should know about?
- What's the average days-on-market for RENTAL listings here right now (not sales)? A rising rental-DOM trend means longer vacancies and softer asking-rent achievability than the comps imply.
- What's the recent tenant-quality profile in this submarket — average credit score on applications, eviction rate, late-payment / NSF rate, and stable-employment percentage? A property-management company in the area should have these aggregated.
- How much new for-sale + rental construction is in the pipeline within 1–3 miles? Heavy new supply typically softens prices + rents 12–24 months out; constrained supply supports both.
Investment metrics
- 1% rule
- 0.80% ✗
- Cap rate
- 4.14%
- Cash-on-cash
- -7.68%
- DSCR
- 0.66
- GRM
- 10.4
CMA / ARV
- ARV (on-the-fly)
- $346,860
- Comps found
- 12
Show comp detail 12 sales within ~0.75 mi
| Address | Dist | Beds/Ba | Sqft | Sold | Price | $/sf | Match |
|---|---|---|---|---|---|---|---|
| 202 Julian Davis Dr | 0.09mi | 4/2.5 | 2,189 (+4%) | 2mo | $359,900 | $164 | 87 |
| 203 Julian Davis Dr | 0.07mi | 4/2.5 | 2,189 (+4%) | 3mo | $321,900 | $147 | 87 |
| 206 Julian Davis Dr | 0.09mi | 4/2.5 | 2,189 (+4%) | 3mo | $307,900 | $141 | 86 |
| 106 Rushmore Ln | 0.33mi | 4/2.5 | 2,135 (+1%) | 4mo | $293,000 | $137 | 77 |
| 518 Bennie Leonard St | 0.34mi | 4/2.5 | 1,985 (-6%) | 4mo | $294,900 | $149 | 69 |
| 124 Patrick Henry Dr | 0.43mi | 5/3.0 (+1) | 2,054 (-3%) | 2mo | $339,590 | $165 | 69 |
| 219 Patton Ln | 0.61mi | 4/2.5 | 2,189 (+4%) | 1mo | $359,900 | $164 | 63 |
| 305 Patton Ln | 0.65mi | 4/2.5 | 2,189 (+4%) | 0mo | $359,900 | $164 | 62 |
| 153 Jefferson Dr | 0.47mi | 3/2.5 (-1) | 2,228 (+5%) | 0mo | $289,500 | $130 | 62 |
| 114 Patrick Henry Dr | 0.48mi | 4/2.0 | 1,977 (-6%) | 3mo | $339,990 | $172 | 60 |
| 213 Patton Ln | 0.59mi | 4/2.5 | 2,369 (+12%) | 2mo | $374,990 | $158 | 49 |
| 127 John Laurens Dr | 0.44mi | 3/2.0 (-1) | 1,809 (-14%) | 3mo | $324,990 | $180 | 44 |
Match score weights: distance 35% · size 25% · config 20% · recency 20%. Top-matched comps best support the ARV.
Projected returns pro-forma
7.32% appreciation · 2.39% rent growth · sell at horizon
- IRR
- 12.4%
- Equity multiple
- 1.90×
- Total profit
- $75,230
- Equity at exit
- $214,199
- IRR
- 12.7%
- Equity multiple
- 3.87×
- Total profit
- $241,384
- Equity at exit
- $412,732
Cash invested: $83,997 (down + closing). Projections, not guarantees.
Landlord ↔ Tenant lean methodology
- Overall (STATE)
- 87 Strongly Landlord-Friendly
- State Texas
- 87 Strongly Landlord-Friendly · R+5
- County
- — inherits STATE
- City
- — inherits STATE
ZIP-level market 76084
- Home prices YoY
- 2.1%
- Rents YoY
- 2.4%
- Active inventory
- 426
- Price-to-rent
- 10.4×
Monthly cashflow live
- Estimated rent
- $2,404 high interval (Pro) →
- Mortgage (P&I)
- −$1,573
- Tax from tax record
- −$708 /mo · $8,493/yr
- Insurance
- −$125
- HOA
- −$31
- Vacancy / Maint / Mgmt
- −$505
- Net cashflow
- $-538
Break-even live
Sensitivity live
| Price | -10% $-368 | -5% $-453 | +0% $-538 | +5% $-623 | +10% $-708 |
|---|---|---|---|---|---|
| Rent | -10% $-728 | -5% $-633 | +0% $-538 | +5% $-443 | +10% $-348 |
| Rate | -1.0pp $-387 | -0.5pp $-461 | base $-538 | +0.5pp $-616 | +1.0pp $-695 |
UW: 25.0% down · 7.5% · 30yr · 1.5% tax · 5.0% vac · 8.0% maint · 8.0% mgmt
Financing live
Cash to close
- Down payment
- $74,998
- Closing costs
- $9,000
- Reserves months
- —
- Total cash needed
- —
Loan-product check · same deal, 3 products live
Conventional
25% down · 7.5% · 30yr
- Down + closing
- —
- Monthly P&I
- —
- Monthly cashflow
- —
- DSCR
- —
- Eligible?
- —
Personal DTI + credit; lowest rate.
DSCR
20% down · 8.5% · 30yr
- Down + closing
- —
- Monthly P&I
- —
- Monthly cashflow
- —
- DSCR
- —
- Eligible?
- —
No personal income docs; deal must DSCR.
Hard money
10% down · 12.0% · 12mo
- Down + closing
- —
- Monthly P&I
- —
- Monthly cashflow
- —
- DSCR
- —
- Eligible?
- —
Short-term bridge; refi at stabilization.
Rent comps 23 comps
| Address | Beds | Baths | Sqft | Rent | $/sqft | DOM | Units | Dist |
|---|---|---|---|---|---|---|---|---|
| 201 Julian Davis Dr Venus, TX | 3.0 | 2.5 | 1626 | $2,195 | $1.35 | 20d | 1 | 0.07mi |
| 208 Julian Davis Dr Venus, TX | 4.0 | 2.0 | 1784 | $2,330 | $1.31 | 12d | 1 | 0.09mi |
| 214 Julian Davis Dr Venus, TX | 4.0 | 2.0 | 1784 | $2,355 | $1.32 | 44d | 1 | 0.10mi |
| 170 Kennedy Dr Venus, TX | 4.0 | 2.0 | 1661 | $2,300 | $1.38 | 2d | 1 | 0.26mi |
| 147 Sammy Fowler Ave Venus, TX | 4.0 | 2.0 | 1690 | $2,250 | $1.33 | 2d | 1 | 0.28mi |
| 108 Rushmore Ln Venus, TX | 4.0 | 2.0 | 1658 | $1,969 | $1.19 | 25d | 1 | 0.33mi |
| 523 Bennie Leonard St Venus, TX | 4.0 | 2.0 | 1690 | $2,350 | $1.39 | 2d | 1 | 0.35mi |
| 628 Blackland Dr Venus, TX | 4.0 | 2.5 | 1483 | $2,200 | $1.48 | 2d | 1 | 0.37mi |
| 325 Condie Russell Ave Venus, TX | 4.0 | 2.5 | 2189 | $2,325 | $1.06 | 13d | 1 | 0.38mi |
| 358 Condie Russell Ave Venus, TX | 3.0 | 2.0 | 1658 | $1,995 | $1.20 | 2d | 1 | 0.38mi |
| 201 John Laurens Dr Venus, TX | 3.0–5.0 | 2.0–2.5 | 1975 | $2,535 | $1.28 | 2d | 1 | 0.39mi |
| 428 Condie Russell Ave Venus, TX | 4.0 | 2.0 | 1784 | $2,150 | $1.21 | 24d | 1 | 0.39mi |
| 512 Albert Anthony St Venus, TX | 3.0 | 2.0 | 1658 | $1,990 | $1.20 | 22d | 1 | 0.39mi |
| 640-644 Wheatfield DR Venus, TX | 4.0 | 2.0 | 1926 | $2,100 | $1.09 | 2d | 1 | 0.40mi |
| 131 Mt Vernon Ln Venus, TX | 3.0 | 2.0 | 1652 | $2,169 | $1.31 | 22d | 1 | 0.41mi |
| 120 Mt Vernon Ln Venus, TX | 3.0 | 2.0 | 1661 | $2,149 | $1.29 | 44d | 1 | 0.43mi |
| 720 Blackland Dr Venus, TX | 4.0 | 2.5 | 1926 | $2,200 | $1.14 | 8d | 1 | 0.45mi |
| 112 Liberty Ln Venus, TX | 4.0 | 2.0 | 1658 | $2,309 | $1.39 | 44d | 1 | 0.45mi |
| 135 Houston Pl Venus, TX | 3.0 | 2.0 | 1590 | $2,029 | $1.28 | 2d | 1 | 0.46mi |
| 101 Hancock St Venus, TX | 3.0 | 2.5 | 1773 | $1,929 | $1.09 | 2d | 1 | 0.55mi |
| 313 Patton Ln Venus, TX | 4.0 | 2.0 | 1784 | $2,355 | $1.32 | 8d | 1 | 0.66mi |
| 113 Franklin Ct Venus, TX | 5.0 | 2.0 | 2959 | $2,370 | $0.80 | 2d | 1 | 0.66mi |
| 315 Patton Ln Venus, TX | 4.0 | 2.5 | 2173 | $2,515 | $1.16 | 3d | 1 | 0.66mi |
HOA detail
- Monthly dues
- $31 · $372/yr
Listing history 7 events
-
2026-06-18days on market $299,990 Active 7 DOM
-
2026-06-17days on market $299,990 Active 6 DOM
-
2026-06-16days on market $299,990 Active 5 DOM
-
2026-06-15days on market $299,990 Active 4 DOM
-
2026-06-13days on market $299,990 Active 2 DOM
-
2026-06-13remarks 693-char remark
-
2026-06-13$299,990 Active 1 DOM
ⓘ Source: listings_history table (triggers on properties + properties_extension) + one-shot
backfill from property_details.listing_events for pre-trigger history.
Tax reassessment forecast TX · Resets to sale price
- Current annual tax
- $8,493 · $708/mo
- Projected year-2 tax
- $8,493 · $708/mo
- Expected delta
- $0/yr ($0/mo · 0.0%)
ⓘ Screening estimate from a state-policy table — verify with the county assessor before closing.
Climate risk First Street
- Flood 1/10 Low FEMA zone X (unshaded) · 0% chance over 30 yrs
- Wildfire 4/10 Moderate
- Heat 7/10 Severe 7 d/yr ≥110°F today · 24 d/yr by 30 yrs out
- Wind 6/10 Major 27% chance of damaging wind over 30 yrs
- Air quality 2/10 Low 2 unhealthy d/yr today · 2 by 30 yrs out
Nearby sold comps map
Loading sold comps map…
Walkable amenities ~0.75 mi
Loading nearby amenities…
Taxation est. · year 1
- Rental income
- $28,847
- − Mortgage interest
- −$16,804
- − Property taxes
- −$8,493
- − Insurance
- −$1,500
- − Repairs & maintenance
- −$2,308
- − Management
- −$2,308
- − HOA
- −$372
- − Depreciation
- −$8,727
- Taxable loss
- −$11,664
- Est. tax savings @ 24.0%
- +$2,799
- After-tax cash flow
- $-3,654/yr
For passive investors: Depreciation is non-cash, so a rental often shows a tax loss while cash-flowing — sheltering income. Rental losses are passive: they offset passive income freely, and up to $25,000/yr can offset ordinary (W-2) income if you actively participate and your MAGI is under $100k (phasing out to $0 by $150k); unused losses carry forward. On sale, claimed depreciation is recaptured at up to 25%, and gains may owe capital-gains tax (a 1031 exchange can defer both). Figures are a year-1 estimate at your 24.0% rate — not tax advice; consult a CPA.
Schools (NCES district)
- District
- Venus ISD
- NCES district ID
- 4844010
- Math proficiency
- 25% ▼ -15.00%
- Reading proficiency
- 32% ▼ -2.00%
- Median HH income
- $50,394
- Composite
- 24.97/100
- National rank
- #7563
- State rank
- #646 of 826 in TX
Livability — Venus
- Score
- 70/100
- State rank
- #356
- US rank
- #7724
Category grades
Schools grade is shown separately in the Schools card above.
Census & demographics
- Census place
- Venus, TX
- County
- Johnson County · 147,987 people
- Metro
- Dallas-Fort Worth-Arlington, TX
- Population (ZIP)
- 14,097
- Household income
- $102,115
- Rent vs Own
- Severe rent burden
- 70.0
Population outlook (Johnson County) Hauer SSP2
- Today (2025)
- 179,678 people
- By 2030
- 189,208 · +5.3%
- By 2040
- 207,261 · +15.4%
- By 2050
- 223,064 · +24.1%
- By 2075
- 259,979 · +44.7%
- By 2100
- 275,395 · +53.3%
Race, ethnicity, and origin ACS 2023
- Neighborhood character
- Diverse neighborhood (Simpson 0.63)
- Race & ethnicity
- White 52% Hispanic / Latino 30% Two or more races 24% Black 11% Asian 1%
- Hispanic origin (detail)
- Mexican 25% Puerto Rican 1%
- Common ancestry
- Romanian 2% Lithuanian 1% Slovak 1%
- Foreign-born
- 8% · Canada
- Languages at home
- 78% English-only · Spanish 18% Arabic 1% French/Haitian/Cajun 1%
Political lean MEDSL · Johnson
- 2024 margin
- Solid R (+51.4) · D 23.9% · R 75.3%
- 2008→2024 swing
- -3.9pp toward R · 2008: -47.5pp · 2024: -51.4pp
- All cycles
- 2024: R+51.4 2020: R+53.0 2016: R+58.3 2012: R+55.6 2008: R+47.5
Not yet ingested
- Civics
- —
Market trends
- HPI YoY
- ▲ 7.32%
- Current HPI
- 355.74
- Rent YoY
- ▲ 2.39%
- Metro
- Dallas-Fort Worth-Arlington, TX
- State GDP YoY
- ▲ 3.95%
- F500 in state
- 110
Industry mix (Fortune 500 HQ in TX)
| Industry | F500 HQs | Revenue |
|---|---|---|
| Energy | 16 | $1,198B |
|
||
| Technology | 5 | $198B |
|
||
| Engineering / Construction | 4 | $72B |
|
||
| Energy Services | 3 | $60B |
|
||
| Utilities | 3 | $41B |
|
||
| Healthcare | 2 | $330B |
|
||
Price history
+27.2% since first listed13 events — show timeline
- 2026-06-11 Listed $299,990 NTREIS
- 2025-12-12 Listing Removed — NTREIS
- 2025-04-22 Listed $315,000 NTREIS
- 2022-05-26 Sold (Public Records) — Public Records
- 2022-05-23 Sold (MLS) — NTREIS
- 2022-05-19 Contingent — NTREIS
- 2022-05-19 Price Changed $340,000 NTREIS
- 2022-05-19 Relisted — NTREIS
- 2022-04-13 Contingent — NTREIS
- 2022-04-04 Listed $320,000 NTREIS
- 2021-01-06 Sold (MLS) — NTREIS
- 2020-08-28 Pending — NTREIS
- 2020-08-14 Listed $235,900 NTREIS
Property tax history
+4.8%/yrLatest (2025): $8,493 · +4.6% YoY. Source: county tax records.
Cash-flow waterfall
monthlySold comps — $/sqft
last 12 mo · ≤1 miLoading sold comps…