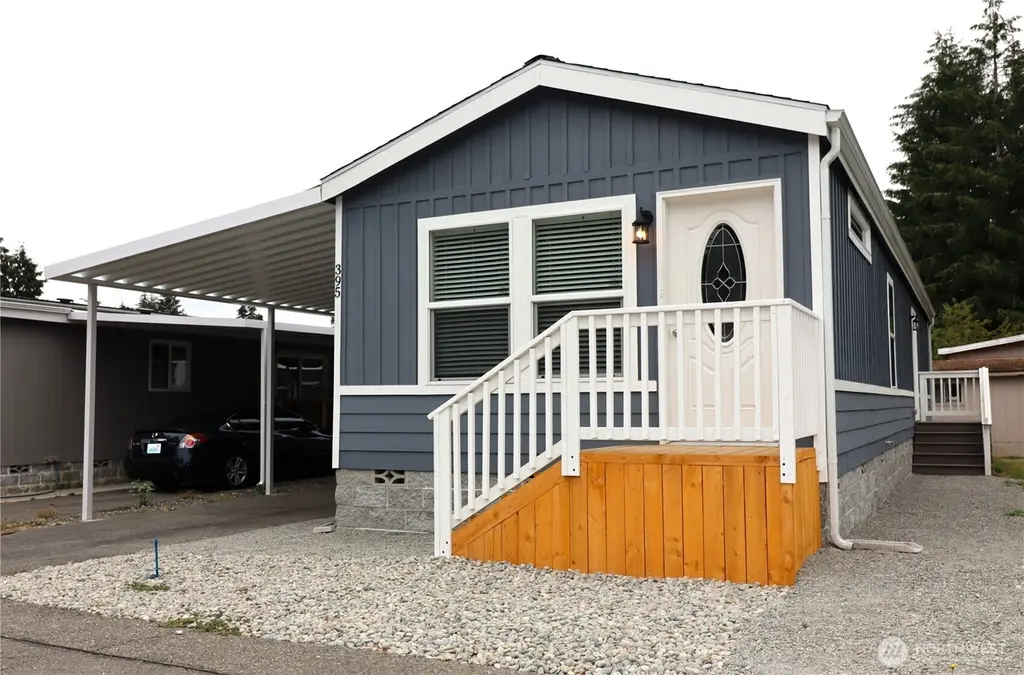
1111 Archwood Dr SW #395 · Olympia, WA
Flood risk No data
- FEMA flood zone
- —
- Chance of flooding over 30 yrs
- —
- Est. flood insurance / yr
- —
Fire risk No data
- Est. fire insurance / yr
- —
Heat risk No data
- Hot days now (above threshold)
- —
- Hot days in 30 yrs
- —
Wind risk No data
- Chance of severe wind over 30 yrs
- —
Air-quality risk No data
- Unhealthy air days now
- —
- Unhealthy air days in 30 yrs
- —
Risk factors via First Street. Map © Google.
Why this score? — see what drove the A grade
The composite is a weighted blend of 9 inputs, each scored 0–100. Each bar is that input's sub-score; the figure is the points it added to the 100-point composite (weight × sub-score).
- Cash flow +30.0/30.0
- ARV discount +12.9/15.0
- 1% rule +10.0/10.0
- DSCR +10.0/10.0
- Appreciation +10.0/10.0
- Schools +6.2/10.0
- Livability +4.2/5.0
- Rent growth +3.3/5.0
- Condition / age +2.5/5.0
$94,500
🖨 Deal sheet (PDF) 📄 Offer letter ✓ Due diligence
Listing remarks
Singlewide for sale at Friendly Ridge! (55+) this home is a 2021: 2 bed / 1 bath / 896 sq. ft. The home is ready with a carport, an exterior storage shed, and gorgeous block skirting. Inside you will find large windows, and a kitchen with stainless appliances (all appliances included in the sale). Also featured: quartz countertops in the kitchen and bathroom. You'll also enjoy a newly renovated community clubhouse with incredible amenities. Friendly Ridge is a wonderful community and is conveniently located near everything Olympia has to offer. Come make it yours!
Key facts
- Quartz countertops
- Stainless appliances
- Carport
Tags
Neighborhood map
What this means for you Summary
Snapshot
- This is a 2-bed/1.0-bath manufactured listed at $94k.
Deal economics
- At list price, monthly cash flow is $539 ($6k/yr) — positive.
- The deal already cash-flows at list — no discount required.
- Meets the 1% rule at list price ($1k rent vs $94k).
- Recommended offer: $83k (12.0% below list) — sets the bar for market timing.
- Cap rate 13.1% vs local median 2.4% in Olympia — top-decile yield for the area; either an underpriced asset or a hidden risk that comps aren't pricing in. Stress-test before assuming the spread holds.
Location & tenants
- Location reads 83/100 on livability (#58 in WA, #1,036 nationally) — a professional / high-income tenant draw. Strengths: amenities A+, commute A+, health & safety A+; Watch: crime F, cost of living D-.
- Olympia School District (urban): math 66% / reading 75% proficiency, ranked #17 of 291 in WA (top 6%) — strong family-tenant draw, lease renewals of 3-5y typical.
- Zoned schools: Julia Butler Hansen Elementary (484 students, 48% FRL); Thurgood Marshall Middle School (441 students, 54% FRL); Capital High School (1,326 students, 38% FRL) — zoned schools average 47% FRL vs 25% district-wide (21 pts higher); higher-poverty schools than district average — tighter screening recommended.
- Market conditions: Rents rising (+3.2%/yr); 307 active listings in the ZIP; 26 comparable units currently listed for rent nearby; rentals at typical pace (median 16d on market — plan ~3-4 weeks tenant-placement turnaround); solid renter incomes; 1,222 units permitted in Thurston County in 2024 (508 in 5+ unit buildings).
Forward outlook
- In year one you build about $10k of equity ($653 loan paydown + $9k appreciation (10.0% local appreciation)).
- Thurston County population projected at +27% by 2050 — long-run rental-demand tailwind backs the buy-and-hold thesis.
- At projected returns (10.0% appreciation + 3.2% rent growth), your $26k cash investment doubles in ~2 years — after that, you're playing with house money.
- By year 4, paydown + projected appreciation supports a ~$36k cash-out refi (75% LTV) — recoverable capital for the next deal without selling this one.
Negotiation context
- It's been on market 327 days — a 12% lower offer ($83k) is reasonable based on typical stale-listing flexibility.
Questions for the listing agent
- It's been on market 327 days. Have you received any prior offers? Is the seller open to a 12% concession, seller financing, or rate buy-down credit?
- Why hasn't it sold? Are there any deal-killer items the seller is aware of (foundation, flood, title, zoning, code violations)?
- Is there a deadline driving the sale (1031 exchange, divorce, estate, relocation)? That informs how much negotiation room exists.
- Schools are A-rated — typically a magnet for longer-tenancy family renters. What's the average tenant stay here, and is there a school-zone premium baked into asking?
- Crime grade is F in this area — have there been break-ins, vandalism, or insurance claims at this property in the last 3 years? What carrier currently insures it and at what premium?
- What's the average days-on-market for RENTAL listings here right now (not sales)? A rising rental-DOM trend means longer vacancies and softer asking-rent achievability than the comps imply.
- What's the recent tenant-quality profile in this submarket — average credit score on applications, eviction rate, late-payment / NSF rate, and stable-employment percentage? A property-management company in the area should have these aggregated.
- How much new for-sale + rental construction is in the pipeline within 1–3 miles? Heavy new supply typically softens prices + rents 12–24 months out; constrained supply supports both.
Investment metrics
- 1% rule
- 1.55% ✓
- Cap rate
- 13.14%
- Cash-on-cash
- 24.47%
- DSCR
- 2.09
- GRM
- 5.4
CMA / ARV
- ARV (median comp)
- $107,457
- List price
- $94,500
- Delta
- -12.06%
- Verdict
- UNDERPRICED
- Comps
- 2 within 1.0 mi
Show comp detail 2 sales within ~0.75 mi
| Address | Dist | Beds/Ba | Sqft | Sold | Price | $/sf | Match |
|---|---|---|---|---|---|---|---|
| 1111 Archwood Dr SW #382 | 0.10mi | 2/2.0 | 960 (+7%) | 2mo | $74,950 | $78 | 78 |
| 1111 Archwood Dr SW #409 | 0.04mi | 2/2.0 | 960 (+7%) | 15mo | $143,500 | $149 | 69 |
Match score weights: distance 35% · size 25% · config 20% · recency 20%. Top-matched comps best support the ARV.
Projected returns pro-forma
10.0% appreciation · 3.16% rent growth · sell at horizon
- IRR
- 42.8%
- Equity multiple
- 4.25×
- Total profit
- $86,068
- Equity at exit
- $85,133
- IRR
- 37.0%
- Equity multiple
- 9.58×
- Total profit
- $226,923
- Equity at exit
- $183,593
Cash invested: $26,460 (down + closing). Projections, not guarantees.
Landlord ↔ Tenant lean methodology
- Overall (STATE)
- 28 Tenant-Leaning
- State Washington
- 28 Tenant-Leaning · D+8
- County
- — inherits STATE
- City
- — inherits STATE
ZIP-level market 98502
- Home prices YoY
- 1.8%
- Rents YoY
- 3.2%
- Active inventory
- 307
- Price-to-rent
- 5.4×
Monthly cashflow live
- Estimated rent
- $1,469 high interval (Pro) →
- Mortgage (P&I)
- −$496
- Tax from tax record
- −$86 /mo · $1,037/yr
- Insurance
- −$39
- HOA
- −$0
- Lot rent leased land?
- −$0
- Vacancy / Maint / Mgmt
- −$309
- Net cashflow
- $539
Break-even live
Sensitivity live
| Price | -10% $593 | -5% $566 | +0% $539 | +5% $513 | +10% $486 |
|---|---|---|---|---|---|
| Rent | -10% $423 | -5% $481 | +0% $539 | +5% $598 | +10% $656 |
| Rate | -1.0pp $587 | -0.5pp $564 | base $539 | +0.5pp $515 | +1.0pp $490 |
UW: 25.0% down · 7.5% · 30yr · 1.5% tax · 5.0% vac · 8.0% maint · 8.0% mgmt
Financing live
Cash to close
- Down payment
- $23,625
- Closing costs
- $2,835
- Reserves months
- —
- Total cash needed
- —
Loan-product check · same deal, 3 products live
Conventional
25% down · 7.5% · 30yr
- Down + closing
- —
- Monthly P&I
- —
- Monthly cashflow
- —
- DSCR
- —
- Eligible?
- —
Personal DTI + credit; lowest rate.
DSCR
20% down · 8.5% · 30yr
- Down + closing
- —
- Monthly P&I
- —
- Monthly cashflow
- —
- DSCR
- —
- Eligible?
- —
No personal income docs; deal must DSCR.
Hard money
10% down · 12.0% · 12mo
- Down + closing
- —
- Monthly P&I
- —
- Monthly cashflow
- —
- DSCR
- —
- Eligible?
- —
Short-term bridge; refi at stabilization.
Rent comps 26 comps
| Address | Beds | Baths | Sqft | Rent | $/sqft | DOM | Units | Dist |
|---|---|---|---|---|---|---|---|---|
| 3311 6th Ave SW Olympia, WA | 1.0–3.0 | 1.0–2.0 | 888 | $2,082 | $2.35 | 16d | 16 | 0.28mi |
| 800 Yauger Way SW Olympia, WA | 1.0–2.0 | 1.0–2.0 | 1034 | $2,131 | $2.06 | 16d | 13 | 0.34mi |
| 1900 Black Lake Blvd SW Olympia, WA | 1.0–3.0 | 1.0–2.0 | 925 | $1,823 | $1.97 | 16d | 13 | 0.56mi |
| 1309 Fern St SW Olympia, WA | 1.0–3.0 | 1.0–2.0 | 802 | $1,906 | $2.37 | 16d | 2 | 0.59mi |
| 1220 Fern St SW Olympia, WA | 2.0 | 2.0 | 900 | $1,850 | $2.06 | 46d | 2 | 0.69mi |
| 1000 Fern St SW Olympia, WA | 1.0–2.0 | 1.0–2.0 | 892 | $2,281 | $2.56 | 16d | 8 | 0.76mi |
| 2010 8th Ct SW Olympia, WA | 2.0 | 2.0 | 1072 | $2,295 | $2.14 | 23d | 1 | 0.82mi |
| 2800 Limited Ln NW Olympia, WA | 1.0–2.0 | 1.0–2.0 | 775 | $1,503 | $1.94 | 16d | 4 | 0.85mi |
| 600 Black Lake Blvd SW Olympia, WA | 1.0–2.0 | 1.0 | 851 | $1,600 | $1.88 | 16d | 23 | 0.90mi |
| 300 Kenyon St NW Olympia, WA | 1.0–2.0 | 1.0–2.0 | 878 | $1,995 | $2.27 | 16d | 6 | 0.91mi |
| 121 Decatur St NW Olympia, WA | 2.0 | 1.0 | 1000 | $1,695 | $1.70 | 23d | 1 | 1.10mi |
| 125 Decatur St NW Olympia, WA | 2.0 | 1.0 | 980 | $1,900 | $1.94 | 23d | 1 | 1.11mi |
| 1221 Evergreen Park Dr SW Olympia, WA | 2.0 | 1.0 | 880 | $1,749 | $1.99 | 16d | 2 | 1.24mi |
| 1415 Evergreen Park Dr SW Olympia, WA | 2.0 | 2.0 | 1050 | $1,735 | $1.65 | 16d | 1 | 1.28mi |
| 1818 Evergreen Park Dr SW Olympia, WA | 1.0 | 1.0 | 437 | $1,500 | $3.43 | 16d | 4 | 1.33mi |
| 1626 Madison Ave NW Olympia, WA | 2.0 | 2.0 | 1064 | $2,100 | $1.97 | 16d | 1 | 1.34mi |
| 5004 4th Way SW Olympia, WA | 2.0–3.0 | 2.0–2.5 | 1271 | $1,845 | $1.45 | 16d | 5 | 1.34mi |
| 1919 Evergreen Park Dr SW Olympia, WA | 1.0 | 1.0 | 695 | $1,450 | $2.09 | 23d | 1 | 1.35mi |
| 2820 Tuscany Ln SW Unit 411 Tumwater, WA | 2.0 | 1.0 | 915 | $1,635 | $1.79 | 46d | 1 | 1.40mi |
| 2820 Tuscany Ln SW Tumwater, WA | 1.0–2.0 | 1.0–2.0 | 915 | $1,775 | $1.94 | 16d | 8 | 1.40mi |
| 2820 Tuscany Ln SW Unit 714 Tumwater, WA | 2.0 | 2.0 | 1030 | $1,725 | $1.67 | 23d | 1 | 1.40mi |
| 3120 14th Ave NW Unit 3118-B Olympia, WA | 2.0 | 1.0 | 826 | $1,600 | $1.94 | 46d | 1 | 1.43mi |
| 3120 14th Ave NW Unit 3108-A Olympia, WA | 2.0 | 1.0 | 753 | $1,550 | $2.06 | 46d | 1 | 1.43mi |
| 2121 Evergreen Park Dr SW Unit 48 Olympia, WA | 2.0 | 1.0 | 850 | $1,525 | $1.79 | 46d | 1 | 1.43mi |
| 2008 Evergreen Park Dr SW Olympia, WA | 1.0–2.0 | 1.0 | 750 | $1,799 | $2.40 | 46d | 3 | 1.44mi |
| 1221 Mottman Rd SW Olympia, WA | 1.0–3.0 | 1.0–2.0 | 1011 | $1,948 | $1.93 | 23d | 4 | 1.45mi |
Listing history 19 events
-
2026-06-23days on market $94,500 Active 327 DOM
-
2026-06-22days on market $94,500 Active 326 DOM
-
2026-06-18days on market $94,500 Active 323 DOM
-
2026-06-17days on market $94,500 Active 322 DOM
-
2026-06-16days on market $94,500 Active 321 DOM
-
2026-06-15days on market $94,500 Active 320 DOM
-
2026-06-14days on market $94,500 Active 318 DOM
-
2026-06-13days on market $94,500 Active 317 DOM
-
2026-06-10days on market $94,500 Active 315 DOM
-
2026-06-09days on market $94,500 Active 314 DOM
-
2026-06-08days on market $94,500 Active 313 DOM
-
2026-06-07days on market $94,500 Active 312 DOM
-
2026-06-05days on market $94,500 Active 309 DOM
-
2026-06-02days on market $94,500 Active 307 DOM
-
2026-06-01days on market $94,500 Active 306 DOM
-
2026-05-31days on market $94,500 Active 305 DOM
-
2026-05-30days on market $94,500 Active 304 DOM
-
2025-10-29price $94,500
-
2025-07-30$99,500 Active
ⓘ Source: listings_history table (triggers on properties + properties_extension) + one-shot
backfill from property_details.listing_events for pre-trigger history.
Tax reassessment forecast WA · Resets to sale price
- Current annual tax
- $1,037 · $86/mo
- Projected year-2 tax
- $1,037 · $86/mo
- Expected delta
- $0/yr ($0/mo · 0.0%)
ⓘ Screening estimate from a state-policy table — verify with the county assessor before closing.
Nearby sold comps map
Loading sold comps map…
Walkable amenities ~0.75 mi
Loading nearby amenities…
Taxation est. · year 1
- Rental income
- $17,633
- − Mortgage interest
- −$5,293
- − Property taxes
- −$1,037
- − Insurance
- −$472
- − Repairs & maintenance
- −$1,411
- − Management
- −$1,411
- − Depreciation
- −$2,749
- Taxable income
- $5,260
- Est. tax owed @ 24.0%
- −$1,262
- After-tax cash flow
- $5,212/yr
For passive investors: Depreciation is non-cash, so a rental often shows a tax loss while cash-flowing — sheltering income. Rental losses are passive: they offset passive income freely, and up to $25,000/yr can offset ordinary (W-2) income if you actively participate and your MAGI is under $100k (phasing out to $0 by $150k); unused losses carry forward. On sale, claimed depreciation is recaptured at up to 25%, and gains may owe capital-gains tax (a 1031 exchange can defer both). Figures are a year-1 estimate at your 24.0% rate — not tax advice; consult a CPA.
Schools (NCES district)
- District
- Olympia School District
- NCES district ID
- 5306180
- Math proficiency
- 66% ▼ -2.00%
- Reading proficiency
- 75% ▼ -2.00%
- Median HH income
- $63,852
- Composite
- 62.27/100
- National rank
- #1438
- State rank
- #17 of 291 in WA
Livability — Olympia
- Score
- 83/100
- State rank
- #58
- US rank
- #1036
Category grades
Schools grade is shown separately in the Schools card above.
Census & demographics
- Census place
- Olympia, WA
- County
- Thurston County · 269,345 people
- City population
- 98,428
- Metro
- Olympia-Lacey-Tumwater, WA
- Population (ZIP)
- 35,398
- Household income
- $92,207
- Rent vs Own
- Severe rent burden
- 1811.0
Population outlook (Thurston County) Hauer SSP2
- Today (2025)
- 308,239 people
- By 2030
- 326,483 · +5.9%
- By 2040
- 359,890 · +16.8%
- By 2050
- 391,800 · +27.1%
- By 2075
- 468,024 · +51.8%
- By 2100
- 519,890 · +68.7%
Race, ethnicity, and origin ACS 2023
- Neighborhood character
- Predominantly White (71%)
- Race & ethnicity
- White 71% Two or more races 13% Hispanic / Latino 11% Asian 6% Black 3% Native American 1%
- Hispanic origin (detail)
- Mexican 3% Puerto Rican 4%
- Common ancestry
- Italian 5% Portuguese 4% Iranian 3%
- Foreign-born
- 8% · Vietnam, Canada, China
- Languages at home
- 90% English-only · Spanish 3% Vietnamese 2% Other Asian/Pacific 1%
Political lean MEDSL · Thurston
- 2024 margin
- Strong D (+20.4) · D 58.5% · R 38.1% · Other 3.5%
- 2008→2024 swing
- -1.3pp toward R · 2008: 21.7pp · 2024: 20.4pp
- All cycles
- 2024: D+20.4 2020: D+18.6 2016: D+15.4 2012: D+19.0 2008: D+21.7
Not yet ingested
- Civics
- —
Market trends
- HPI YoY
- ▲ 18.49%
- Current HPI
- 1056.49
- Rent YoY
- ▲ 3.16%
- Metro
- Olympia-Lacey-Tumwater, WA
- State GDP YoY
- ▲ 4.65%
- F500 in state
- 22
Industry mix (Fortune 500 HQ in WA)
| Industry | F500 HQs | Revenue |
|---|---|---|
| Retail | 2 | $269B |
|
||
| Technology / Retail | 1 | $638B |
|
||
| Technology | 1 | $245B |
|
||
| Telecommunications | 1 | $38B |
|
||
| Food / Beverage | 1 | $36B |
|
||
| Automotive / Trucks | 1 | $34B |
|
||
Price history
-5.0% since first listed2 events — show timeline
- 2025-10-29 Price Changed $94,500 NWMLS as Distributed by MLS Grid
- 2025-07-30 Listed $99,500 NWMLS as Distributed by MLS Grid
Property tax history
+15.4%/yrLatest (2026): $1,037 · +19.8% YoY. Source: county tax records.
Cash-flow waterfall
monthlySold comps — $/sqft
last 12 mo · ≤1 miLoading sold comps…